 Duplex
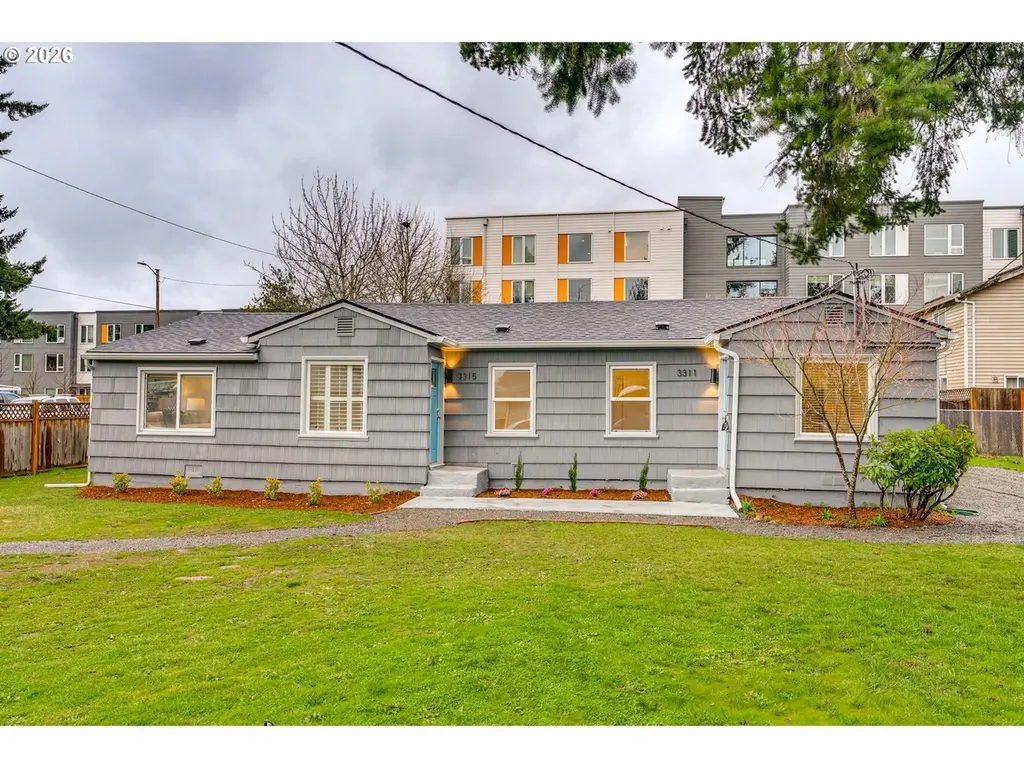
3311 3315 SE 127th Pl · Portland, OR
Flood risk 1/10 · Minimal
- FEMA flood zone
- X (unshaded)
- Chance of flooding over 30 yrs
- 0.0%
- Est. flood insurance / yr
- $507 – $1,088
Fire risk 3/10 · Minor
- Est. fire insurance / yr
- $498 – $926
Heat risk 3/10 · Minor
- Hot days now (above 92°F)
- 7 days/yr
- Hot days in 30 yrs
- 15 days/yr
Wind risk 1/10 · Minimal
- Chance of severe wind over 30 yrs
- —
Air-quality risk 10/10 · Severe
- Unhealthy air days now
- 23 days/yr
- Unhealthy air days in 30 yrs
- 27 days/yr
Risk factors via First Street. Map © Google.
Why this score? — see what drove the D- grade
The composite is a weighted blend of 9 inputs, each scored 0–100. Each bar is that input's sub-score; the figure is the points it added to the 100-point composite (weight × sub-score).
- Cash flow +13.1/30.0
- DSCR +3.9/10.0
- Livability +3.9/5.0
- Schools +3.7/10.0
- 1% rule +3.1/10.0
- Rent growth +2.9/5.0
- ARV discount +2.7/15.0
- Condition / age +2.5/5.0
- Appreciation +0.0/10.0
$400,000
🖨 Deal sheet 📄 Offer letter ✓ Due diligence
Multi-family units
County records classify this as Multi-Family (2-4 Unit). Listing-text estimate: 2 units. confirmed
Listing remarks
Exceptional investment opportunity in Portland’s Powellhurst-Gilbert neighborhood offering an estimated 6.75% cap rate and strong rental potential. This fully remodeled duplex has been extensively updated, making it a low-maintenance, income-producing property from day one. Major system upgrades include new 200-amp electrical service and panels, a new roof, gutters, exterior paint, and double-pane windows. Both units have been thoughtfully renovated with new flooring, fresh interior paint, new water heaters, updated interior water supply and waste lines, and remodeled kitchens and bathrooms featuring new cabinetry, countertops, and modern electrical and plumbing fixtures. Each unit of
Key facts
- New flooring
- New gutters
- New roof
Tags
Property features AI
Finance
- Other: Zoning: RM1
- Financial info: 2 total units; Unit 1 actual rent: $1,400; Unit 2 actual rent: $1,600; Cap rate: 6.75; Gross rent multiplier: 11.11
Exterior
- Parking: Off-street parking; Total of 4 parking spaces
- Utilities: Public water; Public sewer; Electric service; Geothermal energy efficiency feature; Green certified
- Home design: Multi-family property; Not attached to another building
- Construction: Built in 1950; Composition/shingle roof; Pillar/post/pier foundation
- Exterior features: Shake siding; Wood siding; Level lot; Located on a public road; Paved road
Interior
- Kitchen: Dishwasher; Range; Refrigerator
- Bedrooms: Unit 1: 1 bedroom; Unit 2: 2 bedrooms
- Bathrooms: Unit 1: 1 bathroom; Unit 2: 1 bathroom
- Heating & cooling: Wall heater (no central heating); No cooling listed
- Interior features: Individual storage units; Crawl space basement; Updated/remodeled condition
- Laundry & utility: Washer/dryer hookup in each unit; Electric hot water
Neighborhood map
What this means for you Summary
Snapshot
- This is a 2 × 3-bed/2.0-bath units multifamily listed at $400k.
Deal economics
- At list price, monthly cash flow is $-18 ($-218/yr) — negative. Per door: $-9/mo.
- To cash-flow at today's rent, offer at most $397k (0.8% below list).
- To meet the 1% rule (rent ≥ 1% of price), the offer needs to be $324k (18.9% below list).
- Recommended offer: $324k (18.9% below list) — sets the bar for 1% rule.
- Cap rate 6.2% vs local median 2.2% in Portland — top-decile yield for the area; either an underpriced asset or a hidden risk that comps aren't pricing in. Stress-test before assuming the spread holds.
Location & tenants
- Location reads 77/100 on livability (#72 in OR, #3,256 nationally) — a middle-class / working-renter tenant base. Strengths: amenities A+, commute A+, health & safety A+; Watch: crime F, cost of living F.
- David Douglas SD 40 (urban): math 34% / reading 49% proficiency, ranked #99 of 183 in OR (top 54%) — families likely to look elsewhere, expect single-tenant / working-renter base with shorter leases; 68% free/reduced lunch — lower-income household profile, screen leases tightly.
- Zoned schools: Mill Park Elementary School (446 students, 84% FRL); Ron Russell Middle School (770 students, 77% FRL); David Douglas High School (2,698 students, 73% FRL).
- Market conditions: Rents rising (+1.6%/yr); 204 active listings in the ZIP; 40 comparable units currently listed for rent nearby; rentals at typical pace (median 24d on market — plan ~3-4 weeks tenant-placement turnaround); solid renter incomes; 2,041 units permitted in Multnomah County in 2024 (905 in 5+ unit buildings).
- At $3,244/mo this rent would consume 52% of the median local household income ($75k/yr) (locally 1744% of renters already pay >50% of income on rent) — very limited rent-growth headroom before tenants either downsize or default.
Forward outlook
- Local home prices are declining (-3.0%/yr); year-one equity from $3k of loan paydown is wiped out by about $12k of value loss. Plan a longer hold.
- Multnomah County population projected at +33% by 2050 — long-run rental-demand tailwind backs the buy-and-hold thesis.
Negotiation context
- It's been on market 55 days — a 3% lower offer ($388k) is reasonable based on typical stale-listing flexibility.
- Current owner paid $210k; list at $400k implies a 90% gain — meaningful room to come down on a strong offer.
Risks & watch-outs
- Watch-outs: built in 1950 — expect roof / HVAC / electrical / plumbing capex.
Questions for the listing agent
- What do current leases actually rent for vs. the listed asking? Can we see a recent rent roll and the last 12 months of T-12 income?
- It's been on market 55 days. Have you received any prior offers? Is the seller open to a 19% concession, seller financing, or rate buy-down credit?
- Can we see the unit-by-unit rent roll, current vacancy, and any below-market leases? What's the average tenancy length?
- What capital expenditures (roof, boiler, parking lot, exteriors) have been made in the last 5 years, and what's planned in the next 2?
- Built in 1950 — when were the roof, HVAC, electrical panel, plumbing, and water heater last replaced?
- Is there a deadline driving the sale (1031 exchange, divorce, estate, relocation)? That informs how much negotiation room exists.
- Crime grade is F in this area — have there been break-ins, vandalism, or insurance claims at this property in the last 3 years? What carrier currently insures it and at what premium?
- The area grade is low — what's the realistic commute time and amenity access for the typical tenant pool here? Any planned neighborhood developments (good or bad) we should know about?
- What's the average days-on-market for RENTAL listings here right now (not sales)? A rising rental-DOM trend means longer vacancies and softer asking-rent achievability than the comps imply.
- What's the recent tenant-quality profile in this submarket — average credit score on applications, eviction rate, late-payment / NSF rate, and stable-employment percentage? A property-management company in the area should have these aggregated.
- How much new apartment / multifamily construction is in the pipeline within 1–3 miles? Heavy new supply (>2% of stock underway) typically softens rents 12–24 months out; light construction supports rent growth.
Investment metrics
- 1% rule
- 0.81% ✗
- Cap rate
- 6.24%
- Cash-on-cash
- -0.19%
- DSCR
- 0.99
- GRM
- 10.3
CMA / ARV
- ARV (on-the-fly)
- $361,790
- Comps found
- 1
Show comp detail 1 sale within ~0.75 mi
| Address | Dist | Beds/Ba | Sqft | Sold | Price | $/sf | Match |
|---|---|---|---|---|---|---|---|
| 3311 3315 SE 127th Pl | 0.00mi | 3/2.0 | 1,346 (+11%) | 1mo | $402,000 | $299 | 81 |
Match score weights: distance 35% · size 25% · config 20% · recency 20%. Top-matched comps best support the ARV.
Projected returns pro-forma
-3.0% appreciation · 1.64% rent growth · sell at horizon
- IRR
- -18.1%
- Equity multiple
- 0.37×
- Total profit
- $-70,417
- Equity at exit
- $59,641
- IRR
- -13.0%
- Equity multiple
- 0.28×
- Total profit
- $-80,554
- Equity at exit
- $34,585
Cash invested: $112,000 (down + closing). Projections, not guarantees.
Landlord ↔ Tenant lean methodology
- Overall (CITY)
- 0 Strongly Tenant-Friendly
- State Oregon
- 28 Tenant-Leaning · D+6
- County
- — inherits STATE
- City Portland
- 0 Strongly Tenant-Friendly · D+39
ZIP-level market 97236
- Rents YoY
- 1.6%
- Active inventory
- 204
- Price-to-rent
- 20.6×
Monthly cashflow live
- Estimated rent
- $3,244 high interval (Pro) →
- Mortgage (P&I)
- −$2,098
- Tax from tax record
- −$317 /mo · $3,799/yr
- Insurance
- −$167
- HOA
- −$0
- Vacancy / Maint / Mgmt
- −$681
- Net cashflow
- $-18
Break-even live
2-unit breakdown (identical units grouped — click to expand)
| Units | Beds | Baths | Est. rent |
|---|---|---|---|
| 2× units | 3 | 2 | $3,244 |
| #1 | 3 | 2 | $1,622 |
| #2 | 3 | 2 | $1,622 |
| Total (2 units) | $3,244 | ||
UW: 25.0% down · 7.5% · 30yr · 1.5% tax · 5.0% vac · 8.0% maint · 8.0% mgmt
Financing live
Cash to close
- Down payment
- $100,000
- Closing costs
- $12,000
- Reserves months
- —
- Total cash needed
- —
Loan-product check · same deal, 3 products live
Conventional
25% down · 7.5% · 30yr
- Down + closing
- —
- Monthly P&I
- —
- Monthly cashflow
- —
- DSCR
- —
- Eligible?
- —
Personal DTI + credit; lowest rate.
DSCR
20% down · 8.5% · 30yr
- Down + closing
- —
- Monthly P&I
- —
- Monthly cashflow
- —
- DSCR
- —
- Eligible?
- —
No personal income docs; deal must DSCR.
Hard money
10% down · 12.0% · 12mo
- Down + closing
- —
- Monthly P&I
- —
- Monthly cashflow
- —
- DSCR
- —
- Eligible?
- —
Short-term bridge; refi at stabilization.
Rent comps 40 comps
| Address | Beds | Baths | Sqft | Rent | $/sqft | DOM | Units | Dist |
|---|---|---|---|---|---|---|---|---|
| 3315 SE 127th Pl Unit 1 Portland, OR | 2.0 | 1.0 | 1346 | $1,595 | $1.18 | 11d | 1 | 0.02mi |
| 12713 SE Powell Blvd Unit A-2 Portland, OR | 2.0 | 1.0 | 825 | $1,450 | $1.76 | 43d | 1 | 0.04mi |
| 12550 SE Powell Blvd Portland, OR | 1.0–3.0 | 1.0–2.0 | 1075 | $2,300 | $2.14 | 2d | 2 | 0.08mi |
| 12530 SE Powell Ct Portland, OR | 1.0–2.0 | 1.0 | 642 | $1,625 | $2.53 | 4d | 9 | 0.13mi |
| 12450 SE Powell Ct Unit 41 Portland, OR | 2.0 | 1.0 | 760 | $1,395 | $1.84 | 24d | 1 | 0.16mi |
| 12450 SE Powell Ct Unit 22 Portland, OR | 2.0 | 1.0 | 760 | $1,195 | $1.57 | 3d | 1 | 0.16mi |
| 12450 SE Powell Ct Unit 05 Portland, OR | 2.0 | 1.0 | 760 | $1,625 | $2.14 | 3d | 1 | 0.16mi |
| 12450 SE Powell Ct Unit 04 Portland, OR | 2.0 | 1.0 | 760 | $1,225 | $1.61 | 3d | 1 | 0.16mi |
| 12450 SE Powell Ct Unit 69 Portland, OR | 2.0 | 1.0 | 760 | $1,625 | $2.14 | 24d | 1 | 0.16mi |
| 12450 SE Powell Ct Unit 64 Portland, OR | 2.0 | 1.0 | 760 | $1,295 | $1.70 | 2d | 1 | 0.16mi |
| 13062 SE Powell Blvd Apt 6 Portland, OR | 2.0 | 2.0 | 1100 | $1,550 | $1.41 | 43d | 1 | 0.22mi |
| 3745-3749 SE 127th Pl Unit 3749 Portland, OR | 3.0 | 2.5 | 1467 | $2,195 | $1.50 | 7d | 1 | 0.22mi |
| 13066 SE Powell Blvd Unit 10 Portland, OR | 2.0 | 2.0 | 1100 | $1,550 | $1.41 | 24d | 1 | 0.22mi |
| 13116 SE Powell Blvd Apt 23 Portland, OR | 2.0 | 1.0 | 870 | $1,300 | $1.49 | 43d | 1 | 0.24mi |
| 12616 SE Taggart St Portland, OR | 3.0 | 1.5 | 1329 | $2,295 | $1.73 | 7d | 1 | 0.25mi |
| 13130 SE Powell Blvd Unit 19 Portland, OR | 2.0 | 1.0 | 720 | $1,270 | $1.76 | 24d | 1 | 0.26mi |
| 13130 SE Powell Blvd Unit 15 Portland, OR | 2.0 | 1.0 | 720 | $1,295 | $1.80 | 24d | 1 | 0.26mi |
| 13130 SE Powell Blvd Apt 7 Portland, OR | 2.0 | 1.0 | 720 | $1,195 | $1.66 | 10d | 1 | 0.26mi |
| 12231 SE Bush St Unit 83 Portland, OR | 2.0 | 2.0 | 930 | $1,450 | $1.56 | 24d | 1 | 0.29mi |
| 2658 SE 125th Ave Unit 2654 Portland, OR | 3.0 | 2.5 | 1378 | $2,195 | $1.59 | 3d | 1 | 0.33mi |
| 3540 SE 119th Ave Unit 4 Portland, OR | 2.0 | 2.0 | 900 | $1,550 | $1.72 | 24d | 1 | 0.36mi |
| 3815 SE 122nd Ave Apt 5 Portland, OR | 3.0 | 1.0 | 850 | $1,800 | $2.12 | 43d | 1 | 0.37mi |
| 3815 SE 122nd Ave Unit 4 Portland, OR | 2.0 | 1.0 | 750 | $1,500 | $2.00 | 24d | 1 | 0.37mi |
| 3815 SE 122nd Ave Unit 4 Portland, OR | 2.0 | 1.0 | 750 | $1,500 | $2.00 | 43d | 1 | 0.37mi |
| 12008 SE Bush St Portland, OR | 2.0 | 2.0 | 1036 | $1,700 | $1.64 | 43d | 1 | 0.41mi |
| 3320 SE 134th Ave Portland, OR | 2.0 | 1.0 | 798 | $1,095 | $1.37 | 44d | 1 | 0.41mi |
| 3224 SE 134th Ave Portland, OR | 2.0 | 1.0 | 965 | $1,450 | $1.50 | 2d | 1 | 0.43mi |
| 2931 SE 119th Ave Unit A Portland, OR | 2.0 | 1.0 | 1000 | $1,695 | $1.70 | 22d | 1 | 0.44mi |
| 12815 SE Division St Unit 12811 Portland, OR | 2.0 | 1.0 | 700 | $1,300 | $1.86 | 24d | 1 | 0.44mi |
| 12815 SE Division St Portland, OR | 2.0 | 1.0 | 700 | $1,300 | $1.86 | 43d | 2 | 0.44mi |
| 12815 SE Division St Unit 12809 Portland, OR | 2.0 | 1.0 | 700 | $1,325 | $1.89 | 20d | 1 | 0.44mi |
| 13436 SE Bush St Portland, OR | 2.0–3.0 | 1.5–2.0 | 1075 | $1,995 | $1.86 | 43d | 1 | 0.46mi |
| 11710 SE Powell Blvd Portland, OR | 2.0 | 1.0 | 837 | $1,222 | $1.46 | 2d | 2 | 0.48mi |
| 3228 SE 136th Ave Portland, OR | 2.0–3.0 | 1.5 | 1058 | $1,597 | $1.51 | 4d | 4 | 0.48mi |
| 12645 SE Division St Unit 49 Portland, OR | 2.0 | 1.0 | 825 | $1,400 | $1.70 | 43d | 1 | 0.49mi |
| 12625 SE Division St Unit B Portland, OR | 3.0 | 2.5 | 1420 | $2,395 | $1.69 | 24d | 1 | 0.49mi |
| 3810 SE 117th Pl Portland, OR | 3.0 | 2.5 | 1378 | $2,445 | $1.77 | 24d | 1 | 0.51mi |
| 3208 SE 136th Ave Unit 45 Portland, OR | 2.0 | 1.5 | 900 | $1,397 | $1.55 | 24d | 1 | 0.51mi |
| 3208 SE 136th Ave Unit 3 Portland, OR | 3.0 | 1.5 | 1217 | $1,597 | $1.31 | 24d | 1 | 0.51mi |
| 11837 SE Gladstone St Portland, OR | 2.0 | 1.0 | 806 | $1,695 | $2.10 | 43d | 1 | 0.52mi |
Listing history 5 events
-
2026-05-07status Pending
-
2026-04-29historical Active with Bumpable Contingency
-
2026-04-22price $400,000
-
2026-03-13$424,900 Active
-
2025-12-08soldstatus $210,000
ⓘ Source: listings_history table (triggers on properties + properties_extension) + one-shot
backfill from property_details.listing_events for pre-trigger history.
Tax reassessment forecast OR · Resets to sale price
- Current annual tax
- $3,799 · $317/mo
- Projected year-2 tax
- $3,880 · $323/mo
- Expected delta
- +$81/yr (+$7/mo · 2.1%)
ⓘ Screening estimate from a state-policy table — verify with the county assessor before closing.
Climate risk First Street
- Flood 1/10 Low FEMA zone X (unshaded) · 0% chance over 30 yrs
- Wildfire 3/10 Moderate
- Heat 3/10 Moderate 7 d/yr ≥92°F today · 15 d/yr by 30 yrs out
- Wind 1/10 Low
- Air quality 10/10 Extreme 23 unhealthy d/yr today · 27 by 30 yrs out
Nearby sold comps map
Loading sold comps map…
Walkable amenities ~0.75 mi
Loading nearby amenities…
Taxation est. · year 1
- Rental income
- $38,928
- − Mortgage interest
- −$22,406
- − Property taxes
- −$3,799
- − Insurance
- −$2,000
- − Repairs & maintenance
- −$3,114
- − Management
- −$3,114
- − Depreciation
- −$11,636
- Taxable loss
- −$7,142
- Est. tax savings @ 24.0%
- +$1,714
- After-tax cash flow
- $1,496/yr
For passive investors: Depreciation is non-cash, so a rental often shows a tax loss while cash-flowing — sheltering income. Rental losses are passive: they offset passive income freely, and up to $25,000/yr can offset ordinary (W-2) income if you actively participate and your MAGI is under $100k (phasing out to $0 by $150k); unused losses carry forward. On sale, claimed depreciation is recaptured at up to 25%, and gains may owe capital-gains tax (a 1031 exchange can defer both). Figures are a year-1 estimate at your 24.0% rate — not tax advice; consult a CPA.
Schools (NCES district)
- District
- David Douglas SD 40
- NCES district ID
- 4103940
- Math proficiency
- 34% ▲ 1.00%
- Reading proficiency
- 49% ▲ 1.00%
- Median HH income
- $42,781
- Composite
- 37.38/100
- National rank
- #8926
- State rank
- #99 of 183 in OR
Livability — Portland
- Score
- 77/100
- State rank
- #72
- US rank
- #3256
Category grades
Schools grade is shown separately in the Schools card above.
Census & demographics
- Census place
- Portland, OR
- County
- Multnomah County · 786,692 people
- City population
- 774,334
- Metro
- Portland-Vancouver-Hillsboro, OR-WA
- Population (ZIP)
- 37,558
- Household income
- $75,090
- Rent vs Own
- Severe rent burden
- 1744.0
Population outlook (Multnomah County) Hauer SSP2
- Today (2025)
- 930,825 people
- By 2030
- 996,904 · +7.1%
- By 2040
- 1,121,379 · +20.5%
- By 2050
- 1,242,124 · +33.4%
- By 2075
- 1,464,431 · +57.3%
- By 2100
- 1,576,181 · +69.3%
Race, ethnicity, and origin ACS 2023
- Neighborhood character
- Diverse neighborhood (Simpson 0.67)
- Race & ethnicity
- White 51% Hispanic / Latino 21% Asian 13% Two or more races 12% Black 9% Pacific Islander 1%
- Hispanic origin (detail)
- Mexican 15% Cuban 1%
- Common ancestry
- Italian 3% Scotch-Irish 2% Subsaharan African 2%
- Foreign-born
- 25% · Canada, Vietnam, China
- Languages at home
- 63% English-only · Spanish 16% Vietnamese 6% Russian/Polish/Slavic 5%
Political lean MEDSL · Multnomah
- 2024 margin
- Solid D (+62.1) · D 79.3% · R 17.2% · Other 3.5%
- 2008→2024 swing
- +6.0pp toward D · 2008: 56.1pp · 2024: 62.1pp
- All cycles
- 2024: D+62.1 2020: D+61.3 2016: D+58.3 2012: D+54.9 2008: D+56.1
Not yet ingested
- Civics
- —
Market trends
- HPI YoY
- ▼ -334.44%
- Current HPI
- 289.931
- Rent YoY
- ▲ 1.64%
- Metro
- Portland-Vancouver-Hillsboro, OR-WA
- State GDP YoY
- ▲ 2.05%
- F500 in state
- 2
Industry mix (Fortune 500 HQ in OR)
| Industry | F500 HQs | Revenue |
|---|---|---|
| Consumer Goods | 1 | $51B |
|
||
Price history
+90.5% since first listed5 events — show timeline
- 2026-05-07 Pending — RMLS
- 2026-04-29 Contingent — RMLS
- 2026-04-22 Price Changed $400,000 RMLS
- 2026-03-13 Listed $424,900 RMLS
- 2025-12-08 Sold (Public Records) $210,000 Public Records
Property tax history
+3.7%/yrLatest (2025): $3,799 · +4.4% YoY. Source: county tax records.
Cash-flow waterfall
monthlySold comps — $/sqft
last 12 mo · ≤1 miLoading sold comps…