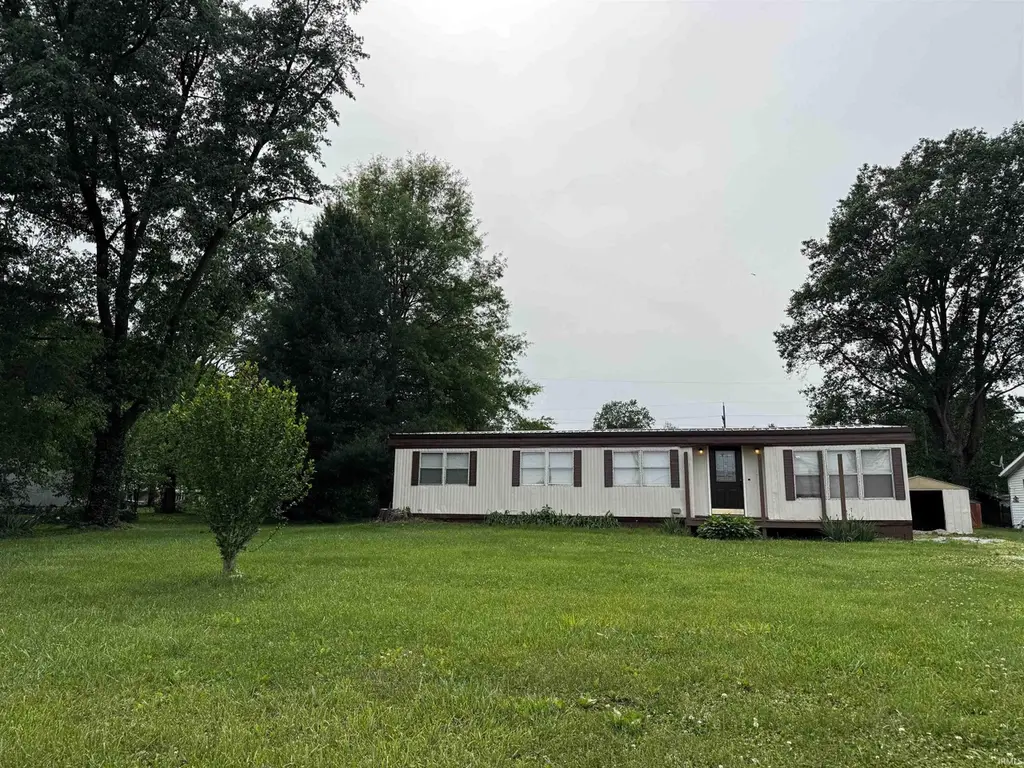
299 S Mathers St · Orleans, IN
Flood risk 1/10 · Minimal
- FEMA flood zone
- X (unshaded)
- Chance of flooding over 30 yrs
- 0.0%
- Est. flood insurance / yr
- $507 – $1,088
Fire risk 2/10 · Minimal
- Est. fire insurance / yr
- $717 – $1,331
Heat risk 5/10 · Moderate
- Hot days now (above 105°F)
- 7 days/yr
- Hot days in 30 yrs
- 20 days/yr
Wind risk 2/10 · Minimal
- Chance of severe wind over 30 yrs
- 2.0%
Air-quality risk 2/10 · Minimal
- Unhealthy air days now
- 0 days/yr
- Unhealthy air days in 30 yrs
- 1 days/yr
Risk factors via First Street. Map © Google.
Why this score? — see what drove the C- grade
The composite is a weighted blend of 9 inputs, each scored 0–100. Each bar is that input's sub-score; the figure is the points it added to the 100-point composite (weight × sub-score).
- Cash flow +26.8/30.0
- DSCR +9.2/10.0
- 1% rule +6.6/10.0
- Livability +3.5/5.0
- Rent growth +2.5/5.0
- Condition / age +2.5/5.0
- Schools +2.4/10.0
- Appreciation +0.2/10.0
- ARV discount +0.0/15.0
$95,000
🖨 Deal sheet 📄 Offer letter ✓ Due diligence
Listing remarks
Welcome to 299 S Mathers St in Orleans! This 3 bedroom, 2 bath home sits on a large city lot and has so much to offer if you’ve been looking for space and a super convenient location. You’re right across the street from Orleans Elementary School, which makes mornings a little easier, and just a few blocks from the town square. Think local restaurants, small shops, parades, the farmers market, and of course the Orleans Dogwood Festival all within easy reach!! The layout gives you a comfortable amount of space inside, while the big yard gives you room to relax, entertain, or do whatever fits your lifestyle! Even better, this home is available for contract sale, which can be a grea
Key facts
- Big yard
- Large city lot
- Convenient location
Tags
Property features AI
Finance
- Other: Lot dimensions approximately 80 x 160 (0.29 acre)
- HOA & community: No association amenities
Exterior
- Parking: Gravel parking
- Utilities: Public water; Public sewer
- Home design: Manufactured home (residential); Single-story; Entry level: main
- Construction: Aluminum siding; Block foundation; Metal roof; Built on crawl space
- Exterior features: Porch; Shed(s); Level lot
Interior
- Kitchen: Microwave; Refrigerator; Gas range; Laminate counters
- Bedrooms: Master on main level
- Flooring: Carpet; Laminate
- Bathrooms: 2 full bathrooms (both on the main level)
- Heating & cooling: Natural gas heating; Forced air heating; Central air conditioning; Has heating and cooling
- Interior features: Walk-in closet(s); Laminate counters; Master bedroom on main level; Blinds
- Laundry & utility: Washer hookup; Electric dryer hookup; Laundry on main level; Gas water heater; Water heater
Neighborhood map
What this means for you Summary
Snapshot
- This is a 3-bed/2.0-bath manufactured listed at $95k.
Deal economics
- At list price, monthly cash flow is $261 ($3k/yr) — positive.
- The deal already cash-flows at list — no discount required.
- Meets the 1% rule at list price ($1k rent vs $95k).
- Recommended offer: $92k (3.0% below list) — sets the bar for market timing.
Location & tenants
- Location reads 70/100 on livability (#154 in IN) — a middle-class / working-renter tenant base. Strengths: crime A+, cost of living A+, housing A+; Watch: health & safety C-, amenities F, commute F.
- Orleans Community Schools (rural): math 23% / reading 33% proficiency, ranked #256 of 301 in IN (top 85%) — low school quality limits family demand, transient renter base, plan for 1-2y turnover.
- Zoned schools: Orleans Elementary School (math 29% / reading 31%, grade F, #693 of 994 statewide, top 70%, 512 students, 55% FRL); Orleans Jr-Sr High School (math 12% / reading 37%, grade F, #325 of 369 statewide, top 91%, 396 students, 50% FRL).
- Market conditions: 20 active listings in the ZIP; 54 units permitted in Orange County in 2024 (40 in 5+ unit buildings).
Forward outlook
- Local home prices are declining (-3.0%/yr); year-one equity from $657 of loan paydown is wiped out by about $3k of value loss. Plan a longer hold.
- Orange County population projected at -14% by 2050 — secular population decline; favor cash flow + early exit over multi-decade hold.
- At projected returns (-3.0% appreciation + 3.0% rent growth), your $27k cash investment doubles in ~10 years — after that, you're playing with house money.
Negotiation context
- It's been on market 48 days — a 3% lower offer ($92k) is reasonable based on typical stale-listing flexibility.
Risks & watch-outs
- Climate carrying-cost: extreme-heat days projected 7→20/yr by 2055 (HVAC capex compounding) — expect insurance premiums to compound above CPI over the hold.
Questions for the listing agent
- It's been on market 48 days. Have you received any prior offers? Is the seller open to a 3% concession, seller financing, or rate buy-down credit?
- Built in 1976 — when were the roof, HVAC, electrical panel, plumbing, and water heater last replaced?
- Is there a deadline driving the sale (1031 exchange, divorce, estate, relocation)? That informs how much negotiation room exists.
- Schools are D-rated, which usually means shorter tenancies and higher turnover. Who's the typical renter profile here, and what's been the actual vacancy rate?
- What's the average days-on-market for RENTAL listings here right now (not sales)? A rising rental-DOM trend means longer vacancies and softer asking-rent achievability than the comps imply.
- What's the recent tenant-quality profile in this submarket — average credit score on applications, eviction rate, late-payment / NSF rate, and stable-employment percentage? A property-management company in the area should have these aggregated.
- How much new for-sale + rental construction is in the pipeline within 1–3 miles? Heavy new supply typically softens prices + rents 12–24 months out; constrained supply supports both.
Investment metrics
- 1% rule
- 1.16% ✓
- Cap rate
- 9.59%
- Cash-on-cash
- 11.79%
- DSCR
- 1.52
- GRM
- 7.2
CMA / ARV
- ARV (median comp)
- $70,575
- List price
- $95,000
- Delta
- 34.61%
- Verdict
- OVERPRICED
- Comps
- 1 within 2.0 mi
Projected returns pro-forma
-3.0% appreciation · 3.0% rent growth · sell at horizon
- IRR
- 1.2%
- Equity multiple
- 1.05×
- Total profit
- $1,239
- Equity at exit
- $14,165
- IRR
- 10.8%
- Equity multiple
- 1.84×
- Total profit
- $22,463
- Equity at exit
- $8,214
Cash invested: $26,600 (down + closing). Projections, not guarantees.
Landlord ↔ Tenant lean methodology
- Overall (STATE)
- 90 Strongly Landlord-Friendly
- State Indiana
- 90 Strongly Landlord-Friendly · R+11
- County
- — inherits STATE
- City
- — inherits STATE
ZIP-level market 47452
- Home prices YoY
- -4.2%
- Active inventory
- 20
- Price-to-rent
- 7.2×
Monthly cashflow live
- Estimated rent
- $1,102 medium interval (Pro) →
- Mortgage (P&I)
- −$498
- Tax from tax record
- −$72 /mo · $862/yr
- Insurance
- −$40
- HOA
- −$0
- Vacancy / Maint / Mgmt
- −$232
- Net cashflow
- $261
Break-even live
UW: 25.0% down · 7.5% · 30yr · 1.5% tax · 5.0% vac · 8.0% maint · 8.0% mgmt
Financing live
Cash to close
- Down payment
- $23,750
- Closing costs
- $2,850
- Reserves months
- —
- Total cash needed
- —
Loan-product check · same deal, 3 products live
Conventional
25% down · 7.5% · 30yr
- Down + closing
- —
- Monthly P&I
- —
- Monthly cashflow
- —
- DSCR
- —
- Eligible?
- —
Personal DTI + credit; lowest rate.
DSCR
20% down · 8.5% · 30yr
- Down + closing
- —
- Monthly P&I
- —
- Monthly cashflow
- —
- DSCR
- —
- Eligible?
- —
No personal income docs; deal must DSCR.
Hard money
10% down · 12.0% · 12mo
- Down + closing
- —
- Monthly P&I
- —
- Monthly cashflow
- —
- DSCR
- —
- Eligible?
- —
Short-term bridge; refi at stabilization.
Listing history 16 events
-
2026-06-18days on market $95,000 Active 48 DOM
-
2026-06-17days on market $95,000 Active 47 DOM
-
2026-06-16days on market $95,000 Active 46 DOM
-
2026-06-15days on market $95,000 Active 45 DOM
-
2026-06-13days on market $95,000 Active 43 DOM
-
2026-06-12days on market $95,000 Active 42 DOM
-
2026-06-09days on market $95,000 Active 39 DOM
-
2026-06-08days on market $95,000 Active 38 DOM
-
2026-06-07days on market $95,000 Active 37 DOM
-
2026-06-07days on market $95,000 Active 36 DOM
-
2026-06-04days on market $95,000 Active 33 DOM
-
2026-06-02days on market $95,000 Active 32 DOM
-
2026-06-01days on market $95,000 Active 31 DOM
-
2026-05-31days on market $95,000 Active 30 DOM
-
2026-05-31days on market $95,000 Active 29 DOM
-
2026-05-01$95,000 Active 849-char remark
ⓘ Source: listings_history table (triggers on properties + properties_extension) + one-shot
backfill from property_details.listing_events for pre-trigger history.
Tax reassessment forecast IN · Partial reset (capped growth)
- Current annual tax
- $862 · $72/mo
- Projected year-2 tax
- $862 · $72/mo
- Expected delta
- $0/yr ($0/mo · 0.0%)
ⓘ Screening estimate from a state-policy table — verify with the county assessor before closing.
Climate risk First Street
- Flood 1/10 Low FEMA zone X (unshaded) · 0% chance over 30 yrs
- Wildfire 2/10 Low
- Heat 5/10 Major 7 d/yr ≥105°F today · 20 d/yr by 30 yrs out
- Wind 2/10 Low 2% chance of damaging wind over 30 yrs
- Air quality 2/10 Low 0 unhealthy d/yr today · 1 by 30 yrs out
Nearby sold comps map
Loading sold comps map…
Walkable amenities ~0.75 mi
Loading nearby amenities…
Taxation est. · year 1
- Rental income
- $13,230
- − Mortgage interest
- −$5,321
- − Property taxes
- −$862
- − Insurance
- −$475
- − Repairs & maintenance
- −$1,058
- − Management
- −$1,058
- − Depreciation
- −$2,764
- Taxable income
- $1,691
- Est. tax owed @ 24.0%
- −$406
- After-tax cash flow
- $2,730/yr
For passive investors: Depreciation is non-cash, so a rental often shows a tax loss while cash-flowing — sheltering income. Rental losses are passive: they offset passive income freely, and up to $25,000/yr can offset ordinary (W-2) income if you actively participate and your MAGI is under $100k (phasing out to $0 by $150k); unused losses carry forward. On sale, claimed depreciation is recaptured at up to 25%, and gains may owe capital-gains tax (a 1031 exchange can defer both). Figures are a year-1 estimate at your 24.0% rate — not tax advice; consult a CPA.
Schools (NCES district)
- District
- Orleans Community Schools
- NCES district ID
- 1808490
- Math proficiency
- 23% ▼ -16.00%
- Reading proficiency
- 33% ▼ -17.00%
- Median HH income
- $41,936
- Composite
- 23.74/100
- National rank
- #7821
- State rank
- #256 of 301 in IN
Livability — Orleans
- Score
- 70/100
- State rank
- #154
- US rank
- #7666
Category grades
Schools grade is shown separately in the Schools card above.
Census & demographics
- Census place
- Orleans, IN
- Population (ZIP)
- 5,118
Population outlook (Orange County) Hauer SSP2
- Today (2025)
- 18,948 people
- By 2030
- 18,479 · -2.5%
- By 2040
- 17,387 · -8.2%
- By 2050
- 16,301 · -14.0%
- By 2075
- 14,361 · -24.2%
- By 2100
- 12,594 · -33.5%
Race, ethnicity, and origin ACS 2023
- Neighborhood character
- Predominantly White (99%)
- Race & ethnicity
- White 99%
- Common ancestry
- Italian 2% Slovak 1% Serbian 1%
- Foreign-born
- 1% · Canada
- Languages at home
- 97% English-only · German/W. Germanic 2%
Political lean MEDSL · Orange
- 2024 margin
- Solid R (+52.1) · D 23.1% · R 75.3% · Other 1.6%
- 2008→2024 swing
- -38.0pp toward R · 2008: -14.2pp · 2024: -52.1pp
- All cycles
- 2024: R+52.1 2020: R+47.6 2016: R+45.8 2012: R+21.6 2008: R+14.2
Not yet ingested
- Civics
- —
Market trends
- HPI YoY
- ▼ -9.63%
- Current HPI
- 220.915
- Rent YoY
- —
- Metro
- —
- State GDP YoY
- ▲ 2.90%
- F500 in state
- 18
Industry mix (Fortune 500 HQ in IN)
| Industry | F500 HQs | Revenue |
|---|---|---|
| Industrial Machinery | 2 | $37B |
|
||
| Healthcare | 1 | $177B |
|
||
| Pharmaceuticals | 1 | $45B |
|
||
| Metals / Steel | 1 | $18B |
|
||
| Agriculture | 1 | $17B |
|
||
| Packaging | 1 | $12B |
|
||
Price history
1 event — show timeline
- 2026-05-01 Listed $95,000 IRMLS
Property tax history
+4.0%/yrLatest (2024): $862 · +6.2% YoY. Source: county tax records.
Cash-flow waterfall
monthlySold comps — $/sqft
last 12 mo · ≤1 miLoading sold comps…