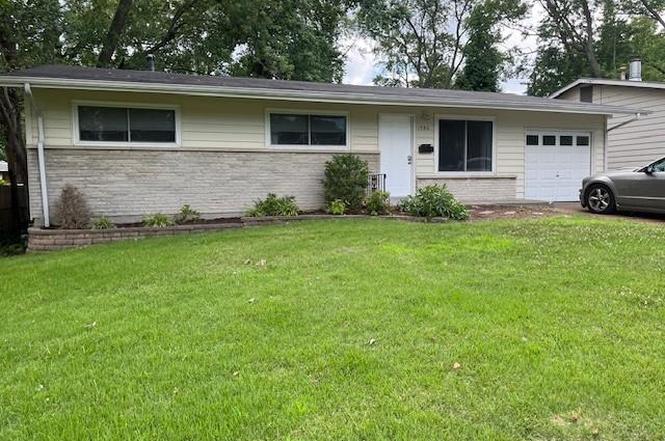
1980 Parker Rd · Florissant, MO
Flood risk 1/10 · Minimal
- FEMA flood zone
- X (unshaded)
- Chance of flooding over 30 yrs
- 0.0%
- Est. flood insurance / yr
- $473 – $860
Fire risk 1/10 · Minimal
- Est. fire insurance / yr
- $1,054 – $1,958
Heat risk 4/10 · Minor
- Hot days now (above 105°F)
- 7 days/yr
- Hot days in 30 yrs
- 21 days/yr
Wind risk 2/10 · Minimal
- Chance of severe wind over 30 yrs
- 1.0%
Air-quality risk 3/10 · Minor
- Unhealthy air days now
- 3 days/yr
- Unhealthy air days in 30 yrs
- 5 days/yr
Risk factors via First Street. Map © Google.
Why this score? — see what drove the C grade
The composite is a weighted blend of 9 inputs, each scored 0–100. Each bar is that input's sub-score; the figure is the points it added to the 100-point composite (weight × sub-score).
- Cash flow +16.4/30.0
- Appreciation +10.0/10.0
- ARV discount +9.7/15.0
- DSCR +5.1/10.0
- Rent growth +4.4/5.0
- 1% rule +3.9/10.0
- Livability +3.7/5.0
- Condition / age +2.5/5.0
- Schools +1.2/10.0
$182,157
🖨 Deal sheet 📄 Offer letter ✓ Due diligence
Listing remarks
Ready to move in. Beautiful house with great location. Amazing renovation for the three bedroom, one full bathroom and a 1/2 bathroom. And an attached drive in garage. Close to major grocery stores and shopping centers. Recently renovated and freshly painted and professionally cleaned. New appliances. Thoroughly cleaned. Hard wood floor refurbished. New landscaping. Pictures look great, but seeing in person is even more impressive. Added benefit of a washer and dryer in the basement and a finished room in the basement and a screened in back porch and a fenced in yard. Property being Sold "As Is"
Key facts
- New landscaping
- Great location
- New appliances
Tags
Property features AI
Finance
- Financial info: Seller may consider concessions; Lease not considered
Exterior
- Parking: Attached 1-car garage
- Utilities: Public water; Public sewer; Electric service by Ameren; Natural gas connected
- Home design: Single-family residence; One level
- Construction: Brick veneer exterior
- Exterior features: Back yard
Interior
- Bedrooms: 3 bedrooms (all on the main level)
- Bathrooms: 1 full bathroom; 1 half bathroom
- Heating & cooling: Forced-air heating (natural gas); Central air conditioning (electric)
- Interior features: Partially finished basement; Gas water heater
Neighborhood map
What this means for you Summary
Snapshot
- This is a 3-bed/1.5-bath single-family listed at $182k.
Deal economics
- At list price, monthly cash flow is $102 ($1k/yr) — positive.
- The deal already cash-flows at list — no discount required.
- To meet the 1% rule (rent ≥ 1% of price), the offer needs to be $162k (10.8% below list).
- Recommended offer: $160k (12.0% below list) — sets the bar for market timing.
Location & tenants
- Location reads 73/100 on livability (#82 in MO) — a middle-class / working-renter tenant base. Strengths: cost of living A+, housing A+, health & safety B+; Watch: crime C-, amenities D+, commute F.
- Ferguson-Florissant R-II (suburban): math 7% / reading 20% proficiency, ranked #311 of 324 in MO (top 96%) — low school quality limits family demand, transient renter base, plan for 1-2y turnover; 70% free/reduced lunch — lower-income household profile, screen leases tightly.
- Zoned schools: Parker Road Elementary (354 students, 99% FRL); Mccluer North High (math 5% / reading 28%, grade F, #487 of 521 statewide, top 93%, 1,136 students, 100% FRL) — zoned schools average 99% FRL vs 70% district-wide (30 pts higher); higher-poverty schools than district average — tighter screening recommended.
- Market conditions: Rents rising fast (+7.5%/yr); 218 active listings in the ZIP; 40 comparable units currently listed for rent nearby; rentals at typical pace (median 24d on market — plan ~3-4 weeks tenant-placement turnaround); 920 units permitted in St. Louis County in 2024 (250 in 5+ unit buildings).
Forward outlook
- In year one you build about $19k of equity ($1k loan paydown + $18k appreciation (10.0% local appreciation)).
- At projected returns (10.0% appreciation + 7.5% rent growth), your $51k cash investment doubles in ~3 years — after that, you're playing with house money.
- By year 2, paydown + projected appreciation supports a ~$31k cash-out refi (75% LTV) — recoverable capital for the next deal without selling this one.
Negotiation context
- It's been on market 142 days — a 12% lower offer ($160k) is reasonable based on typical stale-listing flexibility.
- 3 sale attempts; this cycle's ask is 7% above the opening price — seller raised mid-cycle; expect resistance to lowballs.
- Current owner paid $90k; list at $182k implies a 101% gain — meaningful room to come down on a strong offer.
Risks & watch-outs
- Watch-outs: built in 1958 — expect roof / HVAC / electrical / plumbing capex.
Questions for the listing agent
- It's been on market 142 days. Have you received any prior offers? Is the seller open to a 12% concession, seller financing, or rate buy-down credit?
- Built in 1958 — when were the roof, HVAC, electrical panel, plumbing, and water heater last replaced?
- Why hasn't it sold? Are there any deal-killer items the seller is aware of (foundation, flood, title, zoning, code violations)?
- Is there a deadline driving the sale (1031 exchange, divorce, estate, relocation)? That informs how much negotiation room exists.
- Schools are D-rated, which usually means shorter tenancies and higher turnover. Who's the typical renter profile here, and what's been the actual vacancy rate?
- What's the average days-on-market for RENTAL listings here right now (not sales)? A rising rental-DOM trend means longer vacancies and softer asking-rent achievability than the comps imply.
- What's the recent tenant-quality profile in this submarket — average credit score on applications, eviction rate, late-payment / NSF rate, and stable-employment percentage? A property-management company in the area should have these aggregated.
- How much new for-sale + rental construction is in the pipeline within 1–3 miles? Heavy new supply typically softens prices + rents 12–24 months out; constrained supply supports both.
Investment metrics
- 1% rule
- 0.89% ✗
- Cap rate
- 6.97%
- Cash-on-cash
- 2.41%
- DSCR
- 1.11
- GRM
- 9.3
CMA / ARV
- ARV (on-the-fly)
- $191,360
- Comps found
- 12
Show comp detail 12 sales within ~0.75 mi
| Address | Dist | Beds/Ba | Sqft | Sold | Price | $/sf | Match |
|---|---|---|---|---|---|---|---|
| 1980 Parker Rd | 0.00mi | 3/1.5 | 1,196 (0%) | 1mo | $182,157 | $152 | 100 |
| 1320 Pepperhill Dr | 0.10mi | 3/2.0 | 1,247 (+4%) | 1mo | $200,000 | $160 | 85 |
| 1475 Nashua Dr | 0.27mi | 3/1.5 | 1,160 (-3%) | 0mo | $169,900 | $146 | 82 |
| 1585 Pepperhill Dr | 0.33mi | 3/2.0 | 1,204 (+1%) | 2mo | $225,000 | $187 | 80 |
| 1480 Burning Tree Dr | 0.27mi | 3/2.0 | 1,140 (-5%) | 2mo | $200,000 | $175 | 76 |
| 1420 Nashua Dr | 0.26mi | 3/1.5 | 1,092 (-9%) | 2mo | $199,000 | $182 | 72 |
| 1460 Fox Run Dr | 0.23mi | 4/2.0 (+1) | 1,050 (-12%) | 1mo | $169,900 | $162 | 61 |
| 1020 Belmont Ter | 0.32mi | 3/1.5 | 1,040 (-13%) | 4mo | $159,900 | $154 | 60 |
| 2340 Johnstown Dr | 0.35mi | 3/2.0 | 1,344 (+12%) | 2mo | $119,000 | $89 | 60 |
| 1345 Hialeah Pl | 0.28mi | 4/2.5 (+1) | 1,344 (+12%) | 1mo | $215,000 | $160 | 57 |
| 18 Redwood Dr | 0.61mi | 3/2.0 | 1,046 (-12%) | 2mo | $134,000 | $128 | 47 |
| 8 Winners Cir | 0.58mi | 4/2.0 (+1) | 1,312 (+10%) | 4mo | $249,900 | $190 | 46 |
Match score weights: distance 35% · size 25% · config 20% · recency 20%. Top-matched comps best support the ARV.
Projected returns pro-forma
10.0% appreciation · 7.51% rent growth · sell at horizon
- IRR
- 27.6%
- Equity multiple
- 3.22×
- Total profit
- $113,418
- Equity at exit
- $164,101
- IRR
- 25.3%
- Equity multiple
- 7.81×
- Total profit
- $347,549
- Equity at exit
- $353,891
Cash invested: $51,004 (down + closing). Projections, not guarantees.
Landlord ↔ Tenant lean methodology
- Overall (STATE)
- 81 Strongly Landlord-Friendly
- State Missouri
- 81 Strongly Landlord-Friendly · R+10
- County
- — inherits STATE
- City
- — inherits STATE
ZIP-level market 63033
- Home prices YoY
- 2.5%
- Rents YoY
- 7.5%
- Active inventory
- 218
- Price-to-rent
- 9.3×
Monthly cashflow live
- Estimated rent
- $1,625 high interval (Pro) →
- Mortgage (P&I)
- −$955
- Tax from tax record
- −$150 /mo · $1,797/yr
- Insurance
- −$76
- HOA
- −$0
- Vacancy / Maint / Mgmt
- −$341
- Net cashflow
- $102
Break-even live
UW: 25.0% down · 7.5% · 30yr · 1.5% tax · 5.0% vac · 8.0% maint · 8.0% mgmt
Financing live
Cash to close
- Down payment
- $45,539
- Closing costs
- $5,465
- Reserves months
- —
- Total cash needed
- —
Loan-product check · same deal, 3 products live
Conventional
25% down · 7.5% · 30yr
- Down + closing
- —
- Monthly P&I
- —
- Monthly cashflow
- —
- DSCR
- —
- Eligible?
- —
Personal DTI + credit; lowest rate.
DSCR
20% down · 8.5% · 30yr
- Down + closing
- —
- Monthly P&I
- —
- Monthly cashflow
- —
- DSCR
- —
- Eligible?
- —
No personal income docs; deal must DSCR.
Hard money
10% down · 12.0% · 12mo
- Down + closing
- —
- Monthly P&I
- —
- Monthly cashflow
- —
- DSCR
- —
- Eligible?
- —
Short-term bridge; refi at stabilization.
Rent comps 40 comps
| Address | Beds | Baths | Sqft | Rent | $/sqft | DOM | Units | Dist |
|---|---|---|---|---|---|---|---|---|
| 1004 N New Florissant Rd Florissant, MO | 2.0 | 1.0 | 719 | $1,375 | $1.91 | 23d | 1 | 0.29mi |
| 1045 N New Florissant Rd Florissant, MO | 2.0 | 1.0 | 783 | $1,250 | $1.60 | 14d | 1 | 0.30mi |
| 560 Jamaica Pl Florissant, MO | 3.0 | 2.0 | 1350 | $1,653 | $1.22 | 43d | 1 | 0.47mi |
| 1725 Saint Catherine St Florissant, MO | 3.0 | 1.0 | 1107 | $1,800 | $1.63 | 14d | 1 | 0.48mi |
| 20 Saint Benedict Ln Florissant, MO | 3.0 | 1.5 | 1092 | $1,525 | $1.40 | 20d | 1 | 0.53mi |
| 1280 Saint Catherine St Florissant, MO | 3.0 | 1.0 | 1274 | $1,600 | $1.26 | 14d | 1 | 0.59mi |
| 10 Saint Celeste Dr Florissant, MO | 2.0 | 1.0 | 716 | $1,290 | $1.80 | 12d | 1 | 0.59mi |
| 9 Saint Celeste Dr Florissant, MO | 3.0 | 1.0 | 992 | $1,450 | $1.46 | 43d | 1 | 0.62mi |
| 410 Ridge Dr Florissant, MO | 3.0 | 2.0 | 1226 | $1,650 | $1.35 | 17d | 1 | 0.62mi |
| 3 Champlain Ct Florissant, MO | 3.0 | 1.0 | 1100 | $1,600 | $1.45 | 43d | 1 | 0.66mi |
| 1785 Trotter Way Florissant, MO | 3.0 | 2.0 | 1297 | $1,806 | $1.39 | 7d | 1 | 0.72mi |
| 1600 Horseshoe Dr Florissant, MO | 3.0 | 2.0 | 1314 | $1,550 | $1.18 | 43d | 1 | 0.72mi |
| 1545 Washington St Florissant, MO | 3.0 | 1.5 | 1337 | $2,055 | $1.54 | 3d | 1 | 0.73mi |
| 1710 Kay Dr Florissant, MO | 3.0 | 1.0 | 960 | $1,500 | $1.56 | 2d | 1 | 0.76mi |
| 1600 Washington St Florissant, MO | 3.0 | 1.5 | 1095 | $1,250 | $1.14 | 20d | 1 | 0.79mi |
| 765 Bobbins Ln Florissant, MO | 3.0 | 1.0 | 1107 | $1,450 | $1.31 | 43d | 1 | 0.81mi |
| 297 Saint Eugene Ln Florissant, MO | 2.0 | 1.0 | 1100 | $1,100 | $1.00 | 43d | 1 | 0.82mi |
| 100 Taney Dr Florissant, MO | 3.0 | 1.0 | 1148 | $1,495 | $1.30 | 21d | 1 | 0.86mi |
| 790 Pebble Ln Florissant, MO | 3.0 | 2.0 | 1242 | $1,795 | $1.45 | 23d | 1 | 0.90mi |
| 2990 Santiago Dr Florissant, MO | 2.0 | 2.0 | 984 | $1,200 | $1.22 | 43d | 1 | 0.98mi |
| 305 S Lafayette St Florissant, MO | 3.0 | 1.0 | 864 | $1,409 | $1.63 | 16d | 1 | 1.02mi |
| 470 Hundley Dr Florissant, MO | 3.0 | 2.0 | 962 | $1,595 | $1.66 | 43d | 1 | 1.16mi |
| 1983 Greenheath Dr Florissant, MO | 3.0 | 2.0 | 1040 | $1,331 | $1.28 | 3d | 1 | 1.20mi |
| 330 Moule Dr Florissant, MO | 3.0 | 1.0 | 1014 | $1,575 | $1.55 | 43d | 1 | 1.20mi |
| 167 Reeb Ln Florissant, MO | 1.0–2.0 | 1.0 | 850 | $1,300 | $1.53 | 2d | 4 | 1.22mi |
| 155 Reeb Ln Apt 2 Florissant, MO | 2.0 | 1.0 | 850 | $995 | $1.17 | 43d | 1 | 1.22mi |
| 1180 S New Florissant Rd Florissant, MO | 3.0 | 1.0 | 925 | $1,225 | $1.32 | 23d | 1 | 1.23mi |
| 50 Lynn Meadows Ln Florissant, MO | 3.0 | 1.0 | 864 | $1,450 | $1.68 | 23d | 1 | 1.26mi |
| 3209 Cross Keys Dr Florissant, MO | 1.0–2.0 | 1.0 | 700 | $1,100 | $1.57 | 1d | 1 | 1.26mi |
| 4 Sharon Ct Florissant, MO | 3.0 | 2.0 | 1108 | $1,800 | $1.62 | 2d | 1 | 1.26mi |
| 3 Cantabrian Ct Florissant, MO | 3.0 | 2.0 | 1436 | $1,881 | $1.31 | 14d | 1 | 1.27mi |
| 23 Quick Dr Apt 2 Florissant, MO | 2.0 | 1.0 | 850 | $1,100 | $1.29 | 43d | 1 | 1.28mi |
| 21 Quick Dr Apt 1 Florissant, MO | 2.0 | 1.0 | 850 | $1,100 | $1.29 | 43d | 1 | 1.28mi |
| 21 Quick Dr Apt 3 Florissant, MO | 2.0 | 1.0 | 850 | $995 | $1.17 | 23d | 1 | 1.28mi |
| 1250 S New Florissant Rd Florissant, MO | 2.0 | 1.0 | 1150 | $1,500 | $1.30 | 14d | 1 | 1.28mi |
| 17 Valley Dr Florissant, MO | 2.0 | 2.0 | 1356 | $1,525 | $1.12 | 43d | 1 | 1.29mi |
| 1465 W Duchesne Dr Florissant, MO | 3.0 | 1.0 | 896 | $1,500 | $1.67 | 43d | 1 | 1.35mi |
| 1050 Ozment Dr Florissant, MO | 3.0 | 2.0 | 984 | $1,525 | $1.55 | 43d | 1 | 1.38mi |
| 1670 Arundel Dr Florissant, MO | 3.0 | 2.0 | 1012 | $1,450 | $1.43 | 23d | 1 | 1.38mi |
| 1095 Ozment Dr Florissant, MO | 3.0 | 2.0 | 984 | $1,461 | $1.48 | 23d | 1 | 1.38mi |
Listing history 16 events
-
2026-05-01status Pending
-
2026-04-13status Active
-
2026-04-13price $182,157
-
2026-04-05status Pending
-
2026-03-17price $186,157
-
2026-03-06price $190,157
-
2026-02-28price $192,057
-
2026-02-16price $193,995
-
2026-01-17price $196,995
-
2025-12-17price $199,995
-
2025-12-14status Active
-
2025-09-18status Pending
-
2025-09-17price $205,000
-
2025-09-07$169,700 Active
-
2003-08-22soldstatus $90,500
-
1994-10-04soldstatus $58,000
ⓘ Source: listings_history table (triggers on properties + properties_extension) + one-shot
backfill from property_details.listing_events for pre-trigger history.
Tax reassessment forecast MO · Resets to sale price
- Current annual tax
- $1,797 · $150/mo
- Projected year-2 tax
- $1,797 · $150/mo
- Expected delta
- $0/yr ($0/mo · 0.0%)
ⓘ Screening estimate from a state-policy table — verify with the county assessor before closing.
Climate risk First Street
- Flood 1/10 Low FEMA zone X (unshaded) · 0% chance over 30 yrs
- Wildfire 1/10 Low
- Heat 4/10 Moderate 7 d/yr ≥105°F today · 21 d/yr by 30 yrs out
- Wind 2/10 Low 100% chance of damaging wind over 30 yrs
- Air quality 3/10 Moderate 3 unhealthy d/yr today · 5 by 30 yrs out
Nearby sold comps map
Loading sold comps map…
Walkable amenities ~0.75 mi
Loading nearby amenities…
Taxation est. · year 1
- Rental income
- $19,494
- − Mortgage interest
- −$10,204
- − Property taxes
- −$1,797
- − Insurance
- −$911
- − Repairs & maintenance
- −$1,560
- − Management
- −$1,560
- − Depreciation
- −$5,299
- Taxable loss
- −$1,835
- Est. tax savings @ 24.0%
- +$440
- After-tax cash flow
- $1,670/yr
For passive investors: Depreciation is non-cash, so a rental often shows a tax loss while cash-flowing — sheltering income. Rental losses are passive: they offset passive income freely, and up to $25,000/yr can offset ordinary (W-2) income if you actively participate and your MAGI is under $100k (phasing out to $0 by $150k); unused losses carry forward. On sale, claimed depreciation is recaptured at up to 25%, and gains may owe capital-gains tax (a 1031 exchange can defer both). Figures are a year-1 estimate at your 24.0% rate — not tax advice; consult a CPA.
Schools (NCES district)
- District
- Ferguson-Florissant R-II
- NCES district ID
- 2912010
- Math proficiency
- 7% ▼ -9.00%
- Reading proficiency
- 20% ▼ -6.00%
- Median HH income
- $44,610
- Composite
- 11.96/100
- National rank
- #9666
- State rank
- #311 of 324 in MO
Livability — Florissant
- Score
- 73/100
- State rank
- #82
- US rank
- #5406
Category grades
Schools grade is shown separately in the Schools card above.
Census & demographics
- Census place
- Florissant, MO
- County
- Saint Louis County · 888,823 people
- City population
- 69,104
- Metro
- St. Louis, MO-IL
- Population (ZIP)
- 43,056
- Household income
- $66,776
- Rent vs Own
- Severe rent burden
- 1429.0
Population outlook (St. Louis County) Hauer SSP2
- Today (2025)
- 1,025,227 people
- By 2030
- 1,028,023 · +0.3%
- By 2040
- 1,020,940 · -0.4%
- By 2050
- 1,007,280 · -1.8%
- By 2075
- 987,277 · -3.7%
- By 2100
- 921,984 · -10.1%
Race, ethnicity, and origin ACS 2023
- Neighborhood character
- Predominantly Black (71%)
- Race & ethnicity
- Black 71% White 23% Two or more races 4% Hispanic / Latino 1%
- Common ancestry
- Romanian 1% Lithuanian 1% Italian 1%
- Foreign-born
- 3% · Canada, Vietnam
- Languages at home
- 95% English-only · Spanish 1% French/Haitian/Cajun 1%
Political lean MEDSL · St. Louis
- 2024 margin
- Strong D (+23.4) · D 60.8% · R 37.4% · Other 1.7%
- 2008→2024 swing
- +3.5pp toward D · 2008: 19.9pp · 2024: 23.4pp
- All cycles
- 2024: D+23.4 2020: D+24.0 2016: D+16.2 2012: D+13.7 2008: D+19.9
Not yet ingested
- Civics
- —
Market trends
- HPI YoY
- ▲ 13.78%
- Current HPI
- 570.6
- Rent YoY
- ▲ 7.51%
- Metro
- St. Louis, MO-IL
- State GDP YoY
- ▲ 1.84%
- F500 in state
- 20
Industry mix (Fortune 500 HQ in MO)
| Industry | F500 HQs | Revenue |
|---|---|---|
| Healthcare | 1 | $163B |
|
||
| Insurance | 1 | $21B |
|
||
| Industrial Technology | 1 | $17B |
|
||
| Retail | 1 | $16B |
|
||
| Industrial Distribution | 1 | $10B |
|
||
| Utilities | 1 | $9B |
|
||
Price history
+214.1% since first listed16 events — show timeline
- 2026-05-01 Pending — MARIS as Distributed by MLS Grid
- 2026-04-13 Relisted — MARIS as Distributed by MLS Grid
- 2026-04-13 Price Changed $182,157 MARIS as Distributed by MLS Grid
- 2026-04-05 Pending — MARIS as Distributed by MLS Grid
- 2026-03-17 Price Changed $186,157 MARIS as Distributed by MLS Grid
- 2026-03-06 Price Changed $190,157 MARIS as Distributed by MLS Grid
- 2026-02-28 Price Changed $192,057 MARIS as Distributed by MLS Grid
- 2026-02-16 Price Changed $193,995 MARIS as Distributed by MLS Grid
- 2026-01-17 Price Changed $196,995 MARIS as Distributed by MLS Grid
- 2025-12-17 Price Changed $199,995 MARIS as Distributed by MLS Grid
- 2025-12-14 Relisted — MARIS as Distributed by MLS Grid
- 2025-09-18 Pending — MARIS as Distributed by MLS Grid
- 2025-09-17 Price Changed $205,000 MARIS as Distributed by MLS Grid
- 2025-09-07 Listed $169,700 MARIS as Distributed by MLS Grid
- 2003-08-22 Sold (Public Records) $90,500 Public Records
- 1994-10-04 Sold (Public Records) $58,000 Public Records
Property tax history
+0.9%/yrLatest (2022): $1,797 · +1.7% YoY. Source: county tax records.
Cash-flow waterfall
monthlySold comps — $/sqft
last 12 mo · ≤1 miLoading sold comps…