108 N Mustang Run -- · Casa Grande, AZ
Flood risk 1/10 · Minimal
- FEMA flood zone
- X (unshaded)
- Chance of flooding over 30 yrs
- 0.0%
- Est. flood insurance / yr
- $507 – $1,088
Fire risk 6/10 · Moderate
- Est. fire insurance / yr
- $610 – $1,132
Heat risk 9/10 · Severe
- Hot days now (above 113°F)
- 7 days/yr
- Hot days in 30 yrs
- 20 days/yr
Wind risk 1/10 · Minimal
- Chance of severe wind over 30 yrs
- —
Air-quality risk 2/10 · Minimal
- Unhealthy air days now
- 1 days/yr
- Unhealthy air days in 30 yrs
- 1 days/yr
Risk factors via First Street. Map © Google.
Why this score? — see what drove the D grade
The composite is a weighted blend of 9 inputs, each scored 0–100. Each bar is that input's sub-score; the figure is the points it added to the 100-point composite (weight × sub-score).
- Cash flow +19.3/30.0
- DSCR +6.1/10.0
- 1% rule +5.1/10.0
- ARV discount +5.0/15.0
- Rent growth +3.7/5.0
- Livability +2.9/5.0
- Schools +1.5/10.0
- Condition / age +1.0/5.0
- Appreciation +0.0/10.0
$221,910
🖨 Deal sheet (PDF) 📄 Offer letter ✓ Due diligence
Listing remarks
55 + RESORT ACTIVE ADULT COMMUNITY 7500 SF FT CLUBHOUSE HEATED COMMUNITY POOL WITH SPA BOCC BALL COURTS 2 PICKLE BALL COURTS 4 OUTDOOR GRILLS FITNESS CENTER DOG PARK
Key facts
- Fitness center
- Pickle ball courts
- 7500 sf ft clubhouse
Tags
Property features AI
Finance
- Financial info: Current financing: Conventional
- HOA & community: No association fees; Land lease $450 monthly
Exterior
- Parking: 2 covered spaces; 2 open parking spaces; 2 garage spaces; 2 carport spaces
- Utilities: Private water company; Public sewer
- Home design: Manufactured/mobile home; Fee simple ownership
- Construction: Aluminum siding; Wood frame construction; Composition roof
- Exterior features: Gravel/stone front and back yard; Fenced (other); Heated spa; Community pool
Interior
- Kitchen: Built-in microwave; Built-in electric oven; Dishwasher; Disposal; Refrigerator; Kitchen island; Laminate countertops
- Bedrooms: Up to 3 possible bedrooms
- Bathrooms: 2 full bathrooms
- Heating & cooling: Heat pump for heating and cooling
- Interior features: Double vanity; Kitchen island; Full bath in primary bedroom; Laminate counters
- Laundry & utility: Laundry inside with washer/dryer hookup only
Neighborhood map
What this means for you Summary
Snapshot
- This is a 3-bed/2.0-bath manufactured listed at $222k. Condition is rated poor.
Deal economics
- At list price, monthly cash flow is $245 ($3k/yr) — positive.
- The deal already cash-flows at list — no discount required.
- Meets the 1% rule at list price ($2k rent vs $222k).
- Recommended offer: $195k (12.0% below list) — sets the bar for market timing.
- Cap rate 7.6% vs local median 4.0% in Casa Grande — top-decile yield for the area; either an underpriced asset or a hidden risk that comps aren't pricing in. Stress-test before assuming the spread holds.
Location & tenants
- Location reads 58/100 on livability (#220 in AZ) — a working-class tenant base; expect higher turnover. Strengths: cost of living A+, housing A+; Watch: crime D+, employment D+, amenities F.
- Casa Grande Union High School District (4453) (suburban): math 14% / reading 21% proficiency, ranked #193 of 249 in AZ (top 78%) — low school quality limits family demand, transient renter base, plan for 1-2y turnover.
- Zoned schools: Cottonwood Elementary School (math 8% / reading 8%, grade F, #1,056 of 1,109 statewide, top 96%, 451 students, 89% FRL); Casa Grande Middle School (math 7% / reading 12%, grade F, #197 of 218 statewide, top 91%, 645 students, 84% FRL); Casa Grande Union High School (math 18% / reading 25%, grade F, #217 of 381 statewide, top 57%, 2,132 students, 52% FRL).
- Market conditions: Rents rising fast (+4.6%/yr); 632 active listings in the ZIP; 36 comparable units currently listed for rent nearby; rentals at typical pace (median 22d on market — plan ~3-4 weeks tenant-placement turnaround); 9,504 units permitted in Pinal County in 2024 (776 in 5+ unit buildings).
- This rent runs 39% of the median local income ($68k/yr) — at the standard rent-burdened threshold; future hikes will face affordability resistance.
Forward outlook
- Local home prices are declining (-3.0%/yr); year-one equity from $2k of loan paydown is wiped out by about $7k of value loss. Plan a longer hold.
Negotiation context
- It's been on market 145 days — a 12% lower offer ($195k) is reasonable based on typical stale-listing flexibility.
Risks & watch-outs
- Climate carrying-cost: major wildfire risk; extreme-heat days projected 7→20/yr by 2055 (HVAC capex compounding) — expect insurance premiums to compound above CPI over the hold.
Questions for the listing agent
- It's been on market 145 days. Have you received any prior offers? Is the seller open to a 12% concession, seller financing, or rate buy-down credit?
- Have any recent inspections been done? Can we get a copy of the seller's disclosures and any deferred-maintenance estimates?
- Why hasn't it sold? Are there any deal-killer items the seller is aware of (foundation, flood, title, zoning, code violations)?
- Is there a deadline driving the sale (1031 exchange, divorce, estate, relocation)? That informs how much negotiation room exists.
- Schools are F-rated, which usually means shorter tenancies and higher turnover. Who's the typical renter profile here, and what's been the actual vacancy rate?
- Crime grade is D in this area — have there been break-ins, vandalism, or insurance claims at this property in the last 3 years? What carrier currently insures it and at what premium?
- The area grade is low — what's the realistic commute time and amenity access for the typical tenant pool here? Any planned neighborhood developments (good or bad) we should know about?
- What's the average days-on-market for RENTAL listings here right now (not sales)? A rising rental-DOM trend means longer vacancies and softer asking-rent achievability than the comps imply.
- What's the recent tenant-quality profile in this submarket — average credit score on applications, eviction rate, late-payment / NSF rate, and stable-employment percentage? A property-management company in the area should have these aggregated.
- How much new for-sale + rental construction is in the pipeline within 1–3 miles? Heavy new supply typically softens prices + rents 12–24 months out; constrained supply supports both.
Investment metrics
- 1% rule
- 1.01% ✓
- Cap rate
- 7.62%
- Cash-on-cash
- 4.73%
- DSCR
- 1.21
- GRM
- 8.2
CMA / ARV
- ARV (on-the-fly)
- $210,021
- Comps found
- 10
Show comp detail 10 sales within ~0.75 mi
| Address | Dist | Beds/Ba | Sqft | Sold | Price | $/sf | Match |
|---|---|---|---|---|---|---|---|
| 312 E O'neil Dr #128 | 0.11mi | 3/2.5 | 1,528 (-0%) | 14mo | $210,000 | $137 | 80 |
| 312 E O'neil Dr #148 | 0.11mi | 3/2.0 | 1,512 (-1%) | 18mo | $169,500 | $112 | 78 |
| 312 E O'neil Dr #103 | 0.09mi | 3/2.0 | 1,344 (-12%) | 1mo | $140,000 | $104 | 74 |
| 312 E O'neil Dr #129 | 0.11mi | 3/2.0 | 1,379 (-10%) | 19mo | $199,900 | $145 | 63 |
| 312 E O'neil Dr #123 | 0.47mi | 2/2.0 (-1) | 1,486 (-3%) | 12mo | $189,000 | $127 | 58 |
| 312 E O'neil Dr #159 | 0.47mi | 2/2.0 (-1) | 1,486 (-3%) | 14mo | $200,000 | $135 | 56 |
| 120 W O'neil Dr #84 | 0.32mi | 2/2.0 (-1) | 1,352 (-12%) | 7mo | $70,000 | $52 | 54 |
| 312 E O'neil Dr #157 | 0.47mi | 2/2.0 (-1) | 1,486 (-3%) | 21mo | $225,000 | $151 | 51 |
| 312 E O'neil Dr #112 | 0.47mi | 3/2.0 | 1,379 (-10%) | 14mo | $189,000 | $137 | 49 |
| 312 E O'neil Dr #73 | 0.47mi | 3/2.0 | 1,379 (-10%) | 20mo | $210,000 | $152 | 45 |
Match score weights: distance 35% · size 25% · config 20% · recency 20%. Top-matched comps best support the ARV.
Projected returns pro-forma
-3.0% appreciation · 4.6% rent growth · sell at horizon
- IRR
- -7.1%
- Equity multiple
- 0.73×
- Total profit
- $-16,636
- Equity at exit
- $33,088
- IRR
- 4.4%
- Equity multiple
- 1.34×
- Total profit
- $21,358
- Equity at exit
- $19,187
Cash invested: $62,135 (down + closing). Projections, not guarantees.
Landlord ↔ Tenant lean methodology
- Overall (STATE)
- 87 Strongly Landlord-Friendly
- State Arizona
- 87 Strongly Landlord-Friendly · R+3
- County
- — inherits STATE
- City
- — inherits STATE
ZIP-level market 85122
- Home prices YoY
- -22.4%
- Rents YoY
- 4.6%
- Active inventory
- 632
- Price-to-rent
- 8.2×
Monthly cashflow live
- Estimated rent
- $2,251 high interval (Pro) →
- Mortgage (P&I)
- −$1,164
- Tax est. 1.5%
- −$277 /mo · $3,329/yr
- Insurance
- −$92
- HOA
- −$0
- Vacancy / Maint / Mgmt
- −$473
- Net cashflow
- $245
Break-even live
Sensitivity live
| Price | -10% $398 | -5% $322 | +0% $245 | +5% $168 | +10% $92 |
|---|---|---|---|---|---|
| Rent | -10% $67 | -5% $156 | +0% $245 | +5% $334 | +10% $423 |
| Rate | -1.0pp $357 | -0.5pp $301 | base $245 | +0.5pp $188 | +1.0pp $129 |
UW: 25.0% down · 7.5% · 30yr · 1.5% tax · 5.0% vac · 8.0% maint · 8.0% mgmt
Financing live
Cash to close
- Down payment
- $55,478
- Closing costs
- $6,657
- Reserves months
- —
- Total cash needed
- —
Loan-product check · same deal, 3 products live
Conventional
25% down · 7.5% · 30yr
- Down + closing
- —
- Monthly P&I
- —
- Monthly cashflow
- —
- DSCR
- —
- Eligible?
- —
Personal DTI + credit; lowest rate.
DSCR
20% down · 8.5% · 30yr
- Down + closing
- —
- Monthly P&I
- —
- Monthly cashflow
- —
- DSCR
- —
- Eligible?
- —
No personal income docs; deal must DSCR.
Hard money
10% down · 12.0% · 12mo
- Down + closing
- —
- Monthly P&I
- —
- Monthly cashflow
- —
- DSCR
- —
- Eligible?
- —
Short-term bridge; refi at stabilization.
Rent comps 36 comps
| Address | Beds | Baths | Sqft | Rent | $/sqft | DOM | Units | Dist |
|---|---|---|---|---|---|---|---|---|
| 1640 N Cameron St Casa Grande, AZ | 3.0 | 2.0 | 1577 | $3,250 | $2.06 | 24d | 1 | 0.28mi |
| 1640 N Cameron St Casa Grande, AZ | 3.0 | 2.0 | 1577 | $3,250 | $2.06 | 26d | 1 | 0.28mi |
| 1640 N Cameron St Unit 1640 Casa Grande, AZ | 3.0 | 2.5 | 1577 | $3,250 | $2.06 | 26d | 1 | 0.28mi |
| 1642 N Cameron St Casa Grande, AZ | 3.0 | 2.5 | 1577 | $3,250 | $2.06 | 26d | 1 | 0.28mi |
| 1846 N Princeton Ave Casa Grande, AZ | 4.0 | 2.0 | 1786 | $1,750 | $0.98 | 6d | 1 | 0.32mi |
| 1858 N Center Ave Casa Grande, AZ | 2.0 | 2.0 | 1146 | $1,500 | $1.31 | 26d | 1 | 0.38mi |
| 1775 N Terrace Cir Casa Grande, AZ | 3.0 | 2.0 | 1628 | $1,699 | $1.04 | 17d | 1 | 0.46mi |
| 1926 N Avenida de Palmas Casa Grande, AZ | 2.0 | 2.0 | 1106 | $1,199 | $1.08 | 24d | 3 | 0.63mi |
| 1620 N Trekell Rd Casa Grande, AZ | 1.0–3.0 | 1.0–2.5 | 1090 | $2,640 | $2.42 | 0d | 1 | 0.65mi |
| 1153 E Gabrilla Dr Casa Grande, AZ | 4.0 | 2.0 | 1689 | $1,795 | $1.06 | 22d | 1 | 0.68mi |
| 1161 E O'Neil Dr Casa Grande, AZ | 2.0–4.0 | 2.0 | 1144 | $1,498 | $1.31 | 1d | 13 | 0.72mi |
| 1936 N Trekell Rd Casa Grande, AZ | 1.0–4.0 | 1.0–2.0 | 1033 | $1,723 | $1.67 | 1d | 31 | 0.82mi |
| 1979 N Vista Ln Casa Grande, AZ | 4.0 | 2.0 | 1636 | $2,200 | $1.34 | 26d | 1 | 0.91mi |
| 1251 E Jahns Dr Casa Grande, AZ | 4.0 | 2.0 | 1810 | $1,995 | $1.10 | 1d | 1 | 0.92mi |
| 1584 N Wood St Casa Grande, AZ | 4.0 | 2.0 | 1928 | $1,800 | $0.93 | 17d | 1 | 0.94mi |
| 1256 E Jahns Dr Casa Grande, AZ | 4.0 | 3.0 | 2094 | $2,199 | $1.05 | 7d | 1 | 0.94mi |
| 541 W Melrose Dr Casa Grande, AZ | 3.0 | 2.0 | 1101 | $1,600 | $1.45 | 26d | 1 | 0.94mi |
| 1100 N Brown Ave Casa Grande, AZ | 3.0 | 2.0 | 1609 | $1,950 | $1.21 | 1d | 1 | 0.98mi |
| 520 W Casa Mirage Ct Casa Grande, AZ | 3.0 | 2.0 | 1536 | $1,600 | $1.04 | 6d | 1 | 0.99mi |
| 645 W Jardin Dr Casa Grande, AZ | 3.0 | 2.0 | 1309 | $1,650 | $1.26 | 26d | 1 | 1.01mi |
| 2094 N Sweetwater Dr Casa Grande, AZ | 3.0 | 2.0 | 1266 | $1,700 | $1.34 | 26d | 1 | 1.09mi |
| 1265 E Kingman St Casa Grande, AZ | 4.0 | 2.0 | 1874 | $2,099 | $1.12 | 7d | 1 | 1.12mi |
| 1265 E Kingman St Casa Grande, AZ | 4.0 | 2.0 | 1874 | $2,099 | $1.12 | 1d | 1 | 1.12mi |
| 767 W Barrus Dr Casa Grande, AZ | 3.0 | 2.0 | 1463 | $1,695 | $1.16 | 26d | 1 | 1.12mi |
| 736 W Palo Verde Dr Casa Grande, AZ | 3.0 | 2.0 | 1810 | $3,550 | $1.96 | 26d | 1 | 1.17mi |
| 919 N Gilbert Ave Casa Grande, AZ | 3.0 | 2.0 | 1630 | $1,850 | $1.13 | 1d | 1 | 1.20mi |
| 1131 E Trinity Pl Casa Grande, AZ | 4.0 | 2.5 | 1600 | $1,650 | $1.03 | 26d | 1 | 1.22mi |
| 803 W Jardin Dr Casa Grande, AZ | 3.0 | 2.0 | 1491 | $1,725 | $1.16 | 6d | 1 | 1.27mi |
| 928 N Pueblo Dr Casa Grande, AZ | 3.0 | 2.0 | 1300 | $1,550 | $1.19 | 26d | 1 | 1.33mi |
| 1025 N Menze St Casa Grande, AZ | 3.0 | 1.5 | 1301 | $1,695 | $1.30 | 15d | 1 | 1.34mi |
| 776 W Fairlane Ct Casa Grande, AZ | 3.0 | 2.0 | 1489 | $3,200 | $2.15 | 26d | 1 | 1.36mi |
| 1007 N Menze St Casa Grande, AZ | 4.0 | 2.0 | 1539 | $1,580 | $1.03 | 7d | 1 | 1.38mi |
| 750 W Torino Pl Casa Grande, AZ | 3.0 | 2.0 | 2007 | $3,000 | $1.49 | 1d | 1 | 1.40mi |
| 846 N Pueblo Dr #138 Casa Grande, AZ | 3.0 | 2.0 | 1324 | $1,700 | $1.28 | 17d | 1 | 1.41mi |
| 845 W Crooked Stick Dr Casa Grande, AZ | 3.0 | 2.0 | 1601 | $2,000 | $1.25 | 26d | 1 | 1.43mi |
| 1139 E Yucca St Casa Grande, AZ | 3.0 | 3.0 | 1300 | $1,800 | $1.38 | 26d | 1 | 1.48mi |
Listing history 16 events
-
2026-06-21days on market $221,910 Active 145 DOM
-
2026-06-18days on market $221,910 Active 142 DOM
-
2026-06-17days on market $221,910 Active 141 DOM
-
2026-06-16days on market $221,910 Active 140 DOM
-
2026-06-15days on market $221,910 Active 139 DOM
-
2026-06-13days on market $221,910 Active 137 DOM
-
2026-06-13days on market $221,910 Active 136 DOM
-
2026-06-09days on market $221,910 Active 133 DOM
-
2026-06-08days on market $221,910 Active 132 DOM
-
2026-06-07days on market $221,910 Active 131 DOM
-
2026-06-04days on market $221,910 Active 128 DOM
-
2026-06-03days on market $221,910 Active 127 DOM
-
2026-06-02days on market $221,910 Active 126 DOM
-
2026-06-01days on market $221,910 Active 125 DOM
-
2026-05-31days on market $221,910 Active 124 DOM
-
2026-01-27$221,910 Active
ⓘ Source: listings_history table (triggers on properties + properties_extension) + one-shot
backfill from property_details.listing_events for pre-trigger history.
Climate risk First Street
- Flood 1/10 Low FEMA zone X (unshaded) · 0% chance over 30 yrs
- Wildfire 6/10 Major
- Heat 9/10 Extreme 7 d/yr ≥113°F today · 20 d/yr by 30 yrs out
- Wind 1/10 Low
- Air quality 2/10 Low 1 unhealthy d/yr today · 1 by 30 yrs out
Nearby sold comps map
Loading sold comps map…
Walkable amenities ~0.75 mi
Loading nearby amenities…
Taxation est. · year 1
- Rental income
- $27,017
- − Mortgage interest
- −$12,430
- − Property taxes
- −$3,329
- − Insurance
- −$1,110
- − Repairs & maintenance
- −$2,161
- − Management
- −$2,161
- − Depreciation
- −$6,456
- Taxable loss
- −$630
- Est. tax savings @ 24.0%
- +$151
- After-tax cash flow
- $3,092/yr
For passive investors: Depreciation is non-cash, so a rental often shows a tax loss while cash-flowing — sheltering income. Rental losses are passive: they offset passive income freely, and up to $25,000/yr can offset ordinary (W-2) income if you actively participate and your MAGI is under $100k (phasing out to $0 by $150k); unused losses carry forward. On sale, claimed depreciation is recaptured at up to 25%, and gains may owe capital-gains tax (a 1031 exchange can defer both). Figures are a year-1 estimate at your 24.0% rate — not tax advice; consult a CPA.
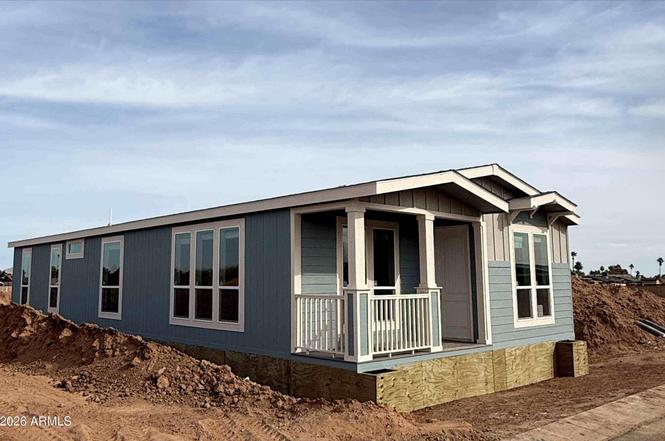
Condition & rehab AI · 2 photos
This manufactured home is in a state of disrepair with no exterior, roof, flooring, or interior walls. Extensive renovation is required to make it move-in ready and increase its value.
Repairs flagged
- Major Exterior framing — Exposed framing indicates structural damage
- Major Roof — Exposed framing indicates no roof
- Major Flooring — Exposed framing indicates no flooring
- Major Interior framing — Exposed framing indicates no walls
- Major Systems — No visible systems
Value-add opportunities
- Both Complete exterior renovation — New siding, roof, and flooring would significantly improve both resale and rental value
- Both Interior renovation — New walls, flooring, and systems would significantly improve both resale and rental value
- Both Landscaping and curb appeal — New landscaping and curb appeal would enhance both resale and rental value
Renovation cost estimate screening
| Repair item | Severity | Est. cost |
|---|---|---|
| Exterior framing · Exposed framing indicates structural damage | Major | $15,000–50,000 |
| Roof · Exposed framing indicates no roof | Major | $15,000–50,000 |
| Flooring · Exposed framing indicates no flooring | Major | $15,000–50,000 |
| Interior framing · Exposed framing indicates no walls | Major | $15,000–50,000 |
| Systems · No visible systems | Major | $15,000–50,000 |
| Total estimated repair cost · 5 items | $75,000–250,000 |
Value-add ROI direction
- Both Complete exterior renovation — New siding, roof, and flooring would significantly improve both resale and rental value ↑
- Both Interior renovation — New walls, flooring, and systems would significantly improve both resale and rental value ↑
- Both Landscaping and curb appeal — New landscaping and curb appeal would enhance both resale and rental value ↑
ⓘ Cost ranges are severity-bucket heuristics (US national rule-of-thumb). Get contractor quotes + a written scope before underwriting a rehab budget.
Schools (NCES district)
- District
- Casa Grande Union High School District (4453)
- NCES district ID
- 0401740
- Math proficiency
- 14% ▼ -15.00%
- Reading proficiency
- 21% ▼ -10.00%
- Median HH income
- $45,373
- Composite
- 15.38/100
- National rank
- #9319
- State rank
- #193 of 249 in AZ
Livability — Casa Grande
- Score
- 58/100
- State rank
- #220
- US rank
- #21534
Category grades
Schools grade is shown separately in the Schools card above.
Census & demographics
- Census place
- Casa Grande, AZ
- County
- Pinal County · 399,947 people
- City population
- 69,701
- Metro
- Phoenix-Mesa-Chandler, AZ
- Population (ZIP)
- 61,624
- Household income
- $68,443
- Rent vs Own
- Severe rent burden
- 1250.0
Population outlook (Pinal County) Hauer SSP2
- Today (2025)
- 437,574 people
- By 2030
- 446,903 · +2.1%
- By 2040
- 452,589 · +3.4%
- By 2050
- 444,126 · +1.5%
- By 2075
- 430,300 · -1.7%
- By 2100
- 393,536 · -10.1%
Race, ethnicity, and origin ACS 2023
- Neighborhood character
- Diverse neighborhood (Simpson 0.63)
- Race & ethnicity
- Hispanic / Latino 44% White 42% Two or more races 21% Black 4% Native American 4% Asian 1%
- Hispanic origin (detail)
- Mexican 40%
- Common ancestry
- Lithuanian 1% Slovak 1% Portuguese 1%
- Foreign-born
- 12% · Canada
- Languages at home
- 75% English-only · Spanish 23% Tagalog/Filipino 1% Other Indo-European 1%
Political lean MEDSL · Pinal
- 2024 margin
- Strong R (+22.1) · D 38.5% · R 60.6%
- 2008→2024 swing
- -7.6pp toward R · 2008: -14.5pp · 2024: -22.1pp
- All cycles
- 2024: R+22.1 2020: R+17.3 2016: R+19.3 2012: R+17.1 2008: R+14.5
Not yet ingested
- Civics
- —
Market trends
- HPI YoY
- ▼ -67.32%
- Current HPI
- 233.148
- Rent YoY
- ▲ 4.60%
- Metro
- Phoenix-Mesa-Chandler, AZ
- State GDP YoY
- ▲ 4.54%
- F500 in state
- 20
Industry mix (Fortune 500 HQ in AZ)
| Industry | F500 HQs | Revenue |
|---|---|---|
| Technology | 2 | $13B |
|
||
| Mining / Metals | 1 | $23B |
|
||
| Environmental Services | 1 | $16B |
|
||
| Metals / Steel | 1 | $14B |
|
||
| Technology Distribution | 1 | $9B |
|
||
| Homebuilding | 1 | $8B |
|
||
Price history
1 event — show timeline
- 2026-01-27 Listed $221,910 ARMLS
Cash-flow waterfall
monthlySold comps — $/sqft
last 12 mo · ≤1 miLoading sold comps…