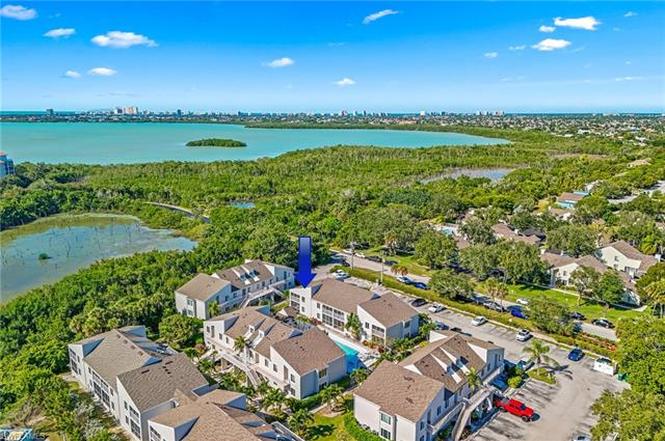
2155 San Marco Rd Unit 2-204 · Marco Island, FL
Flood risk 10/10 · Severe
- FEMA flood zone
- AE
- Chance of flooding over 30 yrs
- 0.99%
- Est. flood insurance / yr
- $1,737 – $8,500
Fire risk 3/10 · Minor
- Est. fire insurance / yr
- $947 – $1,759
Heat risk 10/10 · Severe
- Hot days now (above 107°F)
- 7 days/yr
- Hot days in 30 yrs
- 28 days/yr
Wind risk 10/10 · Severe
- Chance of severe wind over 30 yrs
- 99.0%
Air-quality risk 3/10 · Minor
- Unhealthy air days now
- 3 days/yr
- Unhealthy air days in 30 yrs
- 3 days/yr
Risk factors via First Street. Map © Google.
Why this score? — see what drove the C+ grade
The composite is a weighted blend of 9 inputs, each scored 0–100. Each bar is that input's sub-score; the figure is the points it added to the 100-point composite (weight × sub-score).
- Cash flow +23.9/30.0
- 1% rule +10.0/10.0
- DSCR +7.7/10.0
- ARV discount +7.5/15.0
- Schools +5.0/10.0
- Rent growth +4.1/5.0
- Livability +3.6/5.0
- Condition / age +2.5/5.0
- Appreciation +0.0/10.0
$249,985
🖨 Deal sheet (PDF) 📄 Offer letter ✓ Due diligence
Listing remarks
IMPACT WINDOWS – NEW ROOF – PRIME MARCO ISLAND LOCATION! Discover the perfect blend of value, comfort, and location with this 2-bedroom, 2-bath condo in the heart of Marco Island—offered for under $250K! This residence presents a rare opportunity to own a piece of paradise at an affordable price, whether you’re an investor seeking strong annual rental potential or a first-time homebuyer dreaming of island living. Step inside and find a bright and inviting interior designed for low-maintenance living. The condo features impact-resistant windows, a new roof, and a freshly updated stucco exterior, offering both peace of mind and modern curb appeal. Each bedroom provides
Key facts
- Community pool
- Private balcony
- New roof
Tags
Property features AI
Finance
- HOA & community: Mandatory HOA with professional management; Community pool; Non-gated community; Monthly condo fee of $961; Annual recurring HOA fees approximately $11,532; One-time fees approximately $300; HOA maintenance covers cable, insurance, irrigation water, lawn/land maintenance, legal/accounting, manager, exterior pest control, reserves, sewer and water
Exterior
- Parking: 1 assigned parking space
- Utilities: Central water; Central sewer; Cable available
- Home design: Residential property; Low-rise building (1-3 stories); 2-story end unit; Rear exposure faces east; Unit located in The Estuary at Marco (Estuary I), Unit 204
- Construction: Concrete block and wood frame construction; Built in 1985; Architectural-planned lot dimensions
- Exterior features: Stucco exterior; Double-hung windows; Shingle roof; Pool/club view; Central irrigation; No RV allowed
Interior
- Kitchen: Electric cooktop; Self-cleaning oven / range; Dishwasher; Disposal; Microwave; Refrigerator/freezer
- Bedrooms: 2 bedrooms
- Flooring: Carpet; Tile
- Bathrooms: 2 full bathrooms; Master bath with shower (no tub)
- Heating & cooling: Central electric heating; Central electric air conditioning; Ceiling fans
- Interior features: High-speed internet available; Smoke detectors; Dining area integrated with living room; Screened lanai/porch; Turnkey furnished; Split-bedroom floor plan
- Laundry & utility: Washer; Dryer
Neighborhood map
What this means for you Summary
Snapshot
- This is a 2-bed/2.0-bath condo listed at $250k.
Deal economics
- At list price, monthly cash flow is $57 ($688/yr) — positive.
- The deal already cash-flows at list — no discount required.
- Meets the 1% rule at list price ($4k rent vs $250k).
Location & tenants
- Location reads 71/100 on livability (#404 in FL) — a middle-class / working-renter tenant base. Strengths: crime A+, employment A+, health & safety A+; Watch: amenities F, commute F, cost of living F.
- Collier (suburban): math 60% / reading 56% proficiency, ranked #16 of 73 in FL (top 22%) — acceptable for families but not a draw, mixed tenant base, ~2y average lease.
- Zoned schools: Tommie Barfield Elementary School (math 84% / reading 75%, grade A, #116 of 2,144 statewide, top 6%, 464 students, 30% FRL); Manatee Middle School (math 61% / reading 43%, grade C+, #217 of 571 statewide, top 40%, 749 students, 64% FRL); Lely High School (math 40% / reading 39%, grade F, #304 of 667 statewide, top 47%, 1,504 students, 54% FRL).
- Market conditions: Rents rising fast (+6.6%/yr); 689 active listings in the ZIP; 1 comparable units currently listed for rent nearby; solid renter incomes; 3,520 units permitted in Collier County in 2024 (959 in 5+ unit buildings).
- At $3,851/mo this rent would consume 46% of the median local household income ($102k/yr) (locally 314% of renters already pay >50% of income on rent) — very limited rent-growth headroom before tenants either downsize or default.
Forward outlook
- Local home prices are declining (-3.0%/yr); year-one equity from $2k of loan paydown is wiped out by about $8k of value loss. Plan a longer hold.
- Collier County population projected at +30% by 2050 — long-run rental-demand tailwind backs the buy-and-hold thesis.
- At projected returns (-3.0% appreciation + 6.6% rent growth), your $70k cash investment doubles in ~10 years — after that, you're playing with house money.
Negotiation context
- Only 5 days on market — expect competitive offers; lowballing is unlikely to land.
- 8 sale attempts since 7y ago with the ask held roughly flat each time — persistent listings suggest the price (not the market) is what's stuck; bring a comps-based counter.
- Current owner paid $155k; list at $250k implies a 61% gain — meaningful room to come down on a strong offer.
Risks & watch-outs
- Watch-outs: flood insurance adds $427/mo; HOA is 25% of rent.
- Climate carrying-cost: in FEMA flood zone AE (mandatory federal flood insurance); severe wind risk, 99% chance of damaging wind over 30y; extreme-heat days projected 7→28/yr by 2055 (HVAC capex compounding) — expect insurance premiums to compound above CPI over the hold.
Questions for the listing agent
- What's the actual annual flood-insurance premium (NFIP or private), and is the property in a SFHA with mandatory coverage?
- What does the HOA fee cover, when was the last increase, and are there any pending special assessments or reserve-fund shortfalls?
- Any open or pending special assessments — roof, HVAC, plumbing, elevator, façade? What's the per-unit balance and payoff schedule, and is the seller paying it off at close or rolling it to the buyer?
- Is there a deadline driving the sale (1031 exchange, divorce, estate, relocation)? That informs how much negotiation room exists.
- Schools are A-rated — typically a magnet for longer-tenancy family renters. What's the average tenant stay here, and is there a school-zone premium baked into asking?
- What's the average days-on-market for RENTAL listings here right now (not sales)? A rising rental-DOM trend means longer vacancies and softer asking-rent achievability than the comps imply.
- What's the recent tenant-quality profile in this submarket — average credit score on applications, eviction rate, late-payment / NSF rate, and stable-employment percentage? A property-management company in the area should have these aggregated.
- How much new apartment / multifamily construction is in the pipeline within 1–3 miles? Heavy new supply (>2% of stock underway) typically softens rents 12–24 months out; light construction supports rent growth.
Investment metrics
- 1% rule
- 1.54% ✓
- Cap rate
- 8.62%
- Cash-on-cash
- 8.30%
- DSCR
- 1.37
- GRM
- 5.4
CMA / ARV
No comps found within radius.
Projected returns pro-forma
-3.0% appreciation · 6.59% rent growth · sell at horizon
- IRR
- -7.9%
- Equity multiple
- 0.69×
- Total profit
- $-21,615
- Equity at exit
- $37,274
- IRR
- 7.9%
- Equity multiple
- 1.76×
- Total profit
- $52,925
- Equity at exit
- $21,614
Cash invested: $69,996 (down + closing). Projections, not guarantees.
Landlord ↔ Tenant lean methodology
- Overall (STATE)
- 87 Strongly Landlord-Friendly
- State Florida
- 87 Strongly Landlord-Friendly · R+3
- County
- — inherits STATE
- City
- — inherits STATE
ZIP-level market 34145
- Rents YoY
- 6.6%
- Active inventory
- 689
- Price-to-rent
- 5.4×
Monthly cashflow live
- Estimated rent
- $3,851 medium interval (Pro) →
- Mortgage (P&I)
- −$1,311
- Tax from tax record
- −$163 /mo · $1,957/yr
- Insurance
- −$104
- Flood insurance flood zone
- −$427 /mo · $5,118/yr
- HOA
- −$980
- Vacancy / Maint / Mgmt
- −$809
- Net cashflow
- $57
Break-even live
Sensitivity live
| Price | -10% $199 | -5% $128 | +0% $57 | +5% $-13 | +10% $-84 |
|---|---|---|---|---|---|
| Rent | -10% $-247 | -5% $-95 | +0% $57 | +5% $209 | +10% $362 |
| Rate | -1.0pp $183 | -0.5pp $121 | base $57 | +0.5pp $-7 | +1.0pp $-73 |
UW: 25.0% down · 7.5% · 30yr · 1.5% tax · 5.0% vac · 8.0% maint · 8.0% mgmt
Financing live
Cash to close
- Down payment
- $62,496
- Closing costs
- $7,500
- Reserves months
- —
- Total cash needed
- —
Loan-product check · same deal, 3 products live
Conventional
25% down · 7.5% · 30yr
- Down + closing
- —
- Monthly P&I
- —
- Monthly cashflow
- —
- DSCR
- —
- Eligible?
- —
Personal DTI + credit; lowest rate.
DSCR
20% down · 8.5% · 30yr
- Down + closing
- —
- Monthly P&I
- —
- Monthly cashflow
- —
- DSCR
- —
- Eligible?
- —
No personal income docs; deal must DSCR.
Hard money
10% down · 12.0% · 12mo
- Down + closing
- —
- Monthly P&I
- —
- Monthly cashflow
- —
- DSCR
- —
- Eligible?
- —
Short-term bridge; refi at stabilization.
Rent comps 1 comps
| Address | Beds | Baths | Sqft | Rent | $/sqft | DOM | Units | Dist |
|---|---|---|---|---|---|---|---|---|
| 2235 San Marco Rd Unit 5-204 Marco Island, FL | 2.0 | 2.0 | 948 | $2,100 | $2.22 | 15d | 1 | 0.02mi |
HOA detail condo
- Monthly dues
- $980 · $11,760/yr
- Assessments
- None detected in remarks — confirm with the listing agent.
Listing history 30 events
-
2026-06-21days on market $249,985 Active 5 DOM
-
2026-06-18days on market $249,985 Active 2 DOM
-
2026-06-16pricedays on market $249,985 Active 1 DOM
-
2026-05-30days on market $249,895 Active 205 DOM
-
2026-01-07price $249,895
-
2025-11-06$249,995 Active
-
2025-07-25historical
-
2025-05-10price $245,000
-
2025-05-10price $245,000
-
2025-03-05$267,000 Active
-
2025-03-05$267,000 Active
-
2025-02-28historical
-
2025-01-08$299,000 Active
-
2025-01-08$299,000 Active
-
2024-12-31historical
-
2024-08-30price $310,000
-
2024-08-30price $310,000
-
2024-06-24price $329,000
-
2024-06-24price $329,000
-
2024-06-21$319,900 Active
-
2024-06-21$319,900 Active
-
2020-02-27soldstatus $155,000
-
2020-02-14soldstatus $155,000 Sold
-
2020-01-09status Pending
-
2019-08-01price $164,900
-
2019-03-12$175,000 Active
-
2016-08-05soldstatus $160,000
-
2014-11-10soldstatus $105,000
-
2000-07-19soldstatus $82,500
-
1992-04-01soldstatus $70,500
ⓘ Source: listings_history table (triggers on properties + properties_extension) + one-shot
backfill from property_details.listing_events for pre-trigger history.
Tax reassessment forecast FL · Resets to sale price
- Current annual tax
- $1,957 · $163/mo
- Projected year-2 tax
- $2,075 · $173/mo
- Expected delta
- +$118/yr (+$10/mo · 6.0%)
ⓘ Screening estimate from a state-policy table — verify with the county assessor before closing.
Climate risk First Street
- Flood 10/10 Extreme FEMA zone AE · 99% chance over 30 yrs
- Wildfire 3/10 Moderate
- Heat 10/10 Extreme 7 d/yr ≥107°F today · 28 d/yr by 30 yrs out
- Wind 10/10 Extreme 99% chance of damaging wind over 30 yrs
- Air quality 3/10 Moderate 3 unhealthy d/yr today · 3 by 30 yrs out
Nearby sold comps map
Loading sold comps map…
Walkable amenities ~0.75 mi
Loading nearby amenities…
Taxation est. · year 1
- Rental income
- $46,208
- − Mortgage interest
- −$14,003
- − Property taxes
- −$1,957
- − Insurance
- −$6,368
- − Repairs & maintenance
- −$3,697
- − Management
- −$3,697
- − HOA
- −$11,760
- − Depreciation
- −$7,272
- Taxable loss
- −$2,545
- Est. tax savings @ 24.0%
- +$611
- After-tax cash flow
- $1,299/yr
For passive investors: Depreciation is non-cash, so a rental often shows a tax loss while cash-flowing — sheltering income. Rental losses are passive: they offset passive income freely, and up to $25,000/yr can offset ordinary (W-2) income if you actively participate and your MAGI is under $100k (phasing out to $0 by $150k); unused losses carry forward. On sale, claimed depreciation is recaptured at up to 25%, and gains may owe capital-gains tax (a 1031 exchange can defer both). Figures are a year-1 estimate at your 24.0% rate — not tax advice; consult a CPA.
Schools (NCES district)
- District
- Collier
- NCES district ID
- 1200330
- Math proficiency
- 60% ▼ -4.00%
- Reading proficiency
- 56% ▼ -2.00%
- Median HH income
- $58,275
- Composite
- 50.23/100
- National rank
- #1892
- State rank
- #16 of 73 in FL
Livability — Marco Island
- Score
- 71/100
- State rank
- #404
- US rank
- #7149
Category grades
Schools grade is shown separately in the Schools card above.
Census & demographics
- Census place
- Marco Island, FL
- County
- Collier County · 396,295 people
- City population
- 16,205
- Metro
- Naples-Marco Island, FL
- Population (ZIP)
- 16,205
- Household income
- $101,523
- Rent vs Own
- Severe rent burden
- 314.0
Population outlook (Collier County) Hauer SSP2
- Today (2025)
- 420,858 people
- By 2030
- 450,054 · +6.9%
- By 2040
- 502,232 · +19.3%
- By 2050
- 544,932 · +29.5%
- By 2075
- 627,203 · +49.0%
- By 2100
- 659,015 · +56.6%
Race, ethnicity, and origin ACS 2023
- Neighborhood character
- Predominantly White (90%)
- Race & ethnicity
- White 90% Hispanic / Latino 7% Two or more races 6%
- Hispanic origin (detail)
- Mexican 1% Puerto Rican 1% Cuban 2%
- Common ancestry
- Romanian 5% Lithuanian 2% Slovak 2%
- Foreign-born
- 9% · Canada
- Languages at home
- 90% English-only · Spanish 5% Other Indo-European 1% German/W. Germanic 1%
Political lean MEDSL · Collier
- 2024 margin
- Solid R (+33.1) · D 33.1% · R 66.2%
- 2008→2024 swing
- -10.6pp toward R · 2008: -22.5pp · 2024: -33.1pp
- All cycles
- 2024: R+33.1 2020: R+24.7 2016: R+26.0 2012: R+30.1 2008: R+22.5
Not yet ingested
- Civics
- —
Market trends
- HPI YoY
- ▼ -374.55%
- Current HPI
- 284.7538
- Rent YoY
- ▲ 6.59%
- Metro
- Naples-Marco Island, FL
- State GDP YoY
- ▲ 3.28%
- F500 in state
- 36
Industry mix (Fortune 500 HQ in FL)
| Industry | F500 HQs | Revenue |
|---|---|---|
| Industrial Technology | 2 | $29B |
|
||
| Insurance | 2 | $17B |
|
||
| Retail | 1 | $60B |
|
||
| Technology Distribution | 1 | $58B |
|
||
| Homebuilding | 1 | $35B |
|
||
| Technology Manufacturing | 1 | $35B |
|
||
Price history
+254.5% since first listed26 events — show timeline
- 2026-01-07 Price Changed $249,895 NAPLESMLS
- 2025-11-06 Listed $249,995 NAPLESMLS
- 2025-07-25 Listing Removed — NAPLESMLS
- 2025-05-10 Price Changed $245,000 NAPLESMLS
- 2025-05-10 Price Changed $245,000 MIML
- 2025-03-05 Listed $267,000 NAPLESMLS
- 2025-03-05 Listed $267,000 MIML
- 2025-02-28 Listing Removed — NAPLESMLS
- 2025-01-08 Listed $299,000 MIML
- 2025-01-08 Listed $299,000 NAPLESMLS
- 2024-12-31 Listing Removed — NAPLESMLS
- 2024-08-30 Price Changed $310,000 NAPLESMLS
- 2024-08-30 Price Changed $310,000 MIML
- 2024-06-24 Price Changed $329,000 NAPLESMLS
- 2024-06-24 Price Changed $329,000 MIML
- 2024-06-21 Listed $319,900 NAPLESMLS
- 2024-06-21 Listed $319,900 MIML
- 2020-02-27 Sold (Public Records) $155,000 Public Records
- 2020-02-14 Sold (MLS) $155,000 NAPLESMLS
- 2020-01-09 Pending — NAPLESMLS
- 2019-08-01 Price Changed $164,900 NAPLESMLS
- 2019-03-12 Listed $175,000 NAPLESMLS
- 2016-08-05 Sold (Public Records) $160,000 Public Records
- 2014-11-10 Sold (Public Records) $105,000 Public Records
- 2000-07-19 Sold (Public Records) $82,500 Public Records
- 1992-04-01 Sold (Public Records) $70,500 Public Records
Property tax history
+7.9%/yrLatest (2025): $1,957 · +4.1% YoY. Source: county tax records.
Cash-flow waterfall
monthlySold comps — $/sqft
last 12 mo · ≤1 miLoading sold comps…