1512 Dutchtown Rd · Newark Valley, NY
Flood risk 1/10 · Minimal
- FEMA flood zone
- X (unshaded)
- Chance of flooding over 30 yrs
- 0.0%
- Est. flood insurance / yr
- $507 – $1,088
Fire risk 1/10 · Minimal
- Est. fire insurance / yr
- $691 – $1,283
Heat risk 1/10 · Minimal
- Hot days now (above 92°F)
- 6 days/yr
- Hot days in 30 yrs
- 13 days/yr
Wind risk 2/10 · Minimal
- Chance of severe wind over 30 yrs
- 1.0%
Air-quality risk 2/10 · Minimal
- Unhealthy air days now
- 0 days/yr
- Unhealthy air days in 30 yrs
- 1 days/yr
Risk factors via First Street. Map © Google.
Why this score? — see what drove the D- grade
The composite is a weighted blend of 9 inputs, each scored 0–100. Each bar is that input's sub-score; the figure is the points it added to the 100-point composite (weight × sub-score).
- Cash flow +11.1/30.0
- ARV discount +7.5/15.0
- Rent growth +4.3/5.0
- Schools +3.8/10.0
- 1% rule +3.5/10.0
- Livability +3.5/5.0
- DSCR +3.2/10.0
- Condition / age +2.5/5.0
- Appreciation +0.0/10.0
$185,000
🖨 Deal sheet (PDF) 📄 Offer letter ✓ Due diligence
Listing remarks
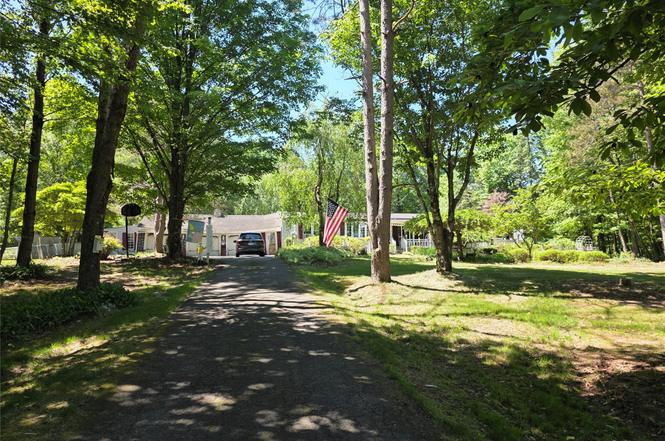
Ready for country living on 3.01 acres with an inground 16 X32 pool (21st Century Pools). An expansive fenced in backyard, just fantastic for all the entertaining you will want to do. Surrounded in the beauty of nature this deeded double wide is being sold "AS IS', as Decks and garage are in need of repair. Deeded Double offers you one level living, 3 bdrms and 2 full baths, double sinks, walk in closet in primary bdrm and full bath. Well cared for with Quaint decor is reminiscing of Victorian charm. Faux fireplace in living room, sliders and dining room to back yard. Maytag electric stove, built in dishwasher, microwave, refrigerator, washer & dryer all stay. Charming front porc
Key facts
- Fenced in backyard
- Inground pool
- Screened in room
Tags
Property features AI
Exterior
- Parking: Attached garage
- Utilities: Well water; Septic tank; Cable available
- Home design: Manufactured home (double wide); Residential property
- Construction: Vinyl siding; Pillar/post/pier foundation
- Exterior features: Garden; Level and wooded lot; Deck; Covered screened porch; Storm door(s); Fenced yard; Shed(s)
Interior
- Kitchen: Range; Free-standing range; Dishwasher; Microwave; Refrigerator; Electric water heater
- Flooring: Carpet; Vinyl
- Bathrooms: 2 full bathrooms
- Heating & cooling: Propane heating; Ceiling fan(s)
- Interior features: Walk-in closet(s); Storm and insulated windows; Other interior features (see remarks)
- Laundry & utility: Washer included; Electric dryer hookup
Neighborhood map
What this means for you Summary
Snapshot
- This is a 3-bed/2.0-bath single-family listed at $185k.
Deal economics
- At list price, monthly cash flow is $-73 ($-874/yr) — negative.
- To cash-flow at today's rent, offer at most $172k (7.0% below list).
- To meet the 1% rule (rent ≥ 1% of price), the offer needs to be $157k (15.1% below list).
- Recommended offer: $157k (15.1% below list) — sets the bar for 1% rule.
Location & tenants
- Location reads 70/100 on livability (#462 in NY) — a middle-class / working-renter tenant base. Strengths: cost of living A+, housing A+, employment B; Watch: health & safety D, crime F, amenities F.
- Newark Valley Central School District (rural): math 37% / reading 51% proficiency, ranked #466 of 590 in NY (top 79%) — families likely to look elsewhere, expect single-tenant / working-renter base with shorter leases.
- Zoned schools: Nathan T Hall School (math 37% / reading 47%, grade F, #1,361 of 2,108 statewide, top 67%, 322 students, 50% FRL); Newark Valley Middle School (math 23% / reading 41%, grade F, #511 of 729 statewide, top 71%, 290 students, 59% FRL); Newark Valley Senior High School (math 57% / reading 72%, grade B-, #776 of 1,100 statewide, top 73%, 414 students, 47% FRL).
- Market conditions: Rents rising fast (+7.1%/yr); 217 active listings in the ZIP; 139 units permitted in Tioga County in 2024 (65 in 5+ unit buildings).
Forward outlook
- Local home prices are declining (-3.0%/yr); year-one equity from $1k of loan paydown is wiped out by about $6k of value loss. Plan a longer hold.
- Tioga County population projected at -27% by 2050 — secular population decline; favor cash flow + early exit over multi-decade hold.
Negotiation context
- Only 10 days on market — expect competitive offers; lowballing is unlikely to land.
Questions for the listing agent
- What do current leases actually rent for vs. the listed asking? Can we see a recent rent roll and the last 12 months of T-12 income?
- Is there a deadline driving the sale (1031 exchange, divorce, estate, relocation)? That informs how much negotiation room exists.
- Crime grade is F in this area — have there been break-ins, vandalism, or insurance claims at this property in the last 3 years? What carrier currently insures it and at what premium?
- The area grade is low — what's the realistic commute time and amenity access for the typical tenant pool here? Any planned neighborhood developments (good or bad) we should know about?
- What's the average days-on-market for RENTAL listings here right now (not sales)? A rising rental-DOM trend means longer vacancies and softer asking-rent achievability than the comps imply.
- What's the recent tenant-quality profile in this submarket — average credit score on applications, eviction rate, late-payment / NSF rate, and stable-employment percentage? A property-management company in the area should have these aggregated.
- How much new for-sale + rental construction is in the pipeline within 1–3 miles? Heavy new supply typically softens prices + rents 12–24 months out; constrained supply supports both.
Investment metrics
- 1% rule
- 0.85% ✗
- Cap rate
- 5.82%
- Cash-on-cash
- -1.69%
- DSCR
- 0.92
- GRM
- 9.8
CMA / ARV
No comps found within radius.
Projected returns pro-forma
-3.0% appreciation · 7.09% rent growth · sell at horizon
- IRR
- -14.5%
- Equity multiple
- 0.46×
- Total profit
- $-27,847
- Equity at exit
- $27,584
- IRR
- -0.0%
- Equity multiple
- 1.00×
- Total profit
- $-7
- Equity at exit
- $15,995
Cash invested: $51,800 (down + closing). Projections, not guarantees.
Landlord ↔ Tenant lean methodology
- Overall (STATE)
- 15 Strongly Tenant-Friendly
- State New York
- 15 Strongly Tenant-Friendly · D+10
- County
- — inherits STATE
- City
- — inherits STATE
ZIP-level market 13760
- Home prices YoY
- -32.7%
- Rents YoY
- 7.1%
- Active inventory
- 217
- Price-to-rent
- 9.8×
Monthly cashflow live
- Estimated rent
- $1,570 medium interval (Pro) →
- Mortgage (P&I)
- −$970
- Tax from tax record
- −$266 /mo · $3,191/yr
- Insurance
- −$77
- HOA
- −$0
- Vacancy / Maint / Mgmt
- −$330
- Net cashflow
- $-73
Break-even live
Sensitivity live
| Price | -10% $32 | -5% $-20 | +0% $-73 | +5% $-125 | +10% $-178 |
|---|---|---|---|---|---|
| Rent | -10% $-197 | -5% $-135 | +0% $-73 | +5% $-11 | +10% $51 |
| Rate | -1.0pp $20 | -0.5pp $-26 | base $-73 | +0.5pp $-121 | +1.0pp $-170 |
UW: 25.0% down · 7.5% · 30yr · 1.5% tax · 5.0% vac · 8.0% maint · 8.0% mgmt
Financing live
Cash to close
- Down payment
- $46,250
- Closing costs
- $5,550
- Reserves months
- —
- Total cash needed
- —
Loan-product check · same deal, 3 products live
Conventional
25% down · 7.5% · 30yr
- Down + closing
- —
- Monthly P&I
- —
- Monthly cashflow
- —
- DSCR
- —
- Eligible?
- —
Personal DTI + credit; lowest rate.
DSCR
20% down · 8.5% · 30yr
- Down + closing
- —
- Monthly P&I
- —
- Monthly cashflow
- —
- DSCR
- —
- Eligible?
- —
No personal income docs; deal must DSCR.
Hard money
10% down · 12.0% · 12mo
- Down + closing
- —
- Monthly P&I
- —
- Monthly cashflow
- —
- DSCR
- —
- Eligible?
- —
Short-term bridge; refi at stabilization.
Listing history 9 events
-
2026-06-22days on market $185,000 Active 10 DOM
-
2026-06-19pricedays on market $185,000 Active 8 DOM
-
2026-06-18days on market $225,000 Active 7 DOM
-
2026-06-17days on market $225,000 Active 6 DOM
-
2026-06-16days on market $225,000 Active 5 DOM
-
2026-06-15days on market $225,000 Active 4 DOM
-
2026-06-14days on market $225,000 Active 2 DOM
-
2026-06-13remarks 690-char remark
-
2026-06-13$225,000 Active 1 DOM
ⓘ Source: listings_history table (triggers on properties + properties_extension) + one-shot
backfill from property_details.listing_events for pre-trigger history.
Tax reassessment forecast NY · Partial reset (capped growth)
- Current annual tax
- $3,191 · $266/mo
- Projected year-2 tax
- $3,191 · $266/mo
- Expected delta
- $0/yr ($0/mo · 0.0%)
ⓘ Screening estimate from a state-policy table — verify with the county assessor before closing.
Climate risk First Street
- Flood 1/10 Low FEMA zone X (unshaded) · 0% chance over 30 yrs
- Wildfire 1/10 Low
- Heat 1/10 Low 6 d/yr ≥92°F today · 13 d/yr by 30 yrs out
- Wind 2/10 Low 100% chance of damaging wind over 30 yrs
- Air quality 2/10 Low 0 unhealthy d/yr today · 1 by 30 yrs out
Nearby sold comps map
Loading sold comps map…
Walkable amenities ~0.75 mi
Loading nearby amenities…
Taxation est. · year 1
- Rental income
- $18,840
- − Mortgage interest
- −$10,363
- − Property taxes
- −$3,191
- − Insurance
- −$925
- − Repairs & maintenance
- −$1,507
- − Management
- −$1,507
- − Depreciation
- −$5,382
- Taxable loss
- −$4,035
- Est. tax savings @ 24.0%
- +$968
- After-tax cash flow
- $94/yr
For passive investors: Depreciation is non-cash, so a rental often shows a tax loss while cash-flowing — sheltering income. Rental losses are passive: they offset passive income freely, and up to $25,000/yr can offset ordinary (W-2) income if you actively participate and your MAGI is under $100k (phasing out to $0 by $150k); unused losses carry forward. On sale, claimed depreciation is recaptured at up to 25%, and gains may owe capital-gains tax (a 1031 exchange can defer both). Figures are a year-1 estimate at your 24.0% rate — not tax advice; consult a CPA.
Schools (NCES district)
- District
- Newark Valley Central School District
- NCES district ID
- 3620670
- Math proficiency
- 37% ▼ -10.00%
- Reading proficiency
- 51% ▲ 9.00%
- Median HH income
- $53,770
- Composite
- 38.12/100
- National rank
- #4273
- State rank
- #466 of 590 in NY
Livability — Newark Valley
- Score
- 70/100
- State rank
- #462
- US rank
- #8031
Category grades
Schools grade is shown separately in the Schools card above.
Census & demographics
- County
- Broome County · 126,805 people
- Metro
- Binghamton, NY
- Population (ZIP)
- 42,896
- Household income
- $66,095
- Rent vs Own
- Severe rent burden
- 1480.0
Population outlook (Tioga County) Hauer SSP2
- Today (2025)
- 45,155 people
- By 2030
- 42,801 · -5.2%
- By 2040
- 37,960 · -15.9%
- By 2050
- 33,071 · -26.8%
- By 2075
- 24,144 · -46.5%
- By 2100
- 16,545 · -63.4%
Race, ethnicity, and origin ACS 2023
- Neighborhood character
- Predominantly White (84%)
- Race & ethnicity
- White 84% Two or more races 7% Hispanic / Latino 6% Black 4% Asian 2%
- Hispanic origin (detail)
- Puerto Rican 2%
- Common ancestry
- Romanian 6% Lithuanian 2% Slovak 2%
- Foreign-born
- 5% · Canada, China
- Languages at home
- 94% English-only · Spanish 2% Other Indo-European 1% Russian/Polish/Slavic 1%
Political lean MEDSL · Tioga
- 2024 margin
- Strong R (+22.9) · D 38.6% · R 61.4%
- 2008→2024 swing
- -12.7pp toward R · 2008: -10.2pp · 2024: -22.9pp
- All cycles
- 2024: R+22.9 2020: R+20.6 2016: R+27.6 2012: R+15.1 2008: R+10.2
Not yet ingested
- Civics
- —
Market trends
- HPI YoY
- ▼ -131.29%
- Current HPI
- 270.2661
- Rent YoY
- ▲ 7.09%
- Metro
- Binghamton, NY
- State GDP YoY
- ▲ 2.60%
- F500 in state
- 92
Industry mix (Fortune 500 HQ in NY)
| Industry | F500 HQs | Revenue |
|---|---|---|
| Financial Services | 10 | $950B |
|
||
| Consumer Goods | 9 | $162B |
|
||
| Insurance | 4 | $225B |
|
||
| Telecommunications | 2 | $144B |
|
||
| Pharmaceuticals | 2 | $112B |
|
||
| Media / Entertainment | 2 | $69B |
|
||
Price history
1 event — show timeline
- 2026-06-11 Listed $225,000 GBAOR
Property tax history
+1.9%/yrLatest (2025): $3,191 · -2.2% YoY. Source: county tax records.
Cash-flow waterfall
monthlySold comps — $/sqft
last 12 mo · ≤1 miLoading sold comps…