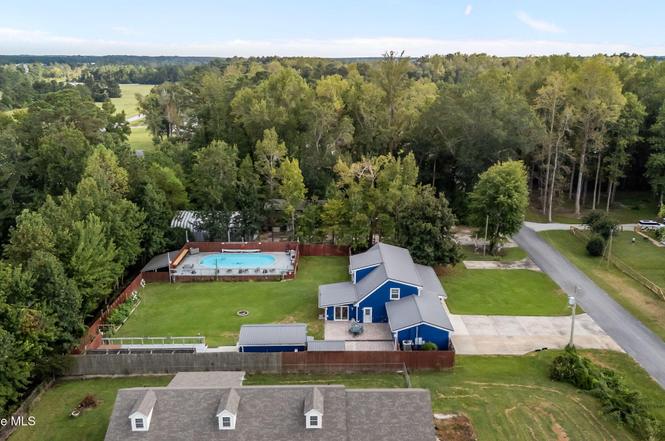
218 Old Ironsides Rd · Beaufort, NC
Flood risk 8/10 · Major
- FEMA flood zone
- AE
- Chance of flooding over 30 yrs
- 0.97%
- Est. flood insurance / yr
- $1,737 – $8,500
Fire risk 4/10 · Minor
- Est. fire insurance / yr
- $906 – $1,684
Heat risk 9/10 · Severe
- Hot days now (above 103°F)
- 7 days/yr
- Hot days in 30 yrs
- 22 days/yr
Wind risk 9/10 · Severe
- Chance of severe wind over 30 yrs
- 99.0%
Air-quality risk 1/10 · Minimal
- Unhealthy air days now
- 0 days/yr
- Unhealthy air days in 30 yrs
- 0 days/yr
Risk factors via First Street. Map © Google.
Why this score? — see what drove the B grade
The composite is a weighted blend of 9 inputs, each scored 0–100. Each bar is that input's sub-score; the figure is the points it added to the 100-point composite (weight × sub-score).
- Cash flow +30.0/30.0
- 1% rule +10.0/10.0
- DSCR +10.0/10.0
- ARV discount +7.5/15.0
- Schools +5.1/10.0
- Livability +3.2/5.0
- Rent growth +2.5/5.0
- Condition / age +2.5/5.0
- Appreciation +0.0/10.0
$639,000
🖨 Deal sheet (PDF) 📄 Offer letter ✓ Due diligence
Listing remarks MLS
Great community with Full Marina and easy access to local beaches and Cherry Point. Property sold as-is. This is a Fannie Mae Homepath property. Purchase this property for as little as 3% down! This property is approved for HomePath Mortgage Financing. This property is approved for HomePath Renovation Mortgage Financing. www.homepath.com
Key facts
- Outdoor pool
- Raised garden area
- Hot tub
Tags
Property features AI
Finance
- HOA & community: Homeowners association with annual fee of $650; Community pool; Street lights; Association amenities include basketball court, boat dock, playground, and RV/boat storage
Exterior
- Parking: Attached garage with 4 spaces; Total of 4 parking spaces; On-site paved parking; Off-street parking; Unpaved parking area
- Utilities: Public water; Water connected; Septic tank sewer
- Home design: Single family residence; Two levels; Frame construction
- Construction: Metal roof; Block foundation; Built with frame construction
- Exterior features: Outdoor shower; Deck; Enclosed deck/porch area; Patio; Porch; Privacy fencing in backyard; Above-ground pool; Pool house; Outdoor kitchen; Workshop; Second garage; Irrigation system; Has view
Interior
- Kitchen: Electric cooktop; Dishwasher; Microwave
- Flooring: Tile
- Bathrooms: 2 full bathrooms
- Heating & cooling: Heat pump heating; Electric heating; Heat pump cooling
- Interior features: Ceiling fans; Wet bar; Window coverings
- Laundry & utility: Washer hookup; Electric water heater
Neighborhood map
What this means for you Summary
Snapshot
- This is a 4-bed/2.0-bath other listed at $639k.
Deal economics
- At list price, monthly cash flow is $7k ($90k/yr) — positive.
- The deal already cash-flows at list — no discount required.
- Meets the 1% rule at list price ($15k rent vs $639k).
- Recommended offer: $562k (12.0% below list) — sets the bar for market timing.
- Cap rate 21.1% vs local median 0.6% in Beaufort — top-decile yield for the area; either an underpriced asset or a hidden risk that comps aren't pricing in. Stress-test before assuming the spread holds.
Location & tenants
- Location reads 63/100 on livability (#397 in NC) — a middle-class / working-renter tenant base. Strengths: cost of living A+, health & safety A+; Watch: housing C-, amenities F, commute F.
- Carteret County Public Schools (rural): math 59% / reading 61% proficiency, ranked #31 of 178 in NC (top 17%) — acceptable for families but not a draw, mixed tenant base, ~2y average lease.
- Zoned schools: Beaufort Elementary (math 57% / reading 56%, grade C+, #280 of 1,410 statewide, top 20%, 378 students, 99% FRL); Beaufort Middle (math 42% / reading 55%, grade C-, #127 of 475 statewide, top 28%, 258 students, 99% FRL); East Carteret High (math 82% / reading 62%, grade B+, #107 of 535 statewide, top 21%, 530 students, 45% FRL) — zoned schools average 81% FRL vs 39% district-wide (42 pts higher); higher-poverty schools than district average — tighter screening recommended.
- Market conditions: 216 active listings in the ZIP; 935 units permitted in Carteret County in 2024 (360 in 5+ unit buildings).
Forward outlook
- Local home prices are declining (-3.0%/yr); year-one equity from $4k of loan paydown is wiped out by about $19k of value loss. Plan a longer hold.
- Carteret County population projected at +9% by 2050 — modest demand growth; plan on rents tracking national, not racing it.
- At projected returns (-3.0% appreciation + 3.0% rent growth), your $179k cash investment doubles in ~3 years — after that, you're playing with house money.
Negotiation context
- It's been on market 237 days — a 12% lower offer ($562k) is reasonable based on typical stale-listing flexibility.
- 3 sale attempts since 13y ago; this cycle's ask has dropped $60k (9%) from the opening price — seller is motivated, your offer sets the floor, not the list.
- Current owner paid $117k; list at $639k implies a 446% gain — meaningful room to come down on a strong offer.
Risks & watch-outs
- Watch-outs: flood insurance adds $427/mo.
- Climate carrying-cost: in FEMA flood zone AE (mandatory federal flood insurance); severe wind risk, 99% chance of damaging wind over 30y; extreme-heat days projected 7→22/yr by 2055 (HVAC capex compounding) — expect insurance premiums to compound above CPI over the hold.
Questions for the listing agent
- It's been on market 237 days. Have you received any prior offers? Is the seller open to a 12% concession, seller financing, or rate buy-down credit?
- What's the actual annual flood-insurance premium (NFIP or private), and is the property in a SFHA with mandatory coverage?
- What does the HOA fee cover, when was the last increase, and are there any pending special assessments or reserve-fund shortfalls?
- Why hasn't it sold? Are there any deal-killer items the seller is aware of (foundation, flood, title, zoning, code violations)?
- Is there a deadline driving the sale (1031 exchange, divorce, estate, relocation)? That informs how much negotiation room exists.
- What's the average days-on-market for RENTAL listings here right now (not sales)? A rising rental-DOM trend means longer vacancies and softer asking-rent achievability than the comps imply.
- What's the recent tenant-quality profile in this submarket — average credit score on applications, eviction rate, late-payment / NSF rate, and stable-employment percentage? A property-management company in the area should have these aggregated.
- How much new for-sale + rental construction is in the pipeline within 1–3 miles? Heavy new supply typically softens prices + rents 12–24 months out; constrained supply supports both.
Investment metrics
- 1% rule
- 2.33% ✓
- Cap rate
- 21.11%
- Cash-on-cash
- 52.91%
- DSCR
- 3.35
- GRM
- 3.6
CMA / ARV
No comps found within radius.
Projected returns pro-forma
-3.0% appreciation · 3.0% rent growth · sell at horizon
- IRR
- 47.8%
- Equity multiple
- 3.08×
- Total profit
- $371,891
- Equity at exit
- $95,277
- IRR
- 53.4%
- Equity multiple
- 6.23×
- Total profit
- $936,441
- Equity at exit
- $55,249
Cash invested: $178,920 (down + closing). Projections, not guarantees.
Landlord ↔ Tenant lean methodology
- Overall (STATE)
- 85 Strongly Landlord-Friendly
- State North Carolina
- 85 Strongly Landlord-Friendly · R+3
- County
- — inherits STATE
- City
- — inherits STATE
ZIP-level market 28570
- Home prices YoY
- -16.2%
- Active inventory
- 216
- Price-to-rent
- 3.6×
Monthly cashflow live
- Estimated rent
- $14,874 medium interval (Pro) →
- Mortgage (P&I)
- −$3,351
- Tax from tax record
- −$190 /mo · $2,281/yr
- Insurance
- −$266
- Flood insurance flood zone
- −$427 /mo · $5,118/yr
- HOA
- −$54
- Vacancy / Maint / Mgmt
- −$3,124
- Net cashflow
- $7,463
Break-even live
Sensitivity live
| Price | -10% $7,824 | -5% $7,643 | +0% $7,463 | +5% $7,282 | +10% $7,101 |
|---|---|---|---|---|---|
| Rent | -10% $6,287 | -5% $6,875 | +0% $7,463 | +5% $8,050 | +10% $8,638 |
| Rate | -1.0pp $7,784 | -0.5pp $7,625 | base $7,463 | +0.5pp $7,297 | +1.0pp $7,128 |
UW: 25.0% down · 7.5% · 30yr · 1.5% tax · 5.0% vac · 8.0% maint · 8.0% mgmt
Financing live
Cash to close
- Down payment
- $159,750
- Closing costs
- $19,170
- Reserves months
- —
- Total cash needed
- —
Loan-product check · same deal, 3 products live
Conventional
25% down · 7.5% · 30yr
- Down + closing
- —
- Monthly P&I
- —
- Monthly cashflow
- —
- DSCR
- —
- Eligible?
- —
Personal DTI + credit; lowest rate.
DSCR
20% down · 8.5% · 30yr
- Down + closing
- —
- Monthly P&I
- —
- Monthly cashflow
- —
- DSCR
- —
- Eligible?
- —
No personal income docs; deal must DSCR.
Hard money
10% down · 12.0% · 12mo
- Down + closing
- —
- Monthly P&I
- —
- Monthly cashflow
- —
- DSCR
- —
- Eligible?
- —
Short-term bridge; refi at stabilization.
HOA detail
- Monthly dues
- $54 · $648/yr
Listing history 25 events
-
2026-06-19days on market $639,000 Active 237 DOM
-
2026-06-18days on market $639,000 Active 236 DOM
-
2026-06-17days on market $639,000 Active 235 DOM
-
2026-06-16days on market $639,000 Active 234 DOM
-
2026-06-15days on market $639,000 Active 233 DOM
-
2026-06-14days on market $639,000 Active 231 DOM
-
2026-06-12days on market $639,000 Active 230 DOM
-
2026-06-09days on market $639,000 Active 227 DOM
-
2026-06-08days on market $639,000 Active 226 DOM
-
2026-06-07days on market $639,000 Active 225 DOM
-
2026-06-05days on market $639,000 Active 222 DOM
-
2026-06-03days on market $639,000 Active 221 DOM
-
2026-06-02days on market $639,000 Active 220 DOM
-
2026-06-01days on market $639,000 Active 219 DOM
-
2026-05-31days on market $639,000 Active 218 DOM
-
2026-05-30days on market $639,000 Active 217 DOM
-
2026-05-04price $639,000
-
2026-03-16price $650,000
-
2026-01-31price $664,900
-
2025-11-16status Active
-
2025-10-18status Pending
-
2025-10-14price $675,000
-
2025-09-26$699,000 Active
-
2013-04-26soldstatus $117,000 339-char remark
Show marketing remark (339 chars)
Great community with Full Marina and easy access to local beaches and Cherry Point. Property sold as-is. This is a Fannie Mae Homepath property. Purchase this property for as little as 3% down! This property is approved for HomePath Mortgage Financing. This property is approved for HomePath Renovation Mortgage Financing. www.homepath.com
-
2013-01-27$112,200 339-char remark
Show marketing remark (339 chars)
Great community with Full Marina and easy access to local beaches and Cherry Point. Property sold as-is. This is a Fannie Mae Homepath property. Purchase this property for as little as 3% down! This property is approved for HomePath Mortgage Financing. This property is approved for HomePath Renovation Mortgage Financing. www.homepath.com
ⓘ Source: listings_history table (triggers on properties + properties_extension) + one-shot
backfill from property_details.listing_events for pre-trigger history.
Tax reassessment forecast NC · Resets to sale price
- Current annual tax
- $2,281 · $190/mo
- Projected year-2 tax
- $5,240 · $437/mo
- Expected delta
- +$2,958/yr (+$247/mo · 129.7%)
ⓘ Screening estimate from a state-policy table — verify with the county assessor before closing.
Climate risk First Street
- Flood 8/10 Severe FEMA zone AE · 97% chance over 30 yrs
- Wildfire 4/10 Moderate
- Heat 9/10 Extreme 7 d/yr ≥103°F today · 22 d/yr by 30 yrs out
- Wind 9/10 Extreme 99% chance of damaging wind over 30 yrs
- Air quality 1/10 Low 0 unhealthy d/yr today · 0 by 30 yrs out
Nearby sold comps map
Loading sold comps map…
Walkable amenities ~0.75 mi
Loading nearby amenities…
Taxation est. · year 1
- Rental income
- $178,487
- − Mortgage interest
- −$35,794
- − Property taxes
- −$2,281
- − Insurance
- −$8,314
- − Repairs & maintenance
- −$14,279
- − Management
- −$14,279
- − HOA
- −$648
- − Depreciation
- −$18,589
- Taxable income
- $84,303
- Est. tax owed @ 24.0%
- −$20,233
- After-tax cash flow
- $69,317/yr
For passive investors: Depreciation is non-cash, so a rental often shows a tax loss while cash-flowing — sheltering income. Rental losses are passive: they offset passive income freely, and up to $25,000/yr can offset ordinary (W-2) income if you actively participate and your MAGI is under $100k (phasing out to $0 by $150k); unused losses carry forward. On sale, claimed depreciation is recaptured at up to 25%, and gains may owe capital-gains tax (a 1031 exchange can defer both). Figures are a year-1 estimate at your 24.0% rate — not tax advice; consult a CPA.
Schools (NCES district)
- District
- Carteret County Public Schools
- NCES district ID
- 3700630
- Math proficiency
- 59% ▲ 5.00%
- Reading proficiency
- 61% ▲ 2.00%
- Median HH income
- $48,330
- Composite
- 50.92/100
- National rank
- #1786
- State rank
- #31 of 178 in NC
Livability — Beaufort
- Score
- 63/100
- State rank
- #397
- US rank
- #15252
Category grades
Schools grade is shown separately in the Schools card above.
Census & demographics
- County
- Carteret County · 52,389 people
- Metro
- Morehead City, NC
- Population (ZIP)
- 22,197
- Household income
- $70,229
- Rent vs Own
- Severe rent burden
- 461.0
Population outlook (Carteret County) Hauer SSP2
- Today (2025)
- 73,443 people
- By 2030
- 75,344 · +2.6%
- By 2040
- 78,142 · +6.4%
- By 2050
- 80,091 · +9.1%
- By 2075
- 86,120 · +17.3%
- By 2100
- 89,408 · +21.7%
Race, ethnicity, and origin ACS 2023
- Neighborhood character
- Predominantly White (82%)
- Race & ethnicity
- White 82% Hispanic / Latino 7% Two or more races 6% Black 3% Asian 1%
- Hispanic origin (detail)
- Mexican 4%
- Common ancestry
- Slovak 3% Romanian 3% Lithuanian 2%
- Foreign-born
- 5% · Canada, Dominican Republic
- Languages at home
- 92% English-only · Spanish 6% German/W. Germanic 1%
Political lean MEDSL · Carteret
- 2024 margin
- Solid R (+43.1) · D 28.0% · R 71.1%
- 2008→2024 swing
- -8.4pp toward R · 2008: -34.7pp · 2024: -43.1pp
- All cycles
- 2024: R+43.1 2020: R+42.0 2016: R+44.5 2012: R+41.0 2008: R+34.7
Not yet ingested
- Civics
- —
Market trends
- HPI YoY
- ▼ -53.54%
- Current HPI
- 276.6589
- Rent YoY
- —
- Metro
- Morehead City, NC
- State GDP YoY
- ▲ 3.28%
- F500 in state
- 26
Industry mix (Fortune 500 HQ in NC)
| Industry | F500 HQs | Revenue |
|---|---|---|
| Financial Services | 2 | $213B |
|
||
| Retail | 2 | $95B |
|
||
| Industrial Conglomerate | 1 | $38B |
|
||
| Metals / Steel | 1 | $35B |
|
||
| Utilities | 1 | $30B |
|
||
| Industrial Machinery | 1 | $19B |
|
||
Price history
+469.5% since first listed9 events — show timeline
- 2026-05-04 Price Changed $639,000 Hive MLS
- 2026-03-16 Price Changed $650,000 Hive MLS
- 2026-01-31 Price Changed $664,900 Hive MLS
- 2025-11-16 Relisted — Hive MLS
- 2025-10-18 Pending — Hive MLS
- 2025-10-14 Price Changed $675,000 Hive MLS
- 2025-09-26 Listed $699,000 Hive MLS
- 2013-04-26 Sold (MLS) $117,000 Hive MLS
- 2013-01-27 Listed $112,200 Hive MLS
Property tax history
+10.8%/yrLatest (2025): $2,281 · +76.0% YoY. Source: county tax records.
Cash-flow waterfall
monthlySold comps — $/sqft
last 12 mo · ≤1 miLoading sold comps…