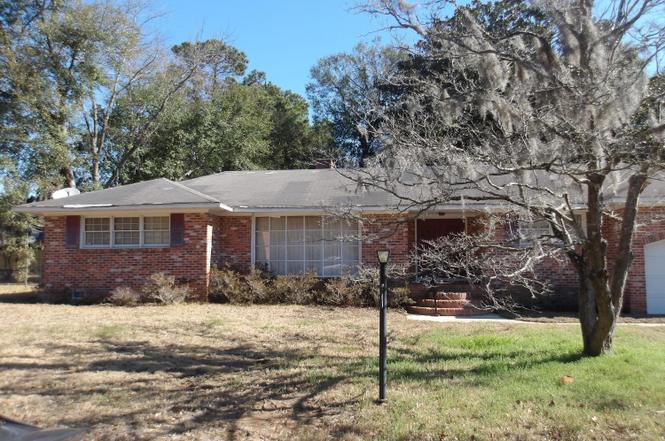
742 Condon Dr · James Island, SC
Flood risk 7/10 · Major
- FEMA flood zone
- X (shaded)
- Chance of flooding over 30 yrs
- 0.91%
- Est. flood insurance / yr
- $507 – $1,088
Fire risk 2/10 · Minimal
- Est. fire insurance / yr
- $783 – $1,453
Heat risk 10/10 · Severe
- Hot days now (above 104°F)
- 7 days/yr
- Hot days in 30 yrs
- 19 days/yr
Wind risk 9/10 · Severe
- Chance of severe wind over 30 yrs
- 99.0%
Air-quality risk 3/10 · Minor
- Unhealthy air days now
- 3 days/yr
- Unhealthy air days in 30 yrs
- 3 days/yr
Risk factors via First Street. Map © Google.
Why this score? — see what drove the D+ grade
The composite is a weighted blend of 9 inputs, each scored 0–100. Each bar is that input's sub-score; the figure is the points it added to the 100-point composite (weight × sub-score).
- Cash flow +14.2/30.0
- ARV discount +14.2/15.0
- DSCR +4.3/10.0
- Schools +4.3/10.0
- Livability +3.5/5.0
- Rent growth +3.0/5.0
- 1% rule +2.6/10.0
- Condition / age +2.5/5.0
- Appreciation +0.0/10.0
$649,000
🖨 Deal sheet (PDF) 📄 Offer letter ✓ Due diligence
Listing remarks
Handyman special. Home is being sold ''As-Is, no repairs.
Key facts
- 0.37 acre lot
- 2 garage spots
- Built 1965
Property features AI
Finance
- HOA & community: Community trash service
Exterior
- Parking: Attached 2-car garage
- Utilities: Public sewer; Charleston Water Service; Dominion Energy
- Home design: Single-family detached home; One story; Ground-level entry; Fee simple ownership
- Construction: Asphalt roof
- Exterior features: Chain link fencing; Level lot
Interior
- Kitchen: Built-in electric oven; Electric cooktop; Dishwasher; Refrigerator; Pantry (kitchen storage)
- Bedrooms: 4 bedrooms; Primary bedroom with ceiling fan(s)
- Flooring: Carpet; Ceramic tile; Vinyl
- Bathrooms: 2.5 bathrooms
- Heating & cooling: Central heating (natural gas); Central air conditioning
- Interior features: Family room; Formal living room; Pantry; Separate dining room; Wood-burning fireplace (one)
- Laundry & utility: Laundry room with washer and electric dryer hookups
Neighborhood map
What this means for you Summary
Snapshot
- This is a 4-bed/2.5-bath single-family listed at $649k.
Deal economics
- At list price, monthly cash flow is $44 ($525/yr) — positive.
- The deal already cash-flows at list — no discount required.
- To meet the 1% rule (rent ≥ 1% of price), the offer needs to be $493k (24.0% below list).
- Recommended offer: $493k (24.0% below list) — sets the bar for 1% rule.
- Cap rate 6.5% vs local median 2.4% in James Island — top-decile yield for the area; either an underpriced asset or a hidden risk that comps aren't pricing in. Stress-test before assuming the spread holds.
Location & tenants
- Location reads 70/100 on livability (#64 in SC) — a middle-class / working-renter tenant base. Strengths: employment A+, housing A+, crime A; Watch: amenities F, commute F, cost of living F.
- Charleston 01 (urban): math 48% / reading 53% proficiency, ranked #7 of 80 in SC (top 9%) — acceptable for families but not a draw, mixed tenant base, ~2y average lease.
- Zoned schools: Harbor View Elementary (math 65% / reading 63%, grade B, #63 of 597 statewide, top 11%, 639 students, 40% FRL); Camp Road Middle (math 50% / reading 57%, grade C+, #29 of 229 statewide, top 13%, 864 students, 38% FRL); James Island Charter High (math 73% / reading 89%, grade A, #21 of 196 statewide, top 11%, 1,589 students, 36% FRL, charter).
- Zoned-school proficiency averages 66% at this address vs 50% district-wide (+16 pts) — the actual schools serving this property are materially stronger than the Charleston 01 average implies; a family-tenant draw the district grade alone would hide.
- Market conditions: Rents rising (+2.1%/yr); 301 active listings in the ZIP; 3 comparable units currently listed for rent nearby; rentals at typical pace (median 25d on market — plan ~3-4 weeks tenant-placement turnaround); solid renter incomes; 4,156 units permitted in Charleston County in 2024 (857 in 5+ unit buildings).
- At $4,933/mo this rent would consume 58% of the median local household income ($102k/yr) (locally 1006% of renters already pay >50% of income on rent) — very limited rent-growth headroom before tenants either downsize or default.
Forward outlook
- Local home prices are declining (-3.0%/yr); year-one equity from $4k of loan paydown is wiped out by about $19k of value loss. Plan a longer hold.
- Charleston County population projected at +44% by 2050 — long-run rental-demand tailwind backs the buy-and-hold thesis.
Negotiation context
- It's been on market 45 days — a 3% lower offer ($630k) is reasonable based on typical stale-listing flexibility.
- Current owner paid $85k; list at $649k implies a 664% gain — meaningful room to come down on a strong offer.
Risks & watch-outs
- Watch-outs: flood insurance adds $66/mo.
- Climate carrying-cost: major flood risk; severe wind risk, 99% chance of damaging wind over 30y; extreme-heat days projected 7→19/yr by 2055 (HVAC capex compounding) — expect insurance premiums to compound above CPI over the hold.
Questions for the listing agent
- It's been on market 45 days. Have you received any prior offers? Is the seller open to a 24% concession, seller financing, or rate buy-down credit?
- Built in 1965 — when were the roof, HVAC, electrical panel, plumbing, and water heater last replaced?
- What's the actual annual flood-insurance premium (NFIP or private), and is the property in a SFHA with mandatory coverage?
- Is there a deadline driving the sale (1031 exchange, divorce, estate, relocation)? That informs how much negotiation room exists.
- Schools are D-rated, which usually means shorter tenancies and higher turnover. Who's the typical renter profile here, and what's been the actual vacancy rate?
- The area grade is low — what's the realistic commute time and amenity access for the typical tenant pool here? Any planned neighborhood developments (good or bad) we should know about?
- What's the average days-on-market for RENTAL listings here right now (not sales)? A rising rental-DOM trend means longer vacancies and softer asking-rent achievability than the comps imply.
- What's the recent tenant-quality profile in this submarket — average credit score on applications, eviction rate, late-payment / NSF rate, and stable-employment percentage? A property-management company in the area should have these aggregated.
- How much new for-sale + rental construction is in the pipeline within 1–3 miles? Heavy new supply typically softens prices + rents 12–24 months out; constrained supply supports both.
Investment metrics
- 1% rule
- 0.76% ✗
- Cap rate
- 6.50%
- Cash-on-cash
- 0.73%
- DSCR
- 1.03
- GRM
- 11.0
CMA / ARV
- ARV (on-the-fly)
- $761,794
- Comps found
- 12
Show comp detail 12 sales within ~0.75 mi
| Address | Dist | Beds/Ba | Sqft | Sold | Price | $/sf | Match |
|---|---|---|---|---|---|---|---|
| 1468 N Relyea Ave | 0.23mi | 3/3.0 (-1) | 2,221 (-1%) | 10mo | $1,100,000 | $495 | 72 |
| 1251 Julian Clark Rd | 0.47mi | 4/3.0 | 2,156 (-4%) | 2mo | $735,000 | $341 | 68 |
| 620 N Shore Dr | 0.53mi | 4/3.5 | 2,230 (-0%) | 4mo | $1,050,000 | $471 | 68 |
| 716 Waites Dr | 0.43mi | 3/2.0 (-1) | 2,054 (-8%) | 2mo | $540,000 | $263 | 58 |
| 1563 Relyea Ave | 0.36mi | 3/3.0 (-1) | 2,470 (+11%) | 2mo | $625,000 | $253 | 57 |
| 713 Lake Frances Dr | 0.74mi | 3/3.0 (-1) | 2,313 (+4%) | 1mo | $865,000 | $374 | 52 |
| 949 Dills Bluff Rd | 0.71mi | 4/2.5 | 2,048 (-8%) | 2mo | $635,000 | $310 | 52 |
| 1110 Darwin St | 0.48mi | 3/2.0 (-1) | 2,040 (-9%) | 7mo | $730,000 | $358 | 50 |
| 848 Harbor Place Dr | 0.70mi | 4/2.5 | 1,939 (-13%) | 2mo | $650,000 | $335 | 44 |
| 847 Quail Dr | 0.40mi | 3/2.0 (-1) | 1,910 (-14%) | 10mo | $565,500 | $296 | 42 |
| 740 Lawton Pl | 0.64mi | 4/3.5 | 2,560 (+15%) | 4mo | $1,554,230 | $607 | 39 |
| 976 Mcelveen St | 0.74mi | 5/3.0 (+1) | 2,560 (+15%) | 2mo | $865,000 | $338 | 32 |
Match score weights: distance 35% · size 25% · config 20% · recency 20%. Top-matched comps best support the ARV.
Projected returns pro-forma
-3.0% appreciation · 2.06% rent growth · sell at horizon
- IRR
- -16.8%
- Equity multiple
- 0.41×
- Total profit
- $-107,315
- Equity at exit
- $96,768
- IRR
- -10.3%
- Equity multiple
- 0.40×
- Total profit
- $-109,747
- Equity at exit
- $56,114
Cash invested: $181,720 (down + closing). Projections, not guarantees.
Landlord ↔ Tenant lean methodology
- Overall (STATE)
- 90 Strongly Landlord-Friendly
- State South Carolina
- 90 Strongly Landlord-Friendly · R+6
- County
- — inherits STATE
- City
- — inherits STATE
ZIP-level market 29412
- Rents YoY
- 2.1%
- Active inventory
- 301
- Price-to-rent
- 11.0×
Monthly cashflow live
- Estimated rent
- $4,933 medium interval (Pro) →
- Mortgage (P&I)
- −$3,403
- Tax from tax record
- −$113 /mo · $1,359/yr
- Insurance
- −$270
- Flood insurance flood zone
- −$66 /mo · $798/yr
- HOA
- −$0
- Vacancy / Maint / Mgmt
- −$1,036
- Net cashflow
- $44
Break-even live
Sensitivity live
| Price | -10% $411 | -5% $227 | +0% $44 | +5% $-878 | +10% $-1,103 |
|---|---|---|---|---|---|
| Rent | -10% $-346 | -5% $-151 | +0% $44 | +5% $239 | +10% $433 |
| Rate | -1.0pp $371 | -0.5pp $209 | base $44 | +0.5pp $-124 | +1.0pp $-295 |
UW: 25.0% down · 7.5% · 30yr · 1.5% tax · 5.0% vac · 8.0% maint · 8.0% mgmt
Financing live
Cash to close
- Down payment
- $162,250
- Closing costs
- $19,470
- Reserves months
- —
- Total cash needed
- —
Loan-product check · same deal, 3 products live
Conventional
25% down · 7.5% · 30yr
- Down + closing
- —
- Monthly P&I
- —
- Monthly cashflow
- —
- DSCR
- —
- Eligible?
- —
Personal DTI + credit; lowest rate.
DSCR
20% down · 8.5% · 30yr
- Down + closing
- —
- Monthly P&I
- —
- Monthly cashflow
- —
- DSCR
- —
- Eligible?
- —
No personal income docs; deal must DSCR.
Hard money
10% down · 12.0% · 12mo
- Down + closing
- —
- Monthly P&I
- —
- Monthly cashflow
- —
- DSCR
- —
- Eligible?
- —
Short-term bridge; refi at stabilization.
Rent comps 3 comps
| Address | Beds | Baths | Sqft | Rent | $/sqft | DOM | Units | Dist |
|---|---|---|---|---|---|---|---|---|
| 1255 Harbor View Ln Charleston, SC | 3.0 | 3.0 | 2010 | $6,800 | $3.38 | 16d | 1 | 0.59mi |
| 1129 Quail Dr Charleston, SC | 4.0 | 3.0 | 1475 | $5,200 | $3.53 | 25d | 1 | 0.62mi |
| 753 Sprague St Charleston, SC | 3.0 | 2.0 | 1680 | $4,600 | $2.74 | 25d | 1 | 0.63mi |
Listing history 13 events
-
2026-06-15status $649,000 Pending 45 DOM
-
2026-06-15days on market $649,000 Active Under Contract 45 DOM
-
2026-06-10days on market $649,000 Active Under Contract 40 DOM
-
2026-06-09days on market $649,000 Active Under Contract 39 DOM
-
2026-06-08days on market $649,000 Active Under Contract 38 DOM
-
2026-06-07days on market $649,000 Active Under Contract 37 DOM
-
2026-06-05days on market $649,000 Active Under Contract 34 DOM
-
2026-06-03days on market $649,000 Active Under Contract 33 DOM
-
2026-06-01days on market $649,000 Active Under Contract 31 DOM
-
2026-05-31days on market $649,000 Active Under Contract 30 DOM
-
2026-05-04historical Active Under Contract
-
2026-05-01$649,000 Active
-
1987-07-08soldstatus $85,000
ⓘ Source: listings_history table (triggers on properties + properties_extension) + one-shot
backfill from property_details.listing_events for pre-trigger history.
Tax reassessment forecast SC · Resets to sale price
- Current annual tax
- $1,359 · $113/mo
- Projected year-2 tax
- $3,699 · $308/mo
- Expected delta
- +$2,340/yr (+$195/mo · 172.2%)
ⓘ Screening estimate from a state-policy table — verify with the county assessor before closing.
Climate risk First Street
- Flood 7/10 Severe FEMA zone X (shaded) · 91% chance over 30 yrs
- Wildfire 2/10 Low
- Heat 10/10 Extreme 7 d/yr ≥104°F today · 19 d/yr by 30 yrs out
- Wind 9/10 Extreme 99% chance of damaging wind over 30 yrs
- Air quality 3/10 Moderate 3 unhealthy d/yr today · 3 by 30 yrs out
Nearby sold comps map
Loading sold comps map…
Walkable amenities ~0.75 mi
Loading nearby amenities…
Taxation est. · year 1
- Rental income
- $59,200
- − Mortgage interest
- −$36,354
- − Property taxes
- −$1,359
- − Insurance
- −$4,042
- − Repairs & maintenance
- −$4,736
- − Management
- −$4,736
- − Depreciation
- −$18,880
- Taxable loss
- −$10,908
- Est. tax savings @ 24.0%
- +$2,618
- After-tax cash flow
- $3,143/yr
For passive investors: Depreciation is non-cash, so a rental often shows a tax loss while cash-flowing — sheltering income. Rental losses are passive: they offset passive income freely, and up to $25,000/yr can offset ordinary (W-2) income if you actively participate and your MAGI is under $100k (phasing out to $0 by $150k); unused losses carry forward. On sale, claimed depreciation is recaptured at up to 25%, and gains may owe capital-gains tax (a 1031 exchange can defer both). Figures are a year-1 estimate at your 24.0% rate — not tax advice; consult a CPA.
Schools (NCES district)
- District
- Charleston 01
- NCES district ID
- 4501440
- Math proficiency
- 48% ▼ -2.00%
- Reading proficiency
- 53% ▬ 0.00%
- Median HH income
- $52,376
- Composite
- 43.41/100
- National rank
- #3018
- State rank
- #7 of 80 in SC
Livability — James Island
- Score
- 70/100
- State rank
- #64
- US rank
- #7731
Category grades
Schools grade is shown separately in the Schools card above.
Census & demographics
- Census place
- James Island, SC
- County
- Charleston County · 366,793 people
- Metro
- Charleston-North Charleston, SC
- Population (ZIP)
- 39,256
- Household income
- $101,509
- Rent vs Own
- Severe rent burden
- 1006.0
Population outlook (Charleston County) Hauer SSP2
- Today (2025)
- 480,562 people
- By 2030
- 525,921 · +9.4%
- By 2040
- 612,189 · +27.4%
- By 2050
- 691,627 · +43.9%
- By 2075
- 847,979 · +76.5%
- By 2100
- 926,482 · +92.8%
Race, ethnicity, and origin ACS 2023
- Neighborhood character
- Predominantly White (74%)
- Race & ethnicity
- White 74% Black 16% Hispanic / Latino 5% Two or more races 4% Asian 2%
- Common ancestry
- Slovak 3% Italian 3% Lithuanian 2%
- Foreign-born
- 5% · Canada, China
- Languages at home
- 94% English-only · Spanish 3% French/Haitian/Cajun 1% Other Indo-European 1%
Political lean MEDSL · Charleston
- 2024 margin
- Lean D (+5.7) · D 51.9% · R 46.3% · Other 1.8%
- 2008→2024 swing
- -2.7pp toward R · 2008: 8.3pp · 2024: 5.7pp
- All cycles
- 2024: D+5.7 2020: D+12.9 2016: D+7.9 2012: D+2.4 2008: D+8.3
Not yet ingested
- Civics
- —
Market trends
- HPI YoY
- ▼ -564.80%
- Current HPI
- 400.0617
- Rent YoY
- ▲ 2.06%
- Metro
- Charleston-North Charleston, SC
- State GDP YoY
- ▲ 4.51%
- F500 in state
- 2
Industry mix (Fortune 500 HQ in SC)
| Industry | F500 HQs | Revenue |
|---|---|---|
| Packaging | 1 | $7B |
|
||
Price history
+663.5% since first listed3 events — show timeline
- 2026-05-04 Contingent — Charleston Trident MLS
- 2026-05-01 Listed $649,000 Charleston Trident MLS
- 1987-07-08 Sold (Public Records) $85,000 Public Records
Property tax history
-0.4%/yrLatest (2022): $1,359 · -6.5% YoY. Source: county tax records.
Cash-flow waterfall
monthlySold comps — $/sqft
last 12 mo · ≤1 miLoading sold comps…