 🏷️ Likely Rental
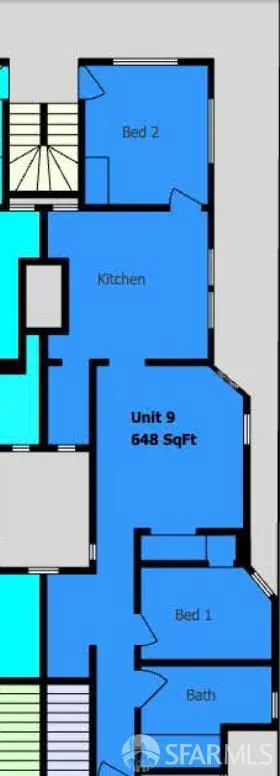
380 Dolores St #9 · San Francisco, CA
Flood risk 1/10 · Minimal
- FEMA flood zone
- X (unshaded)
- Chance of flooding over 30 yrs
- 0.0%
- Est. flood insurance / yr
- $507 – $1,088
Fire risk 1/10 · Minimal
- Est. fire insurance / yr
- $659 – $1,223
Heat risk 2/10 · Minimal
- Hot days now (above 78°F)
- 8 days/yr
- Hot days in 30 yrs
- 19 days/yr
Wind risk 1/10 · Minimal
- Chance of severe wind over 30 yrs
- —
Air-quality risk 8/10 · Major
- Unhealthy air days now
- 15 days/yr
- Unhealthy air days in 30 yrs
- 15 days/yr
Risk factors via First Street. Map © Google.
Why this score? — see what drove the B grade
The composite is a weighted blend of 9 inputs, each scored 0–100. Each bar is that input's sub-score; the figure is the points it added to the 100-point composite (weight × sub-score).
- Cash flow +30.0/30.0
- 1% rule +10.0/10.0
- DSCR +10.0/10.0
- ARV discount +7.5/15.0
- Rent growth +5.0/5.0
- Schools +5.0/10.0
- Livability +3.8/5.0
- Condition / age +2.2/5.0
- Appreciation +0.0/10.0
$246,000
🖨 Deal sheet 📄 Offer letter ✓ Due diligence
Listing remarks MLS
Your opportunity to create your own masterpiece one block to Dolores Park. * * This is a tenant occupied property being sold together with the unit above for a bundle sale of $995,000. * * This classic early 20th century Victorian flat is available for the first time and waiting for your vision. Original details & charm. Ditch the car & enjoy real, easy city living. Walking distance to shops, Bi-Rite, Dolores Park Cafe, Delfina, Tartine Bakery, Whole Foods - Maxfield Cafe for your morning coffee is a few doors down. Tenant occupied. * This unit is being sold with Unit #10 as a bundle sale for $995,000 *
Key facts
- Original details
- 3,667 sq ft lot
- Listed 78 days
Tags
Neighborhood map
What this means for you Summary
Snapshot
- This is a 2-bed/1.0-bath condo listed at $246k. Condition is rated fair.
Deal economics
- At list price, monthly cash flow is $1k ($17k/yr) — positive.
- The deal already cash-flows at list — no discount required.
- Meets the 1% rule at list price ($4k rent vs $246k).
- Recommended offer: $231k (6.0% below list) — sets the bar for market timing.
- Cap rate 13.2% vs local median 2.1% in San Francisco — top-decile yield for the area; either an underpriced asset or a hidden risk that comps aren't pricing in. Stress-test before assuming the spread holds.
Location & tenants
- Location reads 76/100 on livability (#90 in CA, #3,143 nationally) — a middle-class / working-renter tenant base. Strengths: amenities A+, commute A+, employment A+; Watch: crime F, cost of living F.
- San Francisco Unified (urban): math 50% / reading 56% proficiency, ranked #322 of 1,400 in CA (top 23%) — acceptable for families but not a draw, mixed tenant base, ~2y average lease.
- Market conditions: Rents rising fast (+14.5%/yr); 161 active listings in the ZIP; 40 comparable units currently listed for rent nearby; rentals leasing fast (median 13d on market — plan ~1-2 weeks tenant-placement turnaround); high-income renter base; 750 units permitted in San Francisco County in 2024 (688 in 5+ unit buildings).
- This rent runs 34% of the median local income ($158k/yr) — at the standard rent-burdened threshold; future hikes will face affordability resistance.
Forward outlook
- Local home prices are declining (-3.0%/yr); year-one equity from $2k of loan paydown is wiped out by about $7k of value loss. Plan a longer hold.
- San Francisco County population projected at +39% by 2050 — long-run rental-demand tailwind backs the buy-and-hold thesis.
- At projected returns (-3.0% appreciation + 8.0% rent growth), your $69k cash investment doubles in ~5 years — after that, you're playing with house money.
Negotiation context
- It's been on market 78 days — a 6% lower offer ($231k) is reasonable based on typical stale-listing flexibility.
- 4 sale attempts since 2y ago with the ask held roughly flat each time — persistent listings suggest the price (not the market) is what's stuck; bring a comps-based counter.
Questions for the listing agent
- It's been on market 78 days. Have you received any prior offers? Is the seller open to a 6% concession, seller financing, or rate buy-down credit?
- Have any recent inspections been done? Can we get a copy of the seller's disclosures and any deferred-maintenance estimates?
- What does the HOA fee cover, when was the last increase, and are there any pending special assessments or reserve-fund shortfalls?
- Any open or pending special assessments — roof, HVAC, plumbing, elevator, façade? What's the per-unit balance and payoff schedule, and is the seller paying it off at close or rolling it to the buyer?
- Why hasn't it sold? Are there any deal-killer items the seller is aware of (foundation, flood, title, zoning, code violations)?
- Is there a deadline driving the sale (1031 exchange, divorce, estate, relocation)? That informs how much negotiation room exists.
- Schools are B-rated — typically a magnet for longer-tenancy family renters. What's the average tenant stay here, and is there a school-zone premium baked into asking?
- Crime grade is F in this area — have there been break-ins, vandalism, or insurance claims at this property in the last 3 years? What carrier currently insures it and at what premium?
- What's the average days-on-market for RENTAL listings here right now (not sales)? A rising rental-DOM trend means longer vacancies and softer asking-rent achievability than the comps imply.
- What's the recent tenant-quality profile in this submarket — average credit score on applications, eviction rate, late-payment / NSF rate, and stable-employment percentage? A property-management company in the area should have these aggregated.
- How much new apartment / multifamily construction is in the pipeline within 1–3 miles? Heavy new supply (>2% of stock underway) typically softens rents 12–24 months out; light construction supports rent growth.
Investment metrics
- 1% rule
- 1.83% ✓
- Cap rate
- 13.18%
- Cash-on-cash
- 24.59%
- DSCR
- 2.09
- GRM
- 4.6
CMA / ARV
- ARV (median comp)
- $755,982
- List price
- $246,000
- Delta
- -67.46%
- Verdict
- UNDERPRICED
- Comps
- 20 within 1.0 mi
Projected returns pro-forma
-3.0% appreciation · 8.0% rent growth · sell at horizon
- IRR
- 24.3%
- Equity multiple
- 2.08×
- Total profit
- $74,126
- Equity at exit
- $36,679
- IRR
- 35.5%
- Equity multiple
- 5.21×
- Total profit
- $289,805
- Equity at exit
- $21,270
Cash invested: $68,880 (down + closing). Projections, not guarantees.
Landlord ↔ Tenant lean methodology
- Overall (CITY)
- 0 Strongly Tenant-Friendly
- State California
- 18 Strongly Tenant-Friendly · D+13
- County
- — inherits STATE
- City San Francisco
- 0 Strongly Tenant-Friendly · D+57
ZIP-level market 94110
- Rents YoY
- 14.5%
- Active inventory
- 161
- Price-to-rent
- 4.6×
Monthly cashflow live
- Estimated rent
- $4,496 high interval (Pro) →
- Mortgage (P&I)
- −$1,290
- Tax est. 1.5%
- −$308 /mo · $3,690/yr
- Insurance
- −$102
- HOA est. from 5 same-building comps
- −$440
- Vacancy / Maint / Mgmt
- −$944
- Net cashflow
- $1,411
Break-even live
UW: 25.0% down · 7.5% · 30yr · 1.5% tax · 5.0% vac · 8.0% maint · 8.0% mgmt
Financing live
Cash to close
- Down payment
- $61,500
- Closing costs
- $7,380
- Reserves months
- —
- Total cash needed
- —
Loan-product check · same deal, 3 products live
Conventional
25% down · 7.5% · 30yr
- Down + closing
- —
- Monthly P&I
- —
- Monthly cashflow
- —
- DSCR
- —
- Eligible?
- —
Personal DTI + credit; lowest rate.
DSCR
20% down · 8.5% · 30yr
- Down + closing
- —
- Monthly P&I
- —
- Monthly cashflow
- —
- DSCR
- —
- Eligible?
- —
No personal income docs; deal must DSCR.
Hard money
10% down · 12.0% · 12mo
- Down + closing
- —
- Monthly P&I
- —
- Monthly cashflow
- —
- DSCR
- —
- Eligible?
- —
Short-term bridge; refi at stabilization.
Rent comps 40 comps
| Address | Beds | Baths | Sqft | Rent | $/sqft | DOM | Units | Dist |
|---|---|---|---|---|---|---|---|---|
| 429 14th St #1621 San Francisco, CA | 1.0 | 1.0 | 500 | $3,440 | $6.88 | 43d | 1 | 0.41mi |
| 270 Valencia St #205 San Francisco, CA | 1.0 | 1.0 | 500 | $3,800 | $7.60 | 43d | 1 | 0.46mi |
| 1600 15th St San Francisco, CA | 1.0–2.0 | 1.0–2.0 | 792 | $5,614 | $7.08 | 3d | 5 | 0.46mi |
| 2315 Mission St San Francisco, CA | 1.0 | 1.0 | 450 | $2,995 | $6.66 | 2d | 1 | 0.48mi |
| 2315 Mission St Unit 106 San Francisco, CA | 1.0 | 1.0 | 450 | $2,995 | $6.66 | 7d | 1 | 0.48mi |
| 940 Guerrero St Unit 02 San Francisco, CA | 1.0 | 1.0 | 550 | $4,295 | $7.81 | 16d | 1 | 0.51mi |
| 940 Guerrero St Unit 06 San Francisco, CA | 1.0 | 1.0 | 520 | $4,295 | $8.26 | 24d | 1 | 0.51mi |
| 1801 Mission St San Francisco, CA | 1.0 | 1.0 | 446 | $10,000 | $22.42 | 43d | 1 | 0.53mi |
| 3410 22nd St Apt 6 San Francisco, CA | 2.0 | 1.0 | 720 | $4,500 | $6.25 | 1d | 1 | 0.57mi |
| 35 Hill St San Francisco, CA | 1.0 | 1.0 | 674 | $3,500 | $5.19 | 7d | 1 | 0.57mi |
| 799 S Van Ness Ave San Francisco, CA | 1.0–2.0 | 1.0 | 740 | $4,500 | $6.08 | 2d | 2 | 0.59mi |
| 169 Fair Oaks St Unit 01 San Francisco, CA | 2.0 | 2.0 | 750 | $4,250 | $5.67 | 43d | 1 | 0.64mi |
| 155 Eureka St San Francisco, CA | 1.0 | 1.0 | 650 | $4,300 | $6.62 | 24d | 1 | 0.64mi |
| 155 Eureka St San Francisco, CA | 1.0 | 1.0 | 750 | $5,000 | $6.67 | 43d | 1 | 0.64mi |
| 68 McCoppin St San Francisco, CA | 1.0 | 1.0 | 734 | $3,825 | $5.21 | 16d | 2 | 0.67mi |
| 1699 Market St San Francisco, CA | 1.0 | 1.0 | 561 | $4,817 | $8.59 | 1d | 5 | 0.71mi |
| 1 Brady St San Francisco, CA | 2.0 | 1.0–2.0 | 889 | $7,385 | $8.30 | 1d | 29 | 0.80mi |
| 30 Otis St San Francisco, CA | 2.0 | 1.0–2.0 | 874 | $10,000 | $11.44 | 2d | 13 | 0.83mi |
| 325 Octavia St San Francisco, CA | 2.0 | 1.0–2.0 | 811 | $7,583 | $9.35 | 2d | 1 | 0.85mi |
| 257 San Jose Ave #1 San Francisco, CA | 1.0 | 1.0 | 500 | $2,999 | $6.00 | 24d | 1 | 0.87mi |
| 1000 Oak St Apt 7 San Francisco, CA | 1.0 | 1.0 | 645 | $3,995 | $6.19 | 43d | 1 | 0.88mi |
| 2629 Folsom St Unit 204 San Francisco, CA | 2.0 | 1.0 | 718 | $4,095 | $5.70 | 43d | 1 | 0.89mi |
| 2629 Folsom St Unit 106 San Francisco, CA | 2.0 | 1.0 | 718 | $4,395 | $6.12 | 17d | 1 | 0.89mi |
| 2629 Folsom St Unit 105 San Francisco, CA | 1.0 | 1.0 | 546 | $3,100 | $5.68 | 17d | 1 | 0.89mi |
| 2823 18th St San Francisco, CA | 1.0 | 1.0 | 519 | $4,718 | $9.08 | 2d | 4 | 0.91mi |
| 1532 Harrison St San Francisco, CA | 2.0 | 1.0–2.0 | 617 | $4,897 | $7.94 | 1d | 11 | 0.92mi |
| 575 Pierce St San Francisco, CA | 1.0 | 1.0 | 700 | $5,595 | $7.99 | 43d | 1 | 0.94mi |
| 225 Fell St San Francisco, CA | 1.0 | 1.0 | 512 | $4,495 | $8.77 | 7d | 3 | 0.94mi |
| 457 Jersey St Unit 5 San Francisco, CA | 2.0 | 1.0 | 700 | $4,495 | $6.42 | 5d | 1 | 0.99mi |
| 457 Jersey St Unit 5 San Francisco, CA | 2.0 | 1.0 | 700 | $4,495 | $6.42 | 12d | 1 | 0.99mi |
| 412 Broderick St Unit 416 San Francisco, CA | 1.0 | 1.0 | 580 | $4,495 | $7.75 | 5d | 1 | 1.02mi |
| 530 Grove St San Francisco, CA | 1.0 | 1.0 | 600 | $3,895 | $6.49 | 7d | 1 | 1.02mi |
| 100 Van Ness Ave #1477 San Francisco, CA | 1.0–2.0 | 1.0–2.0 | 893 | $7,990 | $8.94 | 1d | 2 | 1.02mi |
| 370 Upper Ter Unit 2 San Francisco, CA | 1.0 | 1.0 | 700 | $4,400 | $6.29 | 17d | 1 | 1.04mi |
| 8 10th St San Francisco, CA | 2.0 | 1.0–2.0 | 919 | $8,495 | $9.24 | 2d | 28 | 1.05mi |
| 1019 Ashbury St San Francisco, CA | 1.0 | 1.0 | 535 | $3,790 | $7.08 | 14d | 1 | 1.06mi |
| 150 Van Ness Ave #1475 San Francisco, CA | 1.0 | 1.0 | 615 | $5,510 | $8.96 | 20d | 1 | 1.06mi |
| 1 Polk St San Francisco, CA | 1.0 | 1.0 | 773 | $4,644 | $6.00 | 2d | 4 | 1.07mi |
| 1643 Castro St Apt 6 San Francisco, CA | 1.0 | 1.0 | 563 | $3,695 | $6.56 | 7d | 1 | 1.07mi |
| 1 Homestead San Francisco, CA | 2.0 | 1.0 | 750 | $6,900 | $9.20 | 24d | 1 | 1.08mi |
HOA detail condo
- Monthly dues
- $0 · $0/yr
- Assessments
- None detected in remarks — confirm with the listing agent.
Listing history 18 events
-
2026-06-18days on market $246,000 Active 78 DOM
-
2026-06-17days on market $246,000 Active 77 DOM
-
2026-06-16days on market $246,000 Active 76 DOM
-
2026-06-15days on market $246,000 Active 75 DOM
-
2026-06-13days on market $246,000 Active 73 DOM
-
2026-06-13days on market $246,000 Active 72 DOM
-
2026-06-09days on market $246,000 Active 69 DOM
-
2026-06-08days on market $246,000 Active 68 DOM
-
2026-06-07days on market $246,000 Active 67 DOM
-
2026-06-04days on market $246,000 Active 64 DOM
-
2026-06-03days on market $246,000 Active 63 DOM
-
2026-06-02days on market $246,000 Active 62 DOM
-
2026-06-01days on market $246,000 Active 61 DOM
-
2026-05-31days on market $246,000 Active 60 DOM
-
2026-04-01$246,000 Active 625-char remark
Show marketing remark (625 chars)
Your opportunity to create your own masterpiece one block to Dolores Park. * * This is a tenant occupied property being sold together with the unit above for a bundle sale of $995,000. * * This classic early 20th century Victorian flat is available for the first time and waiting for your vision. Original details & charm. Ditch the car & enjoy real, easy city living. Walking distance to shops, Bi-Rite, Dolores Park Cafe, Delfina, Tartine Bakery, Whole Foods - Maxfield Cafe for your morning coffee is a few doors down. Tenant occupied. * This unit is being sold with Unit #10 as a bundle sale for $995,000 *
-
2025-11-03status Active
-
2025-08-28$344,000 Active
-
2024-05-06$345,000 Active
ⓘ Source: listings_history table (triggers on properties + properties_extension) + one-shot
backfill from property_details.listing_events for pre-trigger history.
Climate risk First Street
- Flood 1/10 Low FEMA zone X (unshaded) · 0% chance over 30 yrs
- Wildfire 1/10 Low
- Heat 2/10 Low 8 d/yr ≥78°F today · 19 d/yr by 30 yrs out
- Wind 1/10 Low
- Air quality 8/10 Severe 15 unhealthy d/yr today · 15 by 30 yrs out
Nearby sold comps map
Loading sold comps map…
Walkable amenities ~0.75 mi
Loading nearby amenities…
Taxation est. · year 1
- Rental income
- $53,946
- − Mortgage interest
- −$13,780
- − Property taxes
- −$3,690
- − Insurance
- −$1,230
- − Repairs & maintenance
- −$4,316
- − Management
- −$4,316
- − HOA
- −$5,280
- − Depreciation
- −$7,156
- Taxable income
- $14,179
- Est. tax owed @ 24.0%
- −$3,403
- After-tax cash flow
- $13,534/yr
For passive investors: Depreciation is non-cash, so a rental often shows a tax loss while cash-flowing — sheltering income. Rental losses are passive: they offset passive income freely, and up to $25,000/yr can offset ordinary (W-2) income if you actively participate and your MAGI is under $100k (phasing out to $0 by $150k); unused losses carry forward. On sale, claimed depreciation is recaptured at up to 25%, and gains may owe capital-gains tax (a 1031 exchange can defer both). Figures are a year-1 estimate at your 24.0% rate — not tax advice; consult a CPA.
Condition & rehab AI · 6 photos
This property requires significant repairs and maintenance, including exterior painting, flooring refinishing, and window replacement. While it has potential, the current condition is not ideal for resale or rental value.
Repairs flagged
- Major Exterior paint — The exterior paint is faded and chipped, indicating a need for repainting.
- Major Flooring — The flooring appears worn and may need replacement or refinishing.
- Major Interior walls and ceilings — The walls and ceilings show signs of wear and discoloration, indicating a need for repainting or repairs.
- Major Exterior siding — The siding is in poor condition, with visible wear and tear, and the paint is faded.
- Major Windows — The windows appear to be in poor condition, with some showing signs of wear and tear.
Value-add opportunities
- Resale Exterior paint — Fresh paint can significantly enhance the curb appeal and overall aesthetic of the property, making it more attractive to potential buyers.
- Rental Floor refinishing — Refinished flooring can improve the overall condition of the property, making it more appealing to renters and potentially increasing rental income.
- Both Interior wall and ceiling repairs — Repairs to the interior walls and ceilings can improve the overall condition of the property, making it more attractive to both buyers and renters.
- Resale Exterior siding repair — Repairing the exterior siding can improve the overall condition of the property, making it more attractive to potential buyers.
- Both Window replacement — Replacing the windows can improve the overall condition of the property, making it more attractive to both buyers and renters.
Renovation cost estimate screening
| Repair item | Severity | Est. cost |
|---|---|---|
| Exterior paint · The exterior paint is faded and chipped, indicating a need for repainting. | Major | $15,000–50,000 |
| Flooring · The flooring appears worn and may need replacement or refinishing. | Major | $15,000–50,000 |
| Interior walls and ceilings · The walls and ceilings show signs of wear and discoloration, indicating a need for repainting or repairs. | Major | $15,000–50,000 |
| Exterior siding · The siding is in poor condition, with visible wear and tear, and the paint is faded. | Major | $15,000–50,000 |
| Windows · The windows appear to be in poor condition, with some showing signs of wear and tear. | Major | $15,000–50,000 |
| Total estimated repair cost · 5 items | $75,000–250,000 |
Value-add ROI direction
- Resale Exterior paint — Fresh paint can significantly enhance the curb appeal and overall aesthetic of the property, making it more attractive to potential buyers. ↑
- Rental Floor refinishing — Refinished flooring can improve the overall condition of the property, making it more appealing to renters and potentially increasing rental income. ↑
- Both Interior wall and ceiling repairs — Repairs to the interior walls and ceilings can improve the overall condition of the property, making it more attractive to both buyers and renters. ↑
- Resale Exterior siding repair — Repairing the exterior siding can improve the overall condition of the property, making it more attractive to potential buyers. ↑
- Both Window replacement — Replacing the windows can improve the overall condition of the property, making it more attractive to both buyers and renters. ↑
ⓘ Cost ranges are severity-bucket heuristics (US national rule-of-thumb). Get contractor quotes + a written scope before underwriting a rehab budget.
Schools (NCES district)
- District
- San Francisco Unified
- NCES district ID
- 0634410
- Math proficiency
- 50% ▬ 0.00%
- Reading proficiency
- 56% ▲ 1.00%
- Median HH income
- $81,249
- Composite
- 50.14/100
- National rank
- #4088
- State rank
- #322 of 1400 in CA
Livability — San Francisco
- Score
- 76/100
- State rank
- #90
- US rank
- #3143
Category grades
Schools grade is shown separately in the Schools card above.
Census & demographics
- Census place
- San Francisco, CA
- County
- San Francisco County · 827,552 people
- City population
- 827,552
- Metro
- San Francisco-Oakland-Berkeley, CA
- Population (ZIP)
- 66,865
- Household income
- $158,351
- Rent vs Own
- Severe rent burden
- 2732.0
Population outlook (San Francisco County) Hauer SSP2
- Today (2025)
- 1,030,936 people
- By 2030
- 1,110,409 · +7.7%
- By 2040
- 1,270,010 · +23.2%
- By 2050
- 1,435,001 · +39.2%
- By 2075
- 1,779,074 · +72.6%
- By 2100
- 1,966,767 · +90.8%
Race, ethnicity, and origin ACS 2023
- Neighborhood character
- Highly diverse neighborhood (Simpson 0.70)
- Race & ethnicity
- White 41% Hispanic / Latino 32% Asian 16% Two or more races 15% Black 4% Native American 1%
- Hispanic origin (detail)
- Mexican 16% Puerto Rican 1%
- Common ancestry
- Lithuanian 3% Italian 2% Romanian 2%
- Foreign-born
- 28% · Canada, China, Vietnam
- Languages at home
- 58% English-only · Spanish 27% Chinese 5% Other Indo-European 2%
Political lean MEDSL · San Francisco
- 2024 margin
- Solid D (+64.8) · D 80.3% · R 15.5% · Other 4.1%
- 2008→2024 swing
- -5.7pp toward R · 2008: 70.5pp · 2024: 64.8pp
- All cycles
- 2024: D+64.8 2020: D+72.5 2016: D+76.1 2012: D+70.2 2008: D+70.5
Not yet ingested
- Civics
- —
Market trends
- HPI YoY
- ▼ -1385.62%
- Current HPI
- 267.2424
- Rent YoY
- ▲ 14.54%
- Metro
- San Francisco-Oakland-Berkeley, CA
- State GDP YoY
- ▲ 3.21%
- F500 in state
- 116
Industry mix (Fortune 500 HQ in CA)
| Industry | F500 HQs | Revenue |
|---|---|---|
| Technology | 27 | $1,492B |
|
||
| Financial Services | 3 | $174B |
|
||
| Retail | 3 | $44B |
|
||
| Insurance | 3 | $26B |
|
||
| Media / Entertainment | 2 | $115B |
|
||
| Pharmaceuticals / Biotech | 2 | $62B |
|
||
Price history
-28.7% since first listed4 events — show timeline
- 2026-04-01 Listed $246,000 San Francisco MLS
- 2025-11-03 Relisted — San Francisco MLS
- 2025-08-28 Listed $344,000 San Francisco MLS
- 2024-05-06 Listed $345,000 San Francisco MLS
Cash-flow waterfall
monthlySold comps — $/sqft
last 12 mo · ≤1 miLoading sold comps…