4800 N 68th St #375 · Scottsdale, AZ
Flood risk 1/10 · Minimal
- FEMA flood zone
- X (unshaded)
- Chance of flooding over 30 yrs
- 0.0%
- Est. flood insurance / yr
- $507 – $1,088
Fire risk 4/10 · Minor
- Est. fire insurance / yr
- $610 – $1,132
Heat risk 8/10 · Major
- Hot days now (above 111°F)
- 5 days/yr
- Hot days in 30 yrs
- 14 days/yr
Wind risk 1/10 · Minimal
- Chance of severe wind over 30 yrs
- —
Air-quality risk 3/10 · Minor
- Unhealthy air days now
- 2 days/yr
- Unhealthy air days in 30 yrs
- 3 days/yr
Risk factors via First Street. Map © Google.
Why this score? — see what drove the D grade
The composite is a weighted blend of 9 inputs, each scored 0–100. Each bar is that input's sub-score; the figure is the points it added to the 100-point composite (weight × sub-score).
- Cash flow +10.1/30.0
- ARV discount +7.5/15.0
- 1% rule +6.6/10.0
- Schools +4.8/10.0
- Livability +4.0/5.0
- DSCR +2.9/10.0
- Condition / age +2.5/5.0
- Rent growth +2.1/5.0
- Appreciation +0.0/10.0
$298,000
🖨 Deal sheet (PDF) 📄 Offer letter ✓ Due diligence
Listing remarks MLS
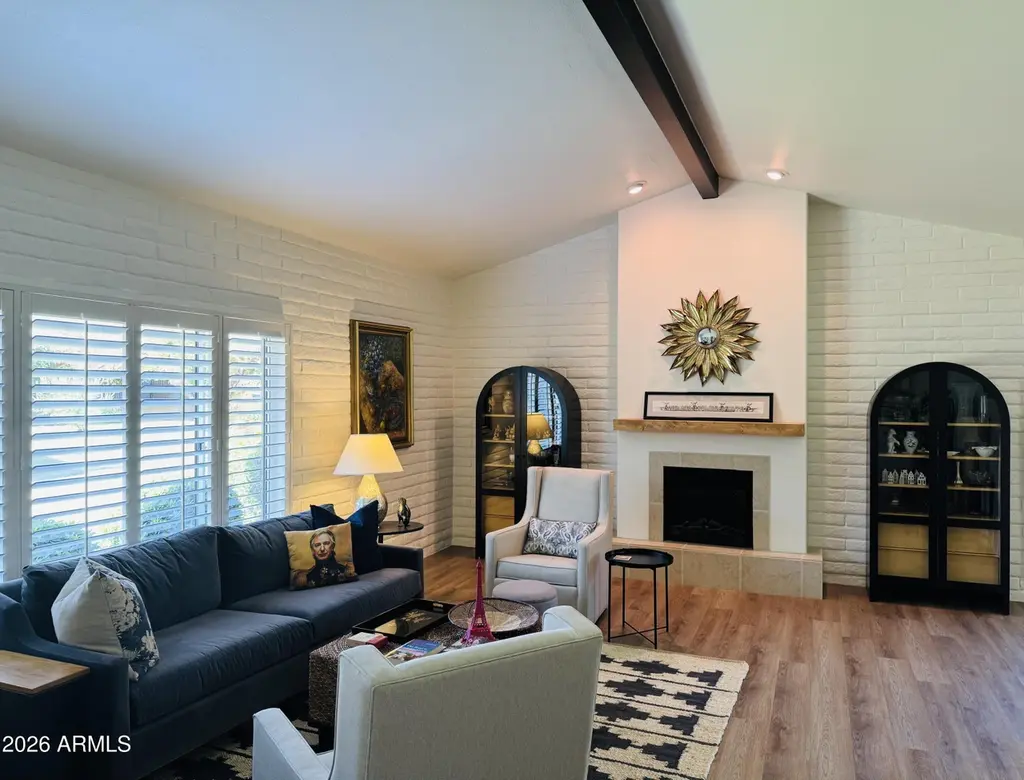
Lowest priced 2-bedroom 2-Bath unit in the whole community. Get more square footage at a great price! Clean, spacious, warm natural light & recently painted top to bottom, this home makes a perfect retreat for anyone! Enjoy the large living room with vaulted ceilings, large bedrooms w/ walk-in closets, bright kitchen with granite countertops, and the oversized patio that leads to the community pool & clubhouse. Resort-style living at its finest with amenities including a sparkling pool, fitness center, lush landscaped grounds, on-site dining & so much more. Located in the heart of Scottsdale, enjoy access to local shopping, dining, and entertainment. Don't miss your opportunity to make this home!
Key facts
- Move-in ready
- Covered parking
- Vaulted ceiling
Tags
Property features AI
Finance
- Other: Community amenities: pool, gated access, community media room, community laundry and coin-op laundry, biking/walking path, fitness center
- HOA & community: Monthly association fee (includes roof repair/replacement, insurance, sewer, pest control, grounds maintenance, street maintenance, front yard maintenance, trash, water, exterior maintenance); Land lease with a monthly fee
Exterior
- Parking: Covered parking (1 space); Detached carport (1 space); Gated parking; Assigned parking; Separate storage area; Permit required; Community parking structure
- Security: Gated community; Guarded entry
- Utilities: Private water company; Sewer connected
- Home design: Attached townhouse; Leasehold ownership
- Construction: Painted slump block construction; Tile and foam roof
- Exterior features: Heated community spa; Sprinklers front and rear; Grass in front and back; Block fencing
Interior
- Kitchen: Built-in microwave; Refrigerator; Dishwasher; Disposal
- Bedrooms: 2 bedrooms
- Flooring: Vinyl flooring
- Bathrooms: 2 full bathrooms
- Heating & cooling: Heat pump heating (electric); Central air conditioning; Ceiling fans; Programmable thermostat
- Interior features: High-speed internet; Furnished (see remarks); No interior steps; Vaulted ceilings; Full bathroom in primary bedroom; Dual-pane windows with vinyl frames; Living room fireplace
- Laundry & utility: Washer/dryer area inside unit
Neighborhood map
What this means for you Summary
Snapshot
- This is a 2-bed/2.0-bath townhouse listed at $298k.
Deal economics
- At list price, monthly cash flow is $-177 ($-2k/yr) — negative.
- To cash-flow at today's rent, offer at most $267k (10.5% below list).
- Meets the 1% rule at list price ($3k rent vs $298k).
- Recommended offer: $267k (10.5% below list) — sets the bar for cash-flow.
- Cap rate 5.6% vs local median 2.5% in Scottsdale — top-decile yield for the area; either an underpriced asset or a hidden risk that comps aren't pricing in. Stress-test before assuming the spread holds.
Location & tenants
- Location reads 80/100 on livability (#4 in AZ, #1,756 nationally) — a professional / high-income tenant draw. Strengths: amenities A+, commute A+, employment A+; Watch: health & safety C-, cost of living F.
- Scottsdale Unified District (4240) (urban): math 53% / reading 55% proficiency, ranked #30 of 249 in AZ (top 12%) — acceptable for families but not a draw, mixed tenant base, ~2y average lease.
- Zoned schools: Hopi Elementary School (math 77% / reading 78%, grade A, #21 of 1,109 statewide, top 2%, 676 students, 10% FRL); Ingleside Middle School (math 46% / reading 50%, grade C-, #35 of 218 statewide, top 16%, 777 students, 40% FRL); Arcadia High School (math 29% / reading 34%, grade F, #109 of 381 statewide, top 29%, 1,602 students, 30% FRL).
- Market conditions: Rents soft (-1.6%/yr); 582 active listings in the ZIP; 40 comparable units currently listed for rent nearby; rentals at typical pace (median 16d on market — plan ~3-4 weeks tenant-placement turnaround); solid renter incomes; 36,011 units permitted in Maricopa County in 2024 (12,801 in 5+ unit buildings).
- This rent runs 44% of the median local income ($93k/yr) — at the standard rent-burdened threshold; future hikes will face affordability resistance.
Forward outlook
- Local home prices are declining (-3.0%/yr); year-one equity from $2k of loan paydown is wiped out by about $9k of value loss. Plan a longer hold.
- Maricopa County population projected at +38% by 2050 — long-run rental-demand tailwind backs the buy-and-hold thesis.
Negotiation context
- Only 13 days on market — expect competitive offers; lowballing is unlikely to land.
- 15 sale attempts since 25y ago with the ask held roughly flat each time — persistent listings suggest the price (not the market) is what's stuck; bring a comps-based counter.
Risks & watch-outs
- Watch-outs: HOA is 33% of rent.
- Climate carrying-cost: extreme-heat days projected 5→14/yr by 2055 (HVAC capex compounding) — expect insurance premiums to compound above CPI over the hold.
Questions for the listing agent
- What do current leases actually rent for vs. the listed asking? Can we see a recent rent roll and the last 12 months of T-12 income?
- Built in 1969 — when were the roof, HVAC, electrical panel, plumbing, and water heater last replaced?
- What does the HOA fee cover, when was the last increase, and are there any pending special assessments or reserve-fund shortfalls?
- Is there a deadline driving the sale (1031 exchange, divorce, estate, relocation)? That informs how much negotiation room exists.
- Schools are A-rated — typically a magnet for longer-tenancy family renters. What's the average tenant stay here, and is there a school-zone premium baked into asking?
- The area grade is low — what's the realistic commute time and amenity access for the typical tenant pool here? Any planned neighborhood developments (good or bad) we should know about?
- What's the average days-on-market for RENTAL listings here right now (not sales)? A rising rental-DOM trend means longer vacancies and softer asking-rent achievability than the comps imply.
- What's the recent tenant-quality profile in this submarket — average credit score on applications, eviction rate, late-payment / NSF rate, and stable-employment percentage? A property-management company in the area should have these aggregated.
- How much new for-sale + rental construction is in the pipeline within 1–3 miles? Heavy new supply typically softens prices + rents 12–24 months out; constrained supply supports both.
Investment metrics
- 1% rule
- 1.16% ✓
- Cap rate
- 5.58%
- Cash-on-cash
- -2.54%
- DSCR
- 0.89
- GRM
- 7.2
CMA / ARV
- ARV (on-the-fly)
- $756,318
- Comps found
- 12
Show comp detail 12 sales within ~0.75 mi
| Address | Dist | Beds/Ba | Sqft | Sold | Price | $/sf | Match |
|---|---|---|---|---|---|---|---|
| 4800 N 68th St #285 | 0.14mi | 2/2.0 | 1,397 (-0%) | 1mo | $285,000 | $204 | 93 |
| 4800 N 68th St #248 | 0.15mi | 2/2.0 | 1,397 (-0%) | 1mo | $338,500 | $242 | 92 |
| 7157 E Rancho Vista Dr #2012 | 0.61mi | 2/2.0 | 1,425 (+2%) | 0mo | $720,000 | $505 | 68 |
| 7167 E Rancho Vista Dr #3002 | 0.63mi | 2/2.0 | 1,423 (+2%) | 1mo | $1,395,000 | $980 | 66 |
| 7157 E Rancho Vista Dr #2007 | 0.61mi | 2/2.0 | 1,425 (+2%) | 3mo | $895,000 | $628 | 66 |
| 7157 E Rancho Vista Dr #6004 | 0.61mi | 2/2.0 | 1,356 (-3%) | 2mo | $825,000 | $608 | 65 |
| 7157 E Rancho Vista Dr #3009 | 0.61mi | 2/2.0 | 1,346 (-4%) | 2mo | $800,000 | $594 | 63 |
| 7137 E Rancho Vista Dr #3005 | 0.55mi | 2/2.0 | 1,304 (-7%) | 3mo | $590,000 | $452 | 61 |
| 7167 E Rancho Vista Dr #2005 | 0.63mi | 2/2.0 | 1,304 (-7%) | 1mo | $770,000 | $590 | 58 |
| 7161 E Rancho Vista Dr #2002 | 0.63mi | 2/2.0 | 1,295 (-7%) | 2mo | $545,000 | $421 | 56 |
| 7161 E Rancho Vista Dr #6002 | 0.63mi | 2/2.0 | 1,295 (-7%) | 2mo | $700,000 | $541 | 56 |
| 7127 E Rancho Vista Dr #3009 | 0.51mi | 2/2.0 | 1,200 (-14%) | 2mo | $575,000 | $479 | 51 |
Match score weights: distance 35% · size 25% · config 20% · recency 20%. Top-matched comps best support the ARV.
Projected returns pro-forma
-3.0% appreciation · 0.0% rent growth · sell at horizon
- IRR
- -25.3%
- Equity multiple
- 0.17×
- Total profit
- $-69,054
- Equity at exit
- $44,433
- IRR
- -44.6%
- Equity multiple
- -0.33×
- Total profit
- $-111,299
- Equity at exit
- $25,766
Cash invested: $83,440 (down + closing). Projections, not guarantees.
Landlord ↔ Tenant lean methodology
- Overall (STATE)
- 87 Strongly Landlord-Friendly
- State Arizona
- 87 Strongly Landlord-Friendly · R+3
- County
- — inherits STATE
- City
- — inherits STATE
ZIP-level market 85251
- Rents YoY
- -1.6%
- Active inventory
- 582
- Price-to-rent
- 7.2×
Monthly cashflow live
- Estimated rent
- $3,443 high interval (Pro) →
- Mortgage (P&I)
- −$1,563
- Tax from tax record
- −$68 /mo · $820/yr
- Insurance
- −$124
- HOA
- −$1,141
- Vacancy / Maint / Mgmt
- −$723
- Net cashflow
- $-177
Break-even live
Sensitivity live
| Price | -10% $-8 | -5% $-92 | +0% $-177 | +5% $-261 | +10% $-345 |
|---|---|---|---|---|---|
| Rent | -10% $-448 | -5% $-313 | +0% $-177 | +5% $-41 | +10% $95 |
| Rate | -1.0pp $-26 | -0.5pp $-101 | base $-177 | +0.5pp $-254 | +1.0pp $-332 |
UW: 25.0% down · 7.5% · 30yr · 1.5% tax · 5.0% vac · 8.0% maint · 8.0% mgmt
Financing live
Cash to close
- Down payment
- $74,500
- Closing costs
- $8,940
- Reserves months
- —
- Total cash needed
- —
Loan-product check · same deal, 3 products live
Conventional
25% down · 7.5% · 30yr
- Down + closing
- —
- Monthly P&I
- —
- Monthly cashflow
- —
- DSCR
- —
- Eligible?
- —
Personal DTI + credit; lowest rate.
DSCR
20% down · 8.5% · 30yr
- Down + closing
- —
- Monthly P&I
- —
- Monthly cashflow
- —
- DSCR
- —
- Eligible?
- —
No personal income docs; deal must DSCR.
Hard money
10% down · 12.0% · 12mo
- Down + closing
- —
- Monthly P&I
- —
- Monthly cashflow
- —
- DSCR
- —
- Eligible?
- —
Short-term bridge; refi at stabilization.
Rent comps 40 comps
| Address | Beds | Baths | Sqft | Rent | $/sqft | DOM | Units | Dist |
|---|---|---|---|---|---|---|---|---|
| 4800 N 68th St Scottsdale, AZ | 1.0–2.0 | 1.0–2.0 | 1098 | $3,500 | $3.19 | 44d | 2 | 0.18mi |
| 4800 N 68th St Scottsdale, AZ | 1.0–2.0 | 1.0–2.0 | 1124 | $5,500 | $4.89 | 3d | 5 | 0.18mi |
| 4830 N 65th St Scottsdale, AZ | 2.0 | 2.0 | 1715 | $6,000 | $3.50 | 6d | 1 | 0.19mi |
| 5101 N Casa Blanca Dr #19 Paradise Valley, AZ | 2.0 | 2.5 | 1672 | $6,495 | $3.88 | 44d | 1 | 0.21mi |
| 4630 N 68th St Scottsdale, AZ | 1.0–2.0 | 1.0–2.0 | 861 | $3,200 | $3.72 | 14d | 5 | 0.23mi |
| 4630 N 68th St Scottsdale, AZ | 2.0 | 1.5–2.0 | 1003 | $2,500 | $2.49 | 15d | 5 | 0.23mi |
| 4630 N 68th St Scottsdale, AZ | 2.0 | 1.5–2.0 | 1003 | $2,525 | $2.52 | 15d | 4 | 0.23mi |
| 4630 N 68th St Scottsdale, AZ | 2.0 | 1.5 | 986 | $2,650 | $2.69 | 44d | 2 | 0.23mi |
| 4620 N 68th St Unit 1558641P Scottsdale, AZ | 2.0 | 1.5 | 968 | $2,323 | $2.40 | 14d | 1 | 0.26mi |
| 4620 N 68th St Unit 1558662P Scottsdale, AZ | 2.0 | 1.5 | 947 | $2,072 | $2.19 | 0d | 1 | 0.26mi |
| 4610 N 68th St Scottsdale, AZ | 2.0–3.0 | 1.5–2.0 | 1136 | $1,900 | $1.67 | 25d | 3 | 0.27mi |
| 4610 N 68th St Scottsdale, AZ | 2.0 | 1.5 | 986 | $4,118 | $4.18 | 3d | 2 | 0.27mi |
| 4701 N 68th St Scottsdale, AZ | 2.0 | 1.5–2.0 | 1079 | $3,000 | $2.78 | 18d | 5 | 0.31mi |
| 4701 N 68th St Scottsdale, AZ | 2.0 | 1.5–2.0 | 1079 | $3,000 | $2.78 | 25d | 4 | 0.31mi |
| 4525 N 66th St Scottsdale, AZ | 2.0 | 2.0 | 1410 | $4,998 | $3.54 | 0d | 2 | 0.31mi |
| 4525 N 66th St #38 Scottsdale, AZ | 2.0 | 2.0 | 1246 | $6,000 | $4.82 | 44d | 1 | 0.32mi |
| 4610 N 68th St Unit 1558642P Scottsdale, AZ | 2.0 | 2.0 | 1097 | $2,014 | $1.84 | 3d | 1 | 0.34mi |
| 4610 N 68th St #479 Scottsdale, AZ | 2.0 | 1.5 | 986 | $6,500 | $6.59 | 44d | 1 | 0.34mi |
| 4600 N 68th St Unit 1558658P Scottsdale, AZ | 2.0 | 1.5 | 979 | $2,044 | $2.09 | 13d | 1 | 0.35mi |
| 4600 N 68th St Unit 1558683P Scottsdale, AZ | 2.0 | 1.5 | 979 | $1,997 | $2.04 | 6d | 1 | 0.35mi |
| 4600 N 68th St Scottsdale, AZ | 1.0–2.0 | 1.0–1.5 | 844 | $6,000 | $7.11 | 11d | 3 | 0.35mi |
| 4600 N 68th St Scottsdale, AZ | 1.0–2.0 | 1.0–1.5 | 844 | $6,000 | $7.11 | 25d | 4 | 0.35mi |
| 4600 N 68th St Scottsdale, AZ | 1.0–2.0 | 1.0–1.5 | 843 | $6,000 | $7.11 | 44d | 4 | 0.35mi |
| 4848 N Goldwater Blvd Scottsdale, AZ | 1.0–2.0 | 1.0–2.0 | 916 | $2,829 | $3.09 | 0d | 37 | 0.50mi |
| 7117 E Rancho Vista Dr #2004 Scottsdale, AZ | 2.0 | 2.0 | 1066 | $3,699 | $3.47 | 44d | 1 | 0.50mi |
| 7117 E Rancho Vista Dr #3003 Scottsdale, AZ | 1.0 | 1.0 | 889 | $2,695 | $3.03 | 19d | 1 | 0.50mi |
| 7117 E Rancho Vista Dr #5007 Scottsdale, AZ | 2.0 | 2.0 | 1310 | $3,600 | $2.75 | 20d | 1 | 0.50mi |
| 7117 E Rancho Vista Dr #2002 Scottsdale, AZ | 2.0 | 2.0 | 1559 | $4,500 | $2.89 | 44d | 1 | 0.50mi |
| 7121 E Rancho Vista Dr #2001 Scottsdale, AZ | 2.0 | 2.0 | 1327 | $3,800 | $2.86 | 5d | 1 | 0.52mi |
| 7121 E Rancho Vista Dr #5011 Scottsdale, AZ | 3.0 | 2.0 | 1826 | $5,950 | $3.26 | 5d | 1 | 0.52mi |
| 7121 E Rancho Vista Dr #2009 Scottsdale, AZ | 1.0 | 1.5 | 956 | $1,900 | $1.99 | 19d | 1 | 0.52mi |
| 7121 E Rancho Vista Dr #5011 Scottsdale, AZ | 3.0 | 2.0 | 1826 | $5,950 | $3.26 | 4d | 1 | 0.52mi |
| 7121 E Rancho Vista Dr Scottsdale, AZ | 2.0 | 1.0 | 1408 | $4,700 | $3.34 | 44d | 1 | 0.52mi |
| 7121 E Rancho Vista Dr Scottsdale, AZ | 2.0 | 2.0 | 1329 | $3,495 | $2.63 | 8d | 1 | 0.52mi |
| 7127 E Rancho Vista Dr #2001 Scottsdale, AZ | 3.0 | 2.0 | 1781 | $5,000 | $2.81 | 44d | 1 | 0.53mi |
| 7127 E Rancho Vista Dr #5001 Scottsdale, AZ | 2.0 | 2.0 | 1781 | $5,500 | $3.09 | 44d | 1 | 0.53mi |
| 7131 E Rancho Vista Dr #6010 Scottsdale, AZ | 2.0 | 2.0 | 1310 | $5,900 | $4.50 | 44d | 1 | 0.54mi |
| 7131 E Rancho Vista Dr #6001 Scottsdale, AZ | 2.0 | 2.0 | 1327 | $2,995 | $2.26 | 4d | 1 | 0.54mi |
| 7131 E Rancho Vista Dr #6001 Scottsdale, AZ | 2.0 | 2.0 | 1327 | $2,995 | $2.26 | 5d | 1 | 0.54mi |
| 7131 E Rancho Vista Dr #4005 Scottsdale, AZ | 2.0 | 2.0 | 1327 | $3,895 | $2.94 | 8d | 1 | 0.54mi |
HOA detail
- Monthly dues
- $1,141 · $13,692/yr
- Likely covers
- landscapingpoolgym
Listing history 9 events
-
2026-06-13statusdays on market $298,000 Pending 13 DOM
-
2026-06-09days on market $298,000 Under Contract Accepting Backups 11 DOM
-
2026-06-08days on market $298,000 Under Contract Accepting Backups 10 DOM
-
2026-06-07days on market $298,000 Under Contract Accepting Backups 9 DOM
-
2026-06-04days on market $298,000 Under Contract Accepting Backups 6 DOM
-
2026-06-03days on market $298,000 Under Contract Accepting Backups 5 DOM
-
2026-06-02statusdays on market $298,000 Under Contract Accepting Backups 4 DOM
-
2026-06-01days on market $298,000 Active 3 DOM
-
2026-05-31days on market $298,000 Active 2 DOM
ⓘ Source: listings_history table (triggers on properties + properties_extension) + one-shot
backfill from property_details.listing_events for pre-trigger history.
Tax reassessment forecast AZ · Resets to sale price
- Current annual tax
- $820 · $68/mo
- Projected year-2 tax
- $1,967 · $164/mo
- Expected delta
- +$1,147/yr (+$96/mo · 139.8%)
ⓘ Screening estimate from a state-policy table — verify with the county assessor before closing.
Climate risk First Street
- Flood 1/10 Low FEMA zone X (unshaded) · 0% chance over 30 yrs
- Wildfire 4/10 Moderate
- Heat 8/10 Severe 5 d/yr ≥111°F today · 14 d/yr by 30 yrs out
- Wind 1/10 Low
- Air quality 3/10 Moderate 2 unhealthy d/yr today · 3 by 30 yrs out
Nearby sold comps map
Loading sold comps map…
Walkable amenities ~0.75 mi
Loading nearby amenities…
Taxation est. · year 1
- Rental income
- $41,312
- − Mortgage interest
- −$16,693
- − Property taxes
- −$820
- − Insurance
- −$1,490
- − Repairs & maintenance
- −$3,305
- − Management
- −$3,305
- − HOA
- −$13,692
- − Depreciation
- −$8,669
- Taxable loss
- −$6,661
- Est. tax savings @ 24.0%
- +$1,599
- After-tax cash flow
- $-519/yr
For passive investors: Depreciation is non-cash, so a rental often shows a tax loss while cash-flowing — sheltering income. Rental losses are passive: they offset passive income freely, and up to $25,000/yr can offset ordinary (W-2) income if you actively participate and your MAGI is under $100k (phasing out to $0 by $150k); unused losses carry forward. On sale, claimed depreciation is recaptured at up to 25%, and gains may owe capital-gains tax (a 1031 exchange can defer both). Figures are a year-1 estimate at your 24.0% rate — not tax advice; consult a CPA.
Schools (NCES district)
- District
- Scottsdale Unified District (4240)
- NCES district ID
- 0407570
- Math proficiency
- 53% ▼ -10.00%
- Reading proficiency
- 55% ▼ -8.00%
- Median HH income
- $70,139
- Composite
- 48.02/100
- National rank
- #2196
- State rank
- #30 of 249 in AZ
Livability — Scottsdale
- Score
- 80/100
- State rank
- #4
- US rank
- #1756
Category grades
Schools grade is shown separately in the Schools card above.
Census & demographics
- Census place
- Scottsdale, AZ
- County
- Maricopa County · 4,537,380 people
- City population
- 290,846
- Metro
- Phoenix-Mesa-Chandler, AZ
- Population (ZIP)
- 40,780
- Household income
- $92,851
- Rent vs Own
- Severe rent burden
- 2259.0
Population outlook (Maricopa County) Hauer SSP2
- Today (2025)
- 4,979,203 people
- By 2030
- 5,378,229 · +8.0%
- By 2040
- 6,156,598 · +23.6%
- By 2050
- 6,872,376 · +38.0%
- By 2075
- 8,401,270 · +68.7%
- By 2100
- 9,247,439 · +85.7%
Race, ethnicity, and origin ACS 2023
- Neighborhood character
- Predominantly White (77%)
- Race & ethnicity
- White 77% Hispanic / Latino 14% Two or more races 10% Asian 2% Black 2%
- Hispanic origin (detail)
- Mexican 11%
- Common ancestry
- Italian 5% Romanian 3% Portuguese 3%
- Foreign-born
- 9% · Canada
- Languages at home
- 88% English-only · Spanish 7% Other Indo-European 2% French/Haitian/Cajun 1%
Political lean MEDSL · Maricopa
- 2024 margin
- Toss-up / Even · D 47.7% · R 51.2% · Other 1.1%
- 2008→2024 swing
- +7.1pp toward D · 2008: -10.6pp · 2024: -3.5pp
- All cycles
- 2024: R+3.5 2020: D+2.2 2016: R+3.5 2012: R+12.0 2008: R+10.6
Not yet ingested
- Civics
- —
Market trends
- HPI YoY
- ▼ -672.80%
- Current HPI
- 372.433
- Rent YoY
- ▼ -1.58%
- Metro
- Phoenix-Mesa-Chandler, AZ
- State GDP YoY
- ▲ 4.54%
- F500 in state
- 20
Industry mix (Fortune 500 HQ in AZ)
| Industry | F500 HQs | Revenue |
|---|---|---|
| Technology | 2 | $13B |
|
||
| Mining / Metals | 1 | $23B |
|
||
| Environmental Services | 1 | $16B |
|
||
| Metals / Steel | 1 | $14B |
|
||
| Technology Distribution | 1 | $9B |
|
||
| Homebuilding | 1 | $8B |
|
||
Price history
+441.8% since first listed55 events — show timeline
- 2026-05-29 Listed $298,000 ARMLS
- 2025-02-03 Sold (Public Records) $307,000 Public Records
- 2025-02-03 Sold (MLS) $307,000 ARMLS
- 2025-01-17 Contingent — ARMLS
- 2025-01-04 Price Changed $312,500 ARMLS
- 2024-12-14 Price Changed $315,500 ARMLS
- 2024-11-29 Price Changed $316,500 ARMLS
- 2024-11-15 Price Changed $317,500 ARMLS
- 2024-10-19 Price Changed $319,000 ARMLS
- 2024-09-07 Price Changed $325,000 ARMLS
- 2024-06-14 Price Changed $339,000 ARMLS
- 2024-05-17 Listed $349,900 ARMLS
- 2020-06-30 Sold (Public Records) $185,000 Public Records
- 2020-06-30 Sold (MLS) $185,000 ARMLS
- 2020-06-01 Contingent — ARMLS
- 2020-05-20 Price Changed $187,000 ARMLS
- 2020-05-04 Price Changed $199,900 ARMLS
- 2020-04-23 Listed $219,500 ARMLS
- 2018-01-16 Sold (Public Records) $169,000 Public Records
- 2018-01-05 Sold (MLS) $169,000 ARMLS
- 2018-01-02 Pending — ARMLS
- 2017-11-29 Price Changed $169,000 ARMLS
- 2017-10-27 Listed $185,000 ARMLS
- 2017-08-08 Listing Removed — ARMLS
- 2017-03-19 Listed $179,000 ARMLS
- 2016-11-09 Listing Removed — ARMLS
- 2016-08-01 Price Changed $179,000 ARMLS
- 2016-05-14 Listed $189,000 ARMLS
- 2015-05-01 Sold (Public Records) $158,000 Public Records
- 2015-05-01 Sold (MLS) $158,000 ARMLS
- 2015-04-05 Contingent — ARMLS
- 2015-03-26 Listed $165,000 ARMLS
- 2011-06-30 Sold (MLS) $52,000 ARMLS
- 2011-06-03 Pending — ARMLS
- 2011-03-15 Contingent — ARMLS
- 2011-03-09 Listed $60,000 ARMLS
- 2007-08-15 Sold (Public Records) $180,000 Public Records
- 2007-08-15 Sold (MLS) $180,000 ARMLS
- 2007-07-11 Listing Removed — ARMLS
- 2007-04-13 Listed $189,000 ARMLS
- 2004-11-15 Sold (Public Records) $100,000 Public Records
- 2004-11-15 Sold (MLS) $100,000 ARMLS
- 2004-10-12 Listing Removed — ARMLS
- 2004-03-19 Listed $105,000 ARMLS
- 2004-03-08 Listing Removed — ARMLS
- 2003-11-15 Listed $110,000 ARMLS
- 2003-10-06 Listing Removed — ARMLS
- 2003-01-22 Listed $95,000 ARMLS
- 2003-01-19 Listing Removed — ARMLS
- 2002-06-19 Listed $103,000 ARMLS
- 2001-12-25 Listing Removed — ARMLS
- 2001-12-17 Listed $103,000 ARMLS
- 2001-12-11 Listing Removed — ARMLS
- 2001-06-11 Listed $110,000 ARMLS
- 1996-07-18 Sold (Public Records) $55,000 Public Records
Property tax history
+0.0%/yrLatest (2025): $820 · +4.2% YoY. Source: county tax records.
Cash-flow waterfall
monthlySold comps — $/sqft
last 12 mo · ≤1 miLoading sold comps…