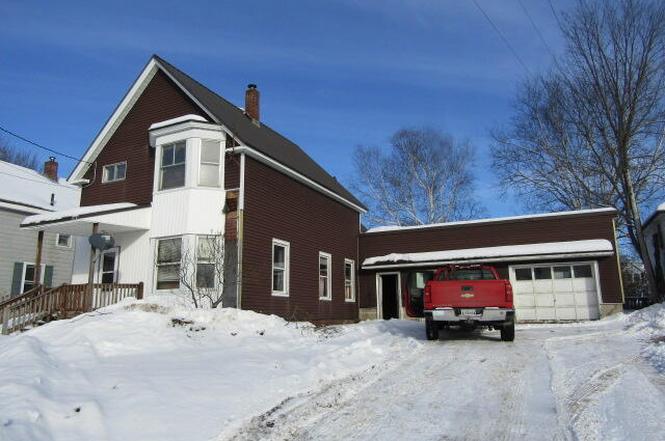
13 Otis St · Livermore Falls, ME
Flood risk 1/10 · Minimal
- FEMA flood zone
- X (unshaded)
- Chance of flooding over 30 yrs
- 0.0%
- Est. flood insurance / yr
- $473 – $860
Fire risk 1/10 · Minimal
- Est. fire insurance / yr
- $669 – $1,243
Heat risk 3/10 · Minor
- Hot days now (above 91°F)
- 8 days/yr
- Hot days in 30 yrs
- 18 days/yr
Wind risk 4/10 · Minor
- Chance of severe wind over 30 yrs
- 11.0%
Air-quality risk 2/10 · Minimal
- Unhealthy air days now
- 1 days/yr
- Unhealthy air days in 30 yrs
- 1 days/yr
Risk factors via First Street. Map © Google.
Why this score? — see what drove the B+ grade
The composite is a weighted blend of 9 inputs, each scored 0–100. Each bar is that input's sub-score; the figure is the points it added to the 100-point composite (weight × sub-score).
- Cash flow +30.0/30.0
- 1% rule +10.0/10.0
- DSCR +10.0/10.0
- ARV discount +7.5/15.0
- Appreciation +6.9/10.0
- Schools +6.5/10.0
- Livability +3.4/5.0
- Rent growth +2.5/5.0
- Condition / age +2.5/5.0
$52,500
🖨 Deal sheet (PDF) 📄 Offer letter ✓ Due diligence
Listing remarks
4 bed 2 bath home in mature neighborhood that needs your TLC- attached 2 car garage- short sale subject to lien holder approval cash only.
Key facts
- 6,534 sq ft lot
- 2 garage spots
- Built 1910
Neighborhood map
What this means for you Summary
Snapshot
- This is a 4-bed/2.0-bath single-family listed at $52k.
Deal economics
- At list price, monthly cash flow is $535 ($6k/yr) — positive.
- The deal already cash-flows at list — no discount required.
- Meets the 1% rule at list price ($1k rent vs $52k).
- Recommended offer: $49k (6.0% below list) — sets the bar for market timing.
- Cap rate 18.5% vs local median 3.7% in Livermore Falls — top-decile yield for the area; either an underpriced asset or a hidden risk that comps aren't pricing in. Stress-test before assuming the spread holds.
Location & tenants
- Location reads 67/100 on livability (#95 in ME) — a middle-class / working-renter tenant base. Strengths: cost of living A+, housing A+, health & safety A+; Watch: amenities F, commute F, employment F.
- RSU 73 (rural): math 75% / reading 81% proficiency, ranked #91 of 112 in ME (top 81%) — strong family-tenant draw, lease renewals of 3-5y typical.
- Zoned schools: Spruce Mountain Middle School (math 83% / reading 83%, grade A+, #47 of 85 statewide, top 58%, 358 students, 58% FRL); Spruce Mountain High School (math 84% / reading 95%, grade A+, #49 of 108 statewide, top 50%, 408 students, 43% FRL) — zoned schools at 51% FRL track the district average.
- Market conditions: 35 active listings in the ZIP; 358 units permitted in Androscoggin County in 2024 (57 in 5+ unit buildings).
Forward outlook
- In year one you build about $2k of equity ($363 loan paydown + $2k appreciation (3.9% local appreciation)).
- Androscoggin County population projected at -19% by 2050 — secular population decline; favor cash flow + early exit over multi-decade hold.
- At projected returns (3.9% appreciation + 3.0% rent growth), your $15k cash investment doubles in ~2 years — after that, you're playing with house money.
Negotiation context
- It's been on market 61 days — a 6% lower offer ($49k) is reasonable based on typical stale-listing flexibility.
Risks & watch-outs
- Watch-outs: property tax is 4.8% of price; built in 1910 — expect roof / HVAC / electrical / plumbing capex.
Questions for the listing agent
- It's been on market 61 days. Have you received any prior offers? Is the seller open to a 6% concession, seller financing, or rate buy-down credit?
- Built in 1910 — when were the roof, HVAC, electrical panel, plumbing, and water heater last replaced?
- Property tax is high relative to price — has the assessment been appealed recently, and will the sale trigger a re-assessment?
- Why hasn't it sold? Are there any deal-killer items the seller is aware of (foundation, flood, title, zoning, code violations)?
- Is there a deadline driving the sale (1031 exchange, divorce, estate, relocation)? That informs how much negotiation room exists.
- Schools are F-rated, which usually means shorter tenancies and higher turnover. Who's the typical renter profile here, and what's been the actual vacancy rate?
- What's the average days-on-market for RENTAL listings here right now (not sales)? A rising rental-DOM trend means longer vacancies and softer asking-rent achievability than the comps imply.
- What's the recent tenant-quality profile in this submarket — average credit score on applications, eviction rate, late-payment / NSF rate, and stable-employment percentage? A property-management company in the area should have these aggregated.
- How much new for-sale + rental construction is in the pipeline within 1–3 miles? Heavy new supply typically softens prices + rents 12–24 months out; constrained supply supports both.
Investment metrics
- 1% rule
- 2.51% ✓
- Cap rate
- 18.51%
- Cash-on-cash
- 43.64%
- DSCR
- 2.94
- GRM
- 3.3
CMA / ARV
- ARV (on-the-fly)
- $239,400
- Comps found
- 10
Show comp detail 10 sales within ~0.75 mi
| Address | Dist | Beds/Ba | Sqft | Sold | Price | $/sf | Match |
|---|---|---|---|---|---|---|---|
| 9 Otis St | 0.02mi | 3/2.0 (-1) | 2,214 (+5%) | 23mo | $159,900 | $72 | 65 |
| 28 Searles St | 0.21mi | 4/2.0 | 1,800 (-14%) | 2mo | $245,000 | $136 | 65 |
| 29 Jewell St | 0.27mi | 4/2.5 | 2,368 (+13%) | 1mo | $350,000 | $148 | 63 |
| 7 High St | 0.47mi | 3/2.0 (-1) | 2,086 (-1%) | 20mo | $162,500 | $78 | 56 |
| 20 Church St | 0.17mi | 4/1.0 | 1,804 (-14%) | 18mo | $65,000 | $36 | 50 |
| 5 Pine Ave | 0.55mi | 4/1.5 | 1,972 (-6%) | 18mo | $225,000 | $114 | 47 |
| 52 Jewell St | 0.31mi | 4/1.0 | 2,412 (+15%) | 14mo | $255,000 | $106 | 45 |
| 7 Maple St | 0.38mi | 3/1.5 (-1) | 1,904 (-9%) | 20mo | $200,000 | $105 | 43 |
| 23 Belleview Dr | 0.63mi | 3/2.0 (-1) | 1,960 (-7%) | 19mo | $290,000 | $148 | 38 |
| 24 Spring St | 0.49mi | 3/2.0 (-1) | 1,786 (-15%) | 22mo | $280,000 | $157 | 29 |
Match score weights: distance 35% · size 25% · config 20% · recency 20%. Top-matched comps best support the ARV.
Projected returns pro-forma
3.85% appreciation · 3.0% rent growth · sell at horizon
- IRR
- 50.2%
- Equity multiple
- 3.92×
- Total profit
- $42,866
- Equity at exit
- $26,146
- IRR
- 49.1%
- Equity multiple
- 7.95×
- Total profit
- $102,191
- Equity at exit
- $42,392
Cash invested: $14,700 (down + closing). Projections, not guarantees.
Landlord ↔ Tenant lean methodology
- Overall (STATE)
- 41 Moderately Tenant-Leaning
- State Maine
- 41 Moderately Tenant-Leaning · D+2
- County
- — inherits STATE
- City
- — inherits STATE
ZIP-level market 04254
- Home prices YoY
- 1.2%
- Active inventory
- 35
- Price-to-rent
- 3.3×
Monthly cashflow live
- Estimated rent
- $1,316 medium interval (Pro) →
- Mortgage (P&I)
- −$275
- Tax from tax record
- −$208 /mo · $2,494/yr
- Insurance
- −$22
- HOA
- −$0
- Vacancy / Maint / Mgmt
- −$276
- Net cashflow
- $535
Break-even live
Sensitivity live
| Price | -10% $713 | -5% $695 | +0% $535 | +5% $520 | +10% $505 |
|---|---|---|---|---|---|
| Rent | -10% $431 | -5% $483 | +0% $535 | +5% $587 | +10% $639 |
| Rate | -1.0pp $561 | -0.5pp $548 | base $535 | +0.5pp $521 | +1.0pp $507 |
UW: 25.0% down · 7.5% · 30yr · 1.5% tax · 5.0% vac · 8.0% maint · 8.0% mgmt
Financing live
Cash to close
- Down payment
- $13,125
- Closing costs
- $1,575
- Reserves months
- —
- Total cash needed
- —
Loan-product check · same deal, 3 products live
Conventional
25% down · 7.5% · 30yr
- Down + closing
- —
- Monthly P&I
- —
- Monthly cashflow
- —
- DSCR
- —
- Eligible?
- —
Personal DTI + credit; lowest rate.
DSCR
20% down · 8.5% · 30yr
- Down + closing
- —
- Monthly P&I
- —
- Monthly cashflow
- —
- DSCR
- —
- Eligible?
- —
No personal income docs; deal must DSCR.
Hard money
10% down · 12.0% · 12mo
- Down + closing
- —
- Monthly P&I
- —
- Monthly cashflow
- —
- DSCR
- —
- Eligible?
- —
Short-term bridge; refi at stabilization.
Listing history 5 events
-
2026-03-09status Pending
-
2026-03-03price $52,500
-
2026-02-09price $55,000
-
2026-01-19price $60,000
-
2026-01-07$70,000 Active
ⓘ Source: listings_history table (triggers on properties + properties_extension) + one-shot
backfill from property_details.listing_events for pre-trigger history.
Tax reassessment forecast ME · Partial reset (capped growth)
- Current annual tax
- $2,494 · $208/mo
- Projected year-2 tax
- $2,494 · $208/mo
- Expected delta
- $0/yr ($0/mo · 0.0%)
ⓘ Screening estimate from a state-policy table — verify with the county assessor before closing.
Climate risk First Street
- Flood 1/10 Low FEMA zone X (unshaded) · 0% chance over 30 yrs
- Wildfire 1/10 Low
- Heat 3/10 Moderate 8 d/yr ≥91°F today · 18 d/yr by 30 yrs out
- Wind 4/10 Moderate 11% chance of damaging wind over 30 yrs
- Air quality 2/10 Low 1 unhealthy d/yr today · 1 by 30 yrs out
Nearby sold comps map
Loading sold comps map…
Walkable amenities ~0.75 mi
Loading nearby amenities…
Taxation est. · year 1
- Rental income
- $15,791
- − Mortgage interest
- −$2,941
- − Property taxes
- −$2,494
- − Insurance
- −$262
- − Repairs & maintenance
- −$1,263
- − Management
- −$1,263
- − Depreciation
- −$1,527
- Taxable income
- $6,040
- Est. tax owed @ 24.0%
- −$1,450
- After-tax cash flow
- $4,965/yr
For passive investors: Depreciation is non-cash, so a rental often shows a tax loss while cash-flowing — sheltering income. Rental losses are passive: they offset passive income freely, and up to $25,000/yr can offset ordinary (W-2) income if you actively participate and your MAGI is under $100k (phasing out to $0 by $150k); unused losses carry forward. On sale, claimed depreciation is recaptured at up to 25%, and gains may owe capital-gains tax (a 1031 exchange can defer both). Figures are a year-1 estimate at your 24.0% rate — not tax advice; consult a CPA.
Schools (NCES district)
- District
- RSU 73
- NCES district ID
- 2314805
- Math proficiency
- 75% ▲ 50.00%
- Reading proficiency
- 81% ▲ 38.00%
- Median HH income
- $44,547
- Composite
- 65.46/100
- National rank
- #477
- State rank
- #91 of 112 in ME
Livability — Livermore Falls
- Score
- 67/100
- State rank
- #95
- US rank
- #10818
Category grades
Schools grade is shown separately in the Schools card above.
Census & demographics
- Census place
- Livermore Falls, ME
- Population (ZIP)
- 3,076
Population outlook (Androscoggin County) Hauer SSP2
- Today (2025)
- 103,965 people
- By 2030
- 101,004 · -2.8%
- By 2040
- 93,218 · -10.3%
- By 2050
- 84,222 · -19.0%
- By 2075
- 63,391 · -39.0%
- By 2100
- 43,273 · -58.4%
Race, ethnicity, and origin ACS 2023
- Neighborhood character
- Predominantly White (97%)
- Race & ethnicity
- White 97% Two or more races 2%
- Common ancestry
- Lithuanian 18% German 2% Scotch-Irish 1%
- Foreign-born
- 1% · Canada
- Languages at home
- 96% English-only · French/Haitian/Cajun 3% Other Indo-European 1%
Political lean MEDSL · Androscoggin
- 2024 margin
- Lean R (+6.1) · D 45.9% · R 52.0% · Other 2.1%
- 2008→2024 swing
- -21.3pp toward R · 2008: 15.2pp · 2024: -6.1pp
- All cycles
- 2024: R+6.1 2020: R+2.8 2016: R+9.4 2012: D+12.8 2008: D+15.2
Not yet ingested
- Civics
- —
Market trends
- HPI YoY
- ▲ 3.85%
- Current HPI
- 330.6379
- Rent YoY
- —
- Metro
- —
- State GDP YoY
- —
- F500 in state
- 0
Price history
-25.0% since first listed5 events — show timeline
- 2026-03-09 Pending — MREIS
- 2026-03-03 Price Changed $52,500 MREIS
- 2026-02-09 Price Changed $55,000 MREIS
- 2026-01-19 Price Changed $60,000 MREIS
- 2026-01-07 Listed $70,000 MREIS
Property tax history
+2.4%/yrLatest (2025): $2,494 · +5.9% YoY. Source: county tax records.
Cash-flow waterfall
monthlySold comps — $/sqft
last 12 mo · ≤1 miLoading sold comps…