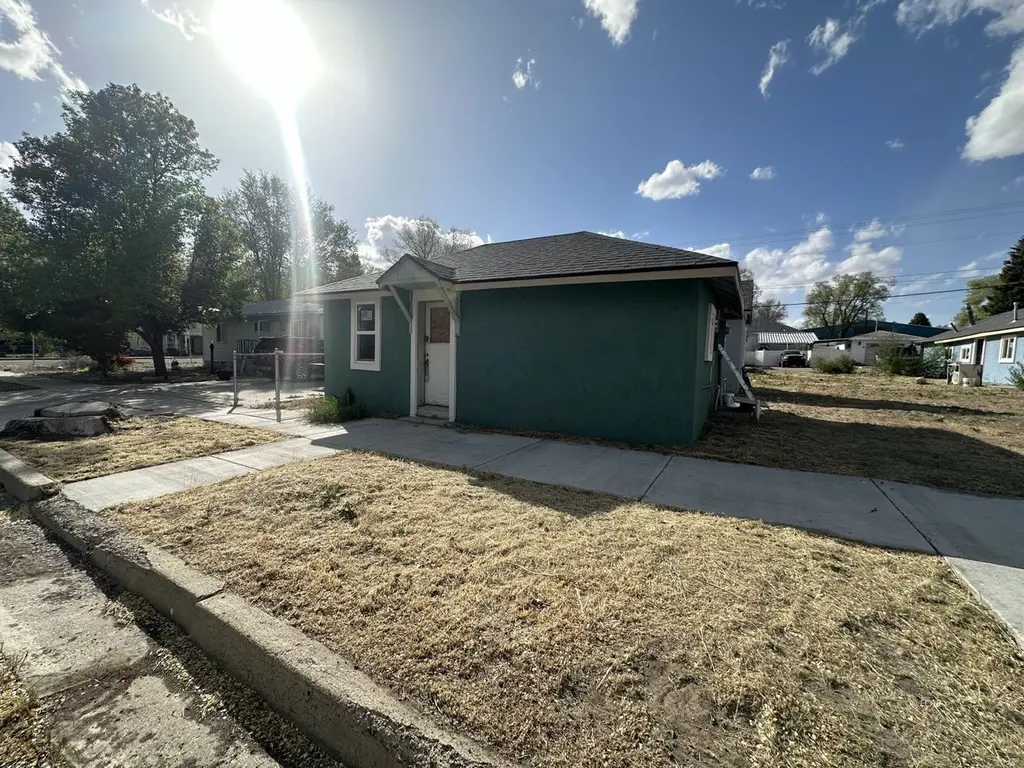
710 Cedar St · Carlin, NV
Flood risk 1/10 · Minimal
- FEMA flood zone
- X (unshaded)
- Chance of flooding over 30 yrs
- 0.0%
- Est. flood insurance / yr
- $507 – $1,088
Fire risk 9/10 · Severe
- Est. fire insurance / yr
- $490 – $910
Heat risk 4/10 · Minor
- Hot days now (above 93°F)
- 6 days/yr
- Hot days in 30 yrs
- 16 days/yr
Wind risk 1/10 · Minimal
- Chance of severe wind over 30 yrs
- —
Air-quality risk 4/10 · Minor
- Unhealthy air days now
- 4 days/yr
- Unhealthy air days in 30 yrs
- 5 days/yr
Risk factors via First Street. Map © Google.
Why this score? — see what drove the C grade
The composite is a weighted blend of 9 inputs, each scored 0–100. Each bar is that input's sub-score; the figure is the points it added to the 100-point composite (weight × sub-score).
- Cash flow +17.1/30.0
- ARV discount +15.0/15.0
- Appreciation +6.9/10.0
- DSCR +5.3/10.0
- Livability +3.8/5.0
- 1% rule +3.6/10.0
- Schools +2.8/10.0
- Rent growth +2.5/5.0
- Condition / age +2.5/5.0
$200,000
🖨 Deal sheet (PDF) 📄 Offer letter ✓ Due diligence
Listing remarks MLS
Great investment opportunity. Extra material for the project will stay at no additional cost to the buyer. All electric. There is currently a gas line pulled but you will have to contact Southwest Gas. All the homes have a new roof and new stucco (Permits pulled). A new sidewalk was also reconstructed on the front of the property. Every unit has its own new electrical meter that was installed by Wells Rural Electric. The first home is 95% complete. Buyer to do their own due diligence. RV Pad is available towards the end of the property. The owner of the property is the listing agent.
Key facts
- New stucco
- New electrical meter
- Rv pad
Tags
Neighborhood map
What this means for you Summary
Snapshot
- This is a 4-bed/4.0-bath other listed at $200k.
Deal economics
- At list price, monthly cash flow is $140 ($2k/yr) — positive.
- The deal already cash-flows at list — no discount required.
- To meet the 1% rule (rent ≥ 1% of price), the offer needs to be $172k (14.1% below list).
- Recommended offer: $172k (14.1% below list) — sets the bar for 1% rule.
Location & tenants
- Location reads 76/100 on livability (#7 in NV, #3,297 nationally) — a middle-class / working-renter tenant base. Strengths: crime A+, cost of living A+, housing A+; Watch: health & safety C-, schools D, amenities F.
- Elko County School District (town): math 22% / reading 38% proficiency, ranked #9 of 17 in NV (top 53%) — families likely to look elsewhere, expect single-tenant / working-renter base with shorter leases.
- Market conditions: 11 active listings in the ZIP; 120 units permitted in Elko County in 2024 (0 in 5+ unit buildings).
Forward outlook
- In year one you build about $9k of equity ($1k loan paydown + $8k appreciation (3.8% local appreciation)).
- Elko County population projected at +18% by 2050 — long-run rental-demand tailwind backs the buy-and-hold thesis.
- At projected returns (3.8% appreciation + 3.0% rent growth), your $56k cash investment doubles in ~5 years — after that, you're playing with house money.
- By year 4, paydown + projected appreciation supports a ~$30k cash-out refi (75% LTV) — recoverable capital for the next deal without selling this one.
Negotiation context
- It's been on market 410 days — a 12% lower offer ($176k) is reasonable based on typical stale-listing flexibility.
- 5 sale attempts since 6y ago with the ask held roughly flat each time — persistent listings suggest the price (not the market) is what's stuck; bring a comps-based counter.
- Current owner paid $55k; list at $200k implies a 264% gain — meaningful room to come down on a strong offer.
Risks & watch-outs
- Watch-outs: built in 1914 — expect roof / HVAC / electrical / plumbing capex.
- Climate carrying-cost: severe wildfire risk — expect insurance premiums to compound above CPI over the hold.
Questions for the listing agent
- It's been on market 410 days. Have you received any prior offers? Is the seller open to a 14% concession, seller financing, or rate buy-down credit?
- Built in 1914 — when were the roof, HVAC, electrical panel, plumbing, and water heater last replaced?
- Why hasn't it sold? Are there any deal-killer items the seller is aware of (foundation, flood, title, zoning, code violations)?
- Is there a deadline driving the sale (1031 exchange, divorce, estate, relocation)? That informs how much negotiation room exists.
- Schools are D-rated, which usually means shorter tenancies and higher turnover. Who's the typical renter profile here, and what's been the actual vacancy rate?
- What's the average days-on-market for RENTAL listings here right now (not sales)? A rising rental-DOM trend means longer vacancies and softer asking-rent achievability than the comps imply.
- What's the recent tenant-quality profile in this submarket — average credit score on applications, eviction rate, late-payment / NSF rate, and stable-employment percentage? A property-management company in the area should have these aggregated.
- How much new for-sale + rental construction is in the pipeline within 1–3 miles? Heavy new supply typically softens prices + rents 12–24 months out; constrained supply supports both.
Investment metrics
- 1% rule
- 0.86% ✗
- Cap rate
- 7.13%
- Cash-on-cash
- 3.00%
- DSCR
- 1.13
- GRM
- 9.7
CMA / ARV
- ARV (median comp)
- $258,785
- List price
- $200,000
- Delta
- -22.72%
- Verdict
- UNDERPRICED
- Comps
- 1 within 2.0 mi
Projected returns pro-forma
3.77% appreciation · 3.0% rent growth · sell at horizon
- IRR
- 12.3%
- Equity multiple
- 1.74×
- Total profit
- $41,206
- Equity at exit
- $98,737
- IRR
- 13.9%
- Equity multiple
- 3.22×
- Total profit
- $124,221
- Equity at exit
- $159,402
Cash invested: $56,000 (down + closing). Projections, not guarantees.
Landlord ↔ Tenant lean methodology
- Overall (STATE)
- 71 Landlord-Friendly
- State Nevada
- 71 Landlord-Friendly · R+1
- County
- — inherits STATE
- City
- — inherits STATE
ZIP-level market 89822
- Home prices YoY
- 2.3%
- Active inventory
- 11
- Price-to-rent
- 9.7×
Monthly cashflow live
- Estimated rent
- $1,719 medium interval (Pro) →
- Mortgage (P&I)
- −$1,049
- Tax from tax record
- −$86 /mo · $1,031/yr
- Insurance
- −$83
- HOA
- −$0
- Vacancy / Maint / Mgmt
- −$361
- Net cashflow
- $140
Break-even live
Sensitivity live
| Price | -10% $253 | -5% $196 | +0% $140 | +5% $83 | +10% $27 |
|---|---|---|---|---|---|
| Rent | -10% $4 | -5% $72 | +0% $140 | +5% $208 | +10% $276 |
| Rate | -1.0pp $241 | -0.5pp $191 | base $140 | +0.5pp $88 | +1.0pp $35 |
UW: 25.0% down · 7.5% · 30yr · 1.5% tax · 5.0% vac · 8.0% maint · 8.0% mgmt
Financing live
Cash to close
- Down payment
- $50,000
- Closing costs
- $6,000
- Reserves months
- —
- Total cash needed
- —
Loan-product check · same deal, 3 products live
Conventional
25% down · 7.5% · 30yr
- Down + closing
- —
- Monthly P&I
- —
- Monthly cashflow
- —
- DSCR
- —
- Eligible?
- —
Personal DTI + credit; lowest rate.
DSCR
20% down · 8.5% · 30yr
- Down + closing
- —
- Monthly P&I
- —
- Monthly cashflow
- —
- DSCR
- —
- Eligible?
- —
No personal income docs; deal must DSCR.
Hard money
10% down · 12.0% · 12mo
- Down + closing
- —
- Monthly P&I
- —
- Monthly cashflow
- —
- DSCR
- —
- Eligible?
- —
Short-term bridge; refi at stabilization.
Listing history 25 events
-
2026-06-21days on market $200,000 Active 410 DOM
-
2026-06-19days on market $200,000 Active 408 DOM
-
2026-06-18days on market $200,000 Active 407 DOM
-
2026-06-17days on market $200,000 Active 406 DOM
-
2026-06-16days on market $200,000 Active 405 DOM
-
2026-06-15days on market $200,000 Active 404 DOM
-
2026-06-14days on market $200,000 Active 402 DOM
-
2026-06-12days on market $200,000 Active 401 DOM
-
2026-06-09days on market $200,000 Active 398 DOM
-
2026-06-08days on market $200,000 Active 397 DOM
-
2026-06-07days on market $200,000 Active 396 DOM
-
2026-06-07days on market $200,000 Active 395 DOM
-
2026-06-04days on market $200,000 Active 392 DOM
-
2026-06-02days on market $200,000 Active 391 DOM
-
2026-06-01days on market $200,000 Active 390 DOM
-
2026-05-31days on market $200,000 Active 389 DOM
-
2026-05-31days on market $200,000 Active 388 DOM
-
2026-01-15status Active 590-char remark
Show marketing remark (590 chars)
Great investment opportunity. Extra material for the project will stay at no additional cost to the buyer. All electric. There is currently a gas line pulled but you will have to contact Southwest Gas. All the homes have a new roof and new stucco (Permits pulled). A new sidewalk was also reconstructed on the front of the property. Every unit has its own new electrical meter that was installed by Wells Rural Electric. The first home is 95% complete. Buyer to do their own due diligence. RV Pad is available towards the end of the property. The owner of the property is the listing agent.
-
2025-04-23$200,000 Active 590-char remark
Show marketing remark (590 chars)
Great investment opportunity. Extra material for the project will stay at no additional cost to the buyer. All electric. There is currently a gas line pulled but you will have to contact Southwest Gas. All the homes have a new roof and new stucco (Permits pulled). A new sidewalk was also reconstructed on the front of the property. Every unit has its own new electrical meter that was installed by Wells Rural Electric. The first home is 95% complete. Buyer to do their own due diligence. RV Pad is available towards the end of the property. The owner of the property is the listing agent.
-
2024-06-11$225,000 Active
-
2022-08-15soldstatus $55,000
-
2022-06-19$60,000
-
2021-03-31soldstatus $50,000
-
2021-03-31soldstatus $50,000
-
2020-12-28$50,000
ⓘ Source: listings_history table (triggers on properties + properties_extension) + one-shot
backfill from property_details.listing_events for pre-trigger history.
Tax reassessment forecast NV · Resets to sale price
- Current annual tax
- $1,031 · $86/mo
- Projected year-2 tax
- $1,180 · $98/mo
- Expected delta
- +$149/yr (+$12/mo · 14.4%)
ⓘ Screening estimate from a state-policy table — verify with the county assessor before closing.
Climate risk First Street
- Flood 1/10 Low FEMA zone X (unshaded) · 0% chance over 30 yrs
- Wildfire 9/10 Extreme
- Heat 4/10 Moderate 6 d/yr ≥93°F today · 16 d/yr by 30 yrs out
- Wind 1/10 Low
- Air quality 4/10 Moderate 4 unhealthy d/yr today · 5 by 30 yrs out
Nearby sold comps map
Loading sold comps map…
Walkable amenities ~0.75 mi
Loading nearby amenities…
Taxation est. · year 1
- Rental income
- $20,628
- − Mortgage interest
- −$11,203
- − Property taxes
- −$1,031
- − Insurance
- −$1,000
- − Repairs & maintenance
- −$1,650
- − Management
- −$1,650
- − Depreciation
- −$5,818
- Taxable loss
- −$1,726
- Est. tax savings @ 24.0%
- +$414
- After-tax cash flow
- $2,093/yr
For passive investors: Depreciation is non-cash, so a rental often shows a tax loss while cash-flowing — sheltering income. Rental losses are passive: they offset passive income freely, and up to $25,000/yr can offset ordinary (W-2) income if you actively participate and your MAGI is under $100k (phasing out to $0 by $150k); unused losses carry forward. On sale, claimed depreciation is recaptured at up to 25%, and gains may owe capital-gains tax (a 1031 exchange can defer both). Figures are a year-1 estimate at your 24.0% rate — not tax advice; consult a CPA.
Schools (NCES district)
- District
- Elko County School District
- NCES district ID
- 3200120
- Math proficiency
- 22% ▼ -10.00%
- Reading proficiency
- 38% ▼ -6.00%
- Median HH income
- $70,371
- Composite
- 28.09/100
- National rank
- #6831
- State rank
- #9 of 17 in NV
Livability — Carlin
- Score
- 76/100
- State rank
- #7
- US rank
- #3297
Category grades
Schools grade is shown separately in the Schools card above.
Census & demographics
- Census place
- Carlin, NV
- Population (ZIP)
- 2,071
Population outlook (Elko County) Hauer SSP2
- Today (2025)
- 56,797 people
- By 2030
- 59,107 · +4.1%
- By 2040
- 63,513 · +11.8%
- By 2050
- 66,996 · +18.0%
- By 2075
- 73,785 · +29.9%
- By 2100
- 72,352 · +27.4%
Race, ethnicity, and origin ACS 2023
- Neighborhood character
- Majority White (65%)
- Race & ethnicity
- White 65% Two or more races 24% Hispanic / Latino 23% Asian 4% Native American 3%
- Hispanic origin (detail)
- Mexican 12%
- Common ancestry
- Italian 8% Danish 6% Scottish 2%
- Foreign-born
- 4% · Canada
- Languages at home
- 93% English-only · Spanish 6% Other Asian/Pacific 1%
Political lean MEDSL · Elko
- 2024 margin
- Solid R (+56.6) · D 20.6% · R 77.2% · Other 2.1%
- 2008→2024 swing
- -16.2pp toward R · 2008: -40.5pp · 2024: -56.6pp
- All cycles
- 2024: R+56.6 2020: R+55.5 2016: R+54.7 2012: R+53.2 2008: R+40.5
Not yet ingested
- Civics
- —
Market trends
- HPI YoY
- ▲ 3.77%
- Current HPI
- 168.0517
- Rent YoY
- —
- Metro
- —
- State GDP YoY
- ▲ 3.08%
- F500 in state
- 6
Industry mix (Fortune 500 HQ in NV)
| Industry | F500 HQs | Revenue |
|---|---|---|
| Hotels / Casinos | 3 | $36B |
|
||
Price history
+300.0% since first listed8 events — show timeline
- 2026-01-15 Relisted — ECRMLS
- 2025-04-23 Listed $200,000 ECRMLS
- 2024-06-11 Listed $225,000 ECRMLS
- 2022-08-15 Sold (MLS) $55,000 ECRMLS
- 2022-06-19 Listed $60,000 ECRMLS
- 2021-03-31 Sold (Public Records) $50,000 Public Records
- 2021-03-31 Sold (MLS) $50,000 ECRMLS
- 2020-12-28 Listed $50,000 ECRMLS
Property tax history
+5.5%/yrLatest (2025): $1,031 · -10.5% YoY. Source: county tax records.
Cash-flow waterfall
monthlySold comps — $/sqft
last 12 mo · ≤1 miLoading sold comps…