 🏷️ Likely Rental
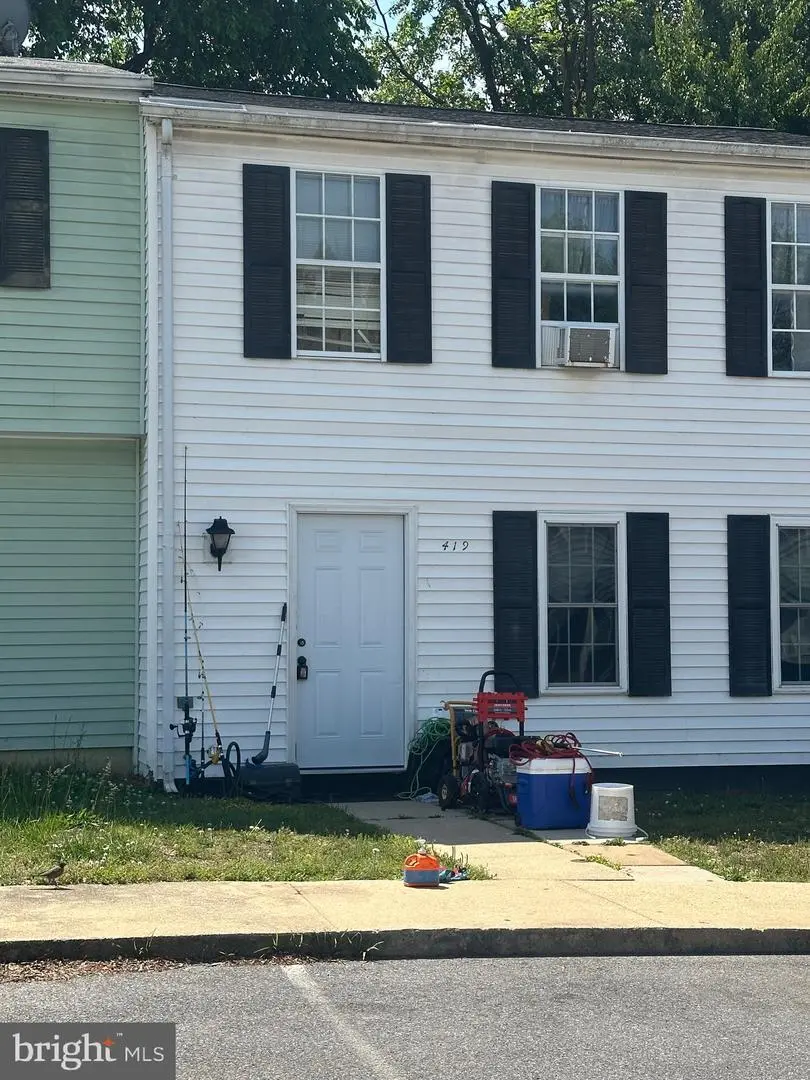
419 Patuxent Ct · La Plata, MD
Flood risk 1/10 · Minimal
- FEMA flood zone
- X (unshaded)
- Chance of flooding over 30 yrs
- 0.0%
- Est. flood insurance / yr
- $507 – $1,088
Fire risk 4/10 · Minor
- Est. fire insurance / yr
- $755 – $1,403
Heat risk 8/10 · Major
- Hot days now (above 103°F)
- 7 days/yr
- Hot days in 30 yrs
- 16 days/yr
Wind risk 6/10 · Moderate
- Chance of severe wind over 30 yrs
- 27.0%
Air-quality risk 2/10 · Minimal
- Unhealthy air days now
- 1 days/yr
- Unhealthy air days in 30 yrs
- 1 days/yr
Risk factors via First Street. Map © Google.
Why this score? — see what drove the C- grade
The composite is a weighted blend of 9 inputs, each scored 0–100. Each bar is that input's sub-score; the figure is the points it added to the 100-point composite (weight × sub-score).
- Cash flow +16.5/30.0
- ARV discount +15.0/15.0
- DSCR +5.1/10.0
- 1% rule +4.5/10.0
- Livability +3.7/5.0
- Rent growth +2.5/5.0
- Condition / age +2.5/5.0
- Schools +2.3/10.0
- Appreciation +0.0/10.0
$200,000
🖨 Deal sheet 📄 Offer letter ✓ Due diligence
Listing remarks
Investor Alert - This home is part of a smaller TH community in the heart of La Plata just off of Glen Albin Rd, convenient to town amenities, shopping, dining, medical, library & recreation. Great rental history & opportunity for end user or continued rental income. Home is being sold AS IS. cash or conventional financing Tenant occupied 24 hour notice to show.
Key facts
- Built 1979
- Listed 11 days
Property features AI
Exterior
- Parking: Parking lot
- Utilities: Public water; Public sewer; Electric hot water
- Home design: Interior townhouse/rowhouse; Fee simple ownership
- Construction: Vinyl siding; Slab foundation; Built year reported by assessor
- Exterior features: Property backs to trees; No basement
Interior
- Kitchen: Eat-in kitchen with table space
- Bedrooms: Three bedrooms on the upper level
- Bathrooms: One full bathroom
- Heating & cooling: Electric heating (baseboard); Electric cooling
- Interior features: Combination kitchen and dining area; Traditional floor plan; Eat-in kitchen with table space
Neighborhood map
What this means for you Summary
Snapshot
- This is a 3-bed/1.0-bath townhouse listed at $200k.
Deal economics
- At list price, monthly cash flow is $119 ($1k/yr) — positive.
- The deal already cash-flows at list — no discount required.
- To meet the 1% rule (rent ≥ 1% of price), the offer needs to be $189k (5.4% below list).
- Recommended offer: $189k (5.4% below list) — sets the bar for 1% rule.
- Cap rate 7.0% vs local median 3.6% in La Plata — top-decile yield for the area; either an underpriced asset or a hidden risk that comps aren't pricing in. Stress-test before assuming the spread holds.
Location & tenants
- Location reads 73/100 on livability (#132 in MD) — a middle-class / working-renter tenant base. Strengths: employment A+, housing A+, commute B; Watch: schools C-, health & safety C-, amenities F.
- Charles County Public Schools (suburban): math 13% / reading 29% proficiency, ranked #14 of 24 in MD (top 58%) — low school quality limits family demand, transient renter base, plan for 1-2y turnover.
- Market conditions: 213 active listings in the ZIP; 7 comparable units currently listed for rent nearby; rentals at typical pace (median 22d on market — plan ~3-4 weeks tenant-placement turnaround); 1,542 units permitted in Charles County in 2024 (516 in 5+ unit buildings).
Forward outlook
- Local home prices are declining (-3.0%/yr); year-one equity from $1k of loan paydown is wiped out by about $6k of value loss. Plan a longer hold.
- Charles County population projected at +27% by 2050 — long-run rental-demand tailwind backs the buy-and-hold thesis.
Negotiation context
- Only 11 days on market — expect competitive offers; lowballing is unlikely to land.
- Current owner paid $80k; list at $200k implies a 150% gain — meaningful room to come down on a strong offer.
Risks & watch-outs
- Climate carrying-cost: major wind risk, 27% chance of damaging wind over 30y; extreme-heat days projected 7→16/yr by 2055 (HVAC capex compounding) — expect insurance premiums to compound above CPI over the hold.
Questions for the listing agent
- Built in 1979 — when were the roof, HVAC, electrical panel, plumbing, and water heater last replaced?
- Is there a deadline driving the sale (1031 exchange, divorce, estate, relocation)? That informs how much negotiation room exists.
- What's the average days-on-market for RENTAL listings here right now (not sales)? A rising rental-DOM trend means longer vacancies and softer asking-rent achievability than the comps imply.
- What's the recent tenant-quality profile in this submarket — average credit score on applications, eviction rate, late-payment / NSF rate, and stable-employment percentage? A property-management company in the area should have these aggregated.
- How much new for-sale + rental construction is in the pipeline within 1–3 miles? Heavy new supply typically softens prices + rents 12–24 months out; constrained supply supports both.
Investment metrics
- 1% rule
- 0.95% ✗
- Cap rate
- 7.01%
- Cash-on-cash
- 2.55%
- DSCR
- 1.11
- GRM
- 8.8
CMA / ARV
- ARV (median comp)
- $274,672
- List price
- $200,000
- Delta
- -27.19%
- Verdict
- UNDERPRICED
- Comps
- 20 within 1.0 mi
Show comp detail 12 sales within ~0.75 mi
| Address | Dist | Beds/Ba | Sqft | Sold | Price | $/sf | Match |
|---|---|---|---|---|---|---|---|
| 433 Patuxent Ct | 0.04mi | 3/1.5 | 1,104 (0%) | 16mo | $260,000 | $236 | 83 |
| 438 Patuxent Ct | 0.05mi | 3/1.0 | 1,150 (+4%) | 15mo | $280,000 | $243 | 78 |
| 453 Patuxent Ct | 0.08mi | 3/1.5 | 1,104 (0%) | 21mo | $269,000 | $244 | 77 |
| 327 Saint Marys Ave Unit 7D | 0.17mi | 2/2.0 (-1) | 958 (-13%) | 17mo | $225,000 | $235 | 47 |
| 101 Carols Pl | 0.34mi | 2/2.0 (-1) | 1,229 (+11%) | 12mo | $310,000 | $252 | 46 |
| 134 Kalmia Ct | 0.70mi | 3/1.5 | 1,180 (+7%) | 10mo | $294,900 | $250 | 46 |
| 101 Carols Pl #112 | 0.34mi | 2/2.0 (-1) | 1,239 (+12%) | 14mo | $297,500 | $240 | 43 |
| 158 Kalmia Ct | 0.74mi | 3/1.5 | 1,180 (+7%) | 15mo | $310,000 | $263 | 40 |
| 212 Dorchester Ct | 0.75mi | 3/1.5 | 1,200 (+9%) | 11mo | $303,000 | $253 | 40 |
| 119 Kalmia Ct | 0.73mi | 3/1.5 | 1,240 (+12%) | 14mo | $256,000 | $206 | 32 |
| 132 Kalmia Ct | 0.70mi | 3/1.5 | 1,204 (+9%) | 22mo | $287,500 | $239 | 32 |
| 104 Kalmia Ct | 0.70mi | 3/1.5 | 1,252 (+13%) | 19mo | $289,900 | $232 | 27 |
Match score weights: distance 35% · size 25% · config 20% · recency 20%. Top-matched comps best support the ARV.
Projected returns pro-forma
-3.0% appreciation · 3.0% rent growth · sell at horizon
- IRR
- -12.3%
- Equity multiple
- 0.56×
- Total profit
- $-24,812
- Equity at exit
- $29,821
- IRR
- -3.1%
- Equity multiple
- 0.79×
- Total profit
- $-11,755
- Equity at exit
- $17,292
Cash invested: $56,000 (down + closing). Projections, not guarantees.
Landlord ↔ Tenant lean methodology
- Overall (STATE)
- 27 Tenant-Leaning
- State Maryland
- 27 Tenant-Leaning · D+14
- County
- — inherits STATE
- City
- — inherits STATE
ZIP-level market 20646
- Active inventory
- 213
- Price-to-rent
- 8.8×
Monthly cashflow live
- Estimated rent
- $1,893 high interval (Pro) →
- Mortgage (P&I)
- −$1,049
- Tax from tax record
- −$244 /mo · $2,933/yr
- Insurance
- −$83
- HOA
- −$0
- Vacancy / Maint / Mgmt
- −$398
- Net cashflow
- $119
Break-even live
UW: 25.0% down · 7.5% · 30yr · 1.5% tax · 5.0% vac · 8.0% maint · 8.0% mgmt
Financing live
Cash to close
- Down payment
- $50,000
- Closing costs
- $6,000
- Reserves months
- —
- Total cash needed
- —
Loan-product check · same deal, 3 products live
Conventional
25% down · 7.5% · 30yr
- Down + closing
- —
- Monthly P&I
- —
- Monthly cashflow
- —
- DSCR
- —
- Eligible?
- —
Personal DTI + credit; lowest rate.
DSCR
20% down · 8.5% · 30yr
- Down + closing
- —
- Monthly P&I
- —
- Monthly cashflow
- —
- DSCR
- —
- Eligible?
- —
No personal income docs; deal must DSCR.
Hard money
10% down · 12.0% · 12mo
- Down + closing
- —
- Monthly P&I
- —
- Monthly cashflow
- —
- DSCR
- —
- Eligible?
- —
Short-term bridge; refi at stabilization.
Rent comps 7 comps
| Address | Beds | Baths | Sqft | Rent | $/sqft | DOM | Units | Dist |
|---|---|---|---|---|---|---|---|---|
| 327 Saint Marys Ave Unit 7K La Plata, MD | 2.0 | 2.0 | 1243 | $2,000 | $1.61 | 43d | 1 | 0.18mi |
| 327 Saint Marys Ave Unit 7H La Plata, MD | 2.0 | 2.0 | 958 | $1,700 | $1.77 | 22d | 1 | 0.18mi |
| 103 Hibiscus Ct La Plata, MD | 2.0 | 2.5 | 1368 | $2,100 | $1.54 | 24d | 1 | 0.29mi |
| 301 Carols Pl La Plata, MD | 2.0 | 2.0 | 950 | $1,925 | $2.03 | 18d | 1 | 0.30mi |
| 201 Carol's Pl La Plata, MD | 2.0 | 2.0 | 1229 | $1,925 | $1.57 | 4d | 1 | 0.32mi |
| 310 Caroline Dr La Plata, MD | 1.0–2.0 | 1.0 | 800 | $1,650 | $2.06 | 15d | 3 | 0.83mi |
| 600 Currant Ct La Plata, MD | 2.0 | 1.0 | 1000 | $1,700 | $1.70 | 43d | 1 | 1.18mi |
Listing history 3 events
-
2026-05-14$200,000 Active 376-char remark
-
2026-05-13historical $200,000 376-char remark
-
2020-12-17soldstatus $80,000
ⓘ Source: listings_history table (triggers on properties + properties_extension) + one-shot
backfill from property_details.listing_events for pre-trigger history.
Tax reassessment forecast MD · Partial reset (capped growth)
- Current annual tax
- $2,933 · $244/mo
- Projected year-2 tax
- $2,933 · $244/mo
- Expected delta
- $0/yr ($0/mo · 0.0%)
ⓘ Screening estimate from a state-policy table — verify with the county assessor before closing.
Climate risk First Street
- Flood 1/10 Low FEMA zone X (unshaded) · 0% chance over 30 yrs
- Wildfire 4/10 Moderate
- Heat 8/10 Severe 7 d/yr ≥103°F today · 16 d/yr by 30 yrs out
- Wind 6/10 Major 27% chance of damaging wind over 30 yrs
- Air quality 2/10 Low 1 unhealthy d/yr today · 1 by 30 yrs out
Nearby sold comps map
Loading sold comps map…
Walkable amenities ~0.75 mi
Loading nearby amenities…
Taxation est. · year 1
- Rental income
- $22,716
- − Mortgage interest
- −$11,203
- − Property taxes
- −$2,933
- − Insurance
- −$1,000
- − Repairs & maintenance
- −$1,817
- − Management
- −$1,817
- − Depreciation
- −$5,818
- Taxable loss
- −$1,873
- Est. tax savings @ 24.0%
- +$450
- After-tax cash flow
- $1,876/yr
For passive investors: Depreciation is non-cash, so a rental often shows a tax loss while cash-flowing — sheltering income. Rental losses are passive: they offset passive income freely, and up to $25,000/yr can offset ordinary (W-2) income if you actively participate and your MAGI is under $100k (phasing out to $0 by $150k); unused losses carry forward. On sale, claimed depreciation is recaptured at up to 25%, and gains may owe capital-gains tax (a 1031 exchange can defer both). Figures are a year-1 estimate at your 24.0% rate — not tax advice; consult a CPA.
Schools (NCES district)
- District
- Charles County Public Schools
- NCES district ID
- 2400270
- Math proficiency
- 13% ▼ -19.00%
- Reading proficiency
- 29% ▼ -13.00%
- Median HH income
- $90,389
- Composite
- 22.54/100
- National rank
- #8087
- State rank
- #14 of 24 in MD
Livability — La Plata
- Score
- 73/100
- State rank
- #132
- US rank
- #5547
Category grades
Schools grade is shown separately in the Schools card above.
Census & demographics
- Census place
- La Plata, MD
- Population (ZIP)
- 21,601
Population outlook (Charles County) Hauer SSP2
- Today (2025)
- 176,616 people
- By 2030
- 186,471 · +5.6%
- By 2040
- 206,472 · +16.9%
- By 2050
- 224,883 · +27.3%
- By 2075
- 272,101 · +54.1%
- By 2100
- 303,564 · +71.9%
Race, ethnicity, and origin ACS 2023
- Neighborhood character
- Diverse neighborhood (Simpson 0.56)
- Race & ethnicity
- White 62% Black 24% Two or more races 8% Hispanic / Latino 4% Asian 3%
- Common ancestry
- Italian 3% Romanian 2% Iranian 2%
- Foreign-born
- 7% · Canada, China
- Languages at home
- 93% English-only · Spanish 2% Other Indo-European 2% Tagalog/Filipino 1%
Political lean MEDSL · Charles
- 2024 margin
- Solid D (+40.7) · D 69.2% · R 28.5% · Other 2.2%
- 2008→2024 swing
- +15.2pp toward D · 2008: 25.5pp · 2024: 40.7pp
- All cycles
- 2024: D+40.7 2020: D+40.9 2016: D+30.2 2012: D+31.3 2008: D+25.5
Not yet ingested
- Civics
- —
Market trends
- HPI YoY
- ▼ -150.48%
- Current HPI
- 238.0634
- Rent YoY
- —
- Metro
- —
- State GDP YoY
- ▲ 2.97%
- F500 in state
- 12
Industry mix (Fortune 500 HQ in MD)
| Industry | F500 HQs | Revenue |
|---|---|---|
| Aerospace / Defense | 1 | $71B |
|
||
| Utilities | 1 | $25B |
|
||
| Hotels | 1 | $24B |
|
||
| Consumer Goods | 1 | $7B |
|
||
| Real Estate | 1 | $6B |
|
||
| Chemicals | 1 | $2B |
|
||
Price history
+150.0% since first listed4 events — show timeline
- 2026-05-24 Pending — BRIGHT MLS
- 2026-05-14 Listed $200,000 BRIGHT MLS
- 2026-05-13 Coming Soon $200,000 BRIGHT MLS
- 2020-12-17 Sold (Public Records) $80,000 Public Records
Property tax history
+3.1%/yrLatest (2025): $2,933 · +10.1% YoY. Source: county tax records.
Cash-flow waterfall
monthlySold comps — $/sqft
last 12 mo · ≤1 miLoading sold comps…