172 Brooke St · Huntsville, AR
Flood risk No data
- FEMA flood zone
- —
- Chance of flooding over 30 yrs
- —
- Est. flood insurance / yr
- —
Fire risk No data
- Est. fire insurance / yr
- —
Heat risk No data
- Hot days now (above threshold)
- —
- Hot days in 30 yrs
- —
Wind risk No data
- Chance of severe wind over 30 yrs
- —
Air-quality risk No data
- Unhealthy air days now
- —
- Unhealthy air days in 30 yrs
- —
Risk factors via First Street. Map © Google.
Why this score? — see what drove the D- grade
The composite is a weighted blend of 9 inputs, each scored 0–100. Each bar is that input's sub-score; the figure is the points it added to the 100-point composite (weight × sub-score).
- Appreciation +10.0/10.0
- ARV discount +8.2/15.0
- Cash flow +6.8/30.0
- Livability +3.7/5.0
- Schools +2.7/10.0
- Rent growth +2.5/5.0
- Condition / age +2.5/5.0
- DSCR +1.1/10.0
- 1% rule +0.9/10.0
$269,999
🖨 Deal sheet 📄 Offer letter ✓ Due diligence
Listing remarks
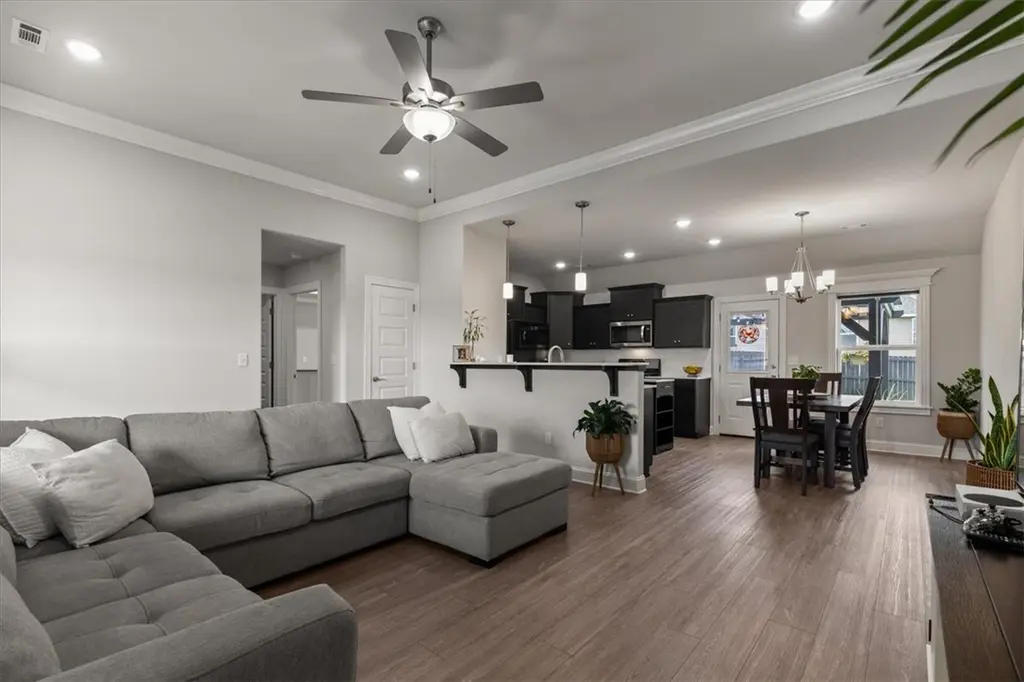
Welcome to this beautifully crafted one-level home in the heart of Huntsville, Arkansas. This 2024-built residence offers 1,535 square feet of modern living space, featuring 3 spacious bedrooms and 2 stylish bathrooms. As you step inside, you are greeted by an abundance of natural light and an inviting open layout designed for seamless entertaining. The gourmet kitchen is a chef’s dream, boasting sleek quartz countertops, a classic tile backsplash, and premium gas cooking. Retreat to the primary suite, which includes a generous walk-in closet and a spa-like bath for ultimate relaxation. Outside, the 0.23-acre lot features a private oasis complete with a CUSTOM pergola and a full wood
Key facts
- Designer kitchen
- Quartz countertops
- Walk-in closet
Tags
Property features AI
Finance
- HOA & community: Monthly association fee; Community near schools, with sidewalks and trails/paths
Exterior
- Parking: Attached garage with garage door opener; 2 covered spaces
- Security: Fire alarm; Smoke detector(s)
- Utilities: Electricity available; Natural gas available; Sewer available; Public water
- Home design: Single-story; Resale (less than 25 years old); Brick and vinyl siding construction; Architectural shingle roof; Slab foundation
- Construction: Brick exterior; Vinyl siding; Architectural shingle roof; Slab foundation; Built as resale (under 25 years)
- Exterior features: Concrete driveway; Patio; Porch; Back yard fencing (wood, privacy); Cleared, landscaped subdivision lot; Public paved road frontage
Interior
- Kitchen: Countertop; Dishwasher; Gas range; Microwave; Disposal; ENERGY STAR qualified appliances
- Flooring: Luxury vinyl plank
- Bathrooms: 2 full bathrooms
- Heating & cooling: Central heating (gas); Central air (electric)
- Interior features: Attic; Ceiling fan(s); Pantry; Quartz counters; Split bedrooms; Storage; Walk-in closet(s); Double pane windows
- Laundry & utility: Washer hookup; Dryer hookup; Electric water heater
Neighborhood map
What this means for you Summary
Snapshot
- This is a 3-bed/2.0-bath single-family listed at $270k.
Deal economics
- At list price, monthly cash flow is $-414 ($-5k/yr) — negative.
- To cash-flow at today's rent, offer at most $197k (27.1% below list).
- To meet the 1% rule (rent ≥ 1% of price), the offer needs to be $160k (40.9% below list).
- Recommended offer: $160k (40.9% below list) — sets the bar for 1% rule.
- Cap rate 4.5% vs local median 2.8% in Huntsville — top-decile yield for the area; either an underpriced asset or a hidden risk that comps aren't pricing in. Stress-test before assuming the spread holds.
Location & tenants
- Location reads 73/100 on livability (#26 in AR) — a middle-class / working-renter tenant base. Strengths: cost of living A+, housing A+, health & safety A+; Watch: schools F, amenities F, commute F.
- Huntsville School District (rural): math 35% / reading 29% proficiency, ranked #141 of 238 in AR (top 59%) — families likely to look elsewhere, expect single-tenant / working-renter base with shorter leases.
- Market conditions: 129 active listings in the ZIP; 2 comparable units currently listed for rent nearby; 29 units permitted in Madison County in 2024 (0 in 5+ unit buildings).
Forward outlook
- In year one you build about $29k of equity ($2k loan paydown + $27k appreciation (10.0% local appreciation)).
- Madison County population projected to shrink 9% by 2050 — rents likely to lag national; underwrite the cash flow, not the appreciation.
- By year 2, paydown + projected appreciation supports a ~$46k cash-out refi (75% LTV) — recoverable capital for the next deal without selling this one.
Negotiation context
- It's been on market 37 days — a 3% lower offer ($262k) is reasonable based on typical stale-listing flexibility.
Questions for the listing agent
- What do current leases actually rent for vs. the listed asking? Can we see a recent rent roll and the last 12 months of T-12 income?
- It's been on market 37 days. Have you received any prior offers? Is the seller open to a 41% concession, seller financing, or rate buy-down credit?
- Is there a deadline driving the sale (1031 exchange, divorce, estate, relocation)? That informs how much negotiation room exists.
- Schools are F-rated, which usually means shorter tenancies and higher turnover. Who's the typical renter profile here, and what's been the actual vacancy rate?
- The area grade is low — what's the realistic commute time and amenity access for the typical tenant pool here? Any planned neighborhood developments (good or bad) we should know about?
- What's the average days-on-market for RENTAL listings here right now (not sales)? A rising rental-DOM trend means longer vacancies and softer asking-rent achievability than the comps imply.
- What's the recent tenant-quality profile in this submarket — average credit score on applications, eviction rate, late-payment / NSF rate, and stable-employment percentage? A property-management company in the area should have these aggregated.
- How much new for-sale + rental construction is in the pipeline within 1–3 miles? Heavy new supply typically softens prices + rents 12–24 months out; constrained supply supports both.
Investment metrics
- 1% rule
- 0.59% ✗
- Cap rate
- 4.45%
- Cash-on-cash
- -6.58%
- DSCR
- 0.71
- GRM
- 14.1
CMA / ARV
- ARV (median comp)
- $274,027
- List price
- $269,999
- Delta
- -1.47%
- Verdict
- FAIR
- Comps
- 20 within 1.0 mi
Show comp detail 12 sales within ~0.75 mi
| Address | Dist | Beds/Ba | Sqft | Sold | Price | $/sf | Match |
|---|---|---|---|---|---|---|---|
| 164 Parson St | 0.14mi | 3/2.0 | 1,467 (+0%) | 2mo | $250,000 | $170 | 92 |
| 291 Tonya Loop | 0.05mi | 3/2.0 | 1,620 (+10%) | 2mo | $280,000 | $173 | 78 |
| 108 Cedar Hts | 0.37mi | 3/2.0 | 1,497 (+2%) | 1mo | $185,000 | $124 | 78 |
| 259 Tonya Loop | 0.05mi | 3/2.0 | 1,641 (+12%) | 3mo | $280,000 | $171 | 75 |
| 184 Jenee Dr | 0.40mi | 4/2.0 (+1) | 1,468 (+0%) | 3mo | $245,000 | $167 | 73 |
| 231 Tonya Loop | 0.05mi | 3/2.0 | 1,665 (+14%) | 4mo | $283,500 | $170 | 72 |
| 166 Youngblood Pl | 0.16mi | 3/2.0 | 1,632 (+11%) | 3mo | $280,000 | $172 | 71 |
| 244 Colton St | 0.46mi | 3/2.0 | 1,422 (-3%) | 4mo | $245,000 | $172 | 70 |
| 273 Tonya Loop | 0.05mi | 4/2.0 (+1) | 1,650 (+13%) | 3mo | $282,900 | $171 | 69 |
| 214 Lavona Ln | 0.19mi | 3/2.0 | 1,658 (+13%) | 1mo | $289,900 | $175 | 68 |
| 205 Cherry Ln | 0.68mi | 4/2.0 (+1) | 1,456 (-1%) | 1mo | $205,000 | $141 | 61 |
| 504 N College St | 0.54mi | 3/1.0 | 1,310 (-11%) | 1mo | $195,000 | $149 | 52 |
Match score weights: distance 35% · size 25% · config 20% · recency 20%. Top-matched comps best support the ARV.
Projected returns pro-forma
10.0% appreciation · 3.0% rent growth · sell at horizon
- IRR
- 19.6%
- Equity multiple
- 2.59×
- Total profit
- $120,567
- Equity at exit
- $243,236
- IRR
- 18.0%
- Equity multiple
- 5.97×
- Total profit
- $375,615
- Equity at exit
- $524,549
Cash invested: $75,600 (down + closing). Projections, not guarantees.
Landlord ↔ Tenant lean methodology
- Overall (STATE)
- 92 Strongly Landlord-Friendly
- State Arkansas
- 92 Strongly Landlord-Friendly · R+14
- County
- — inherits STATE
- City
- — inherits STATE
ZIP-level market 72740
- Home prices YoY
- 19.5%
- Active inventory
- 129
- Price-to-rent
- 14.1×
Monthly cashflow live
- Estimated rent
- $1,595 medium interval (Pro) →
- Mortgage (P&I)
- −$1,416
- Tax from tax record
- −$146 /mo · $1,752/yr
- Insurance
- −$112
- HOA
- −$0
- Vacancy / Maint / Mgmt
- −$335
- Net cashflow
- $-414
Break-even live
UW: 25.0% down · 7.5% · 30yr · 1.5% tax · 5.0% vac · 8.0% maint · 8.0% mgmt
Financing live
Cash to close
- Down payment
- $67,500
- Closing costs
- $8,100
- Reserves months
- —
- Total cash needed
- —
Loan-product check · same deal, 3 products live
Conventional
25% down · 7.5% · 30yr
- Down + closing
- —
- Monthly P&I
- —
- Monthly cashflow
- —
- DSCR
- —
- Eligible?
- —
Personal DTI + credit; lowest rate.
DSCR
20% down · 8.5% · 30yr
- Down + closing
- —
- Monthly P&I
- —
- Monthly cashflow
- —
- DSCR
- —
- Eligible?
- —
No personal income docs; deal must DSCR.
Hard money
10% down · 12.0% · 12mo
- Down + closing
- —
- Monthly P&I
- —
- Monthly cashflow
- —
- DSCR
- —
- Eligible?
- —
Short-term bridge; refi at stabilization.
Rent comps 2 comps
| Address | Beds | Baths | Sqft | Rent | $/sqft | DOM | Units | Dist |
|---|---|---|---|---|---|---|---|---|
| 171 Madison St Unit 2415 Huntsville, AR | 3.0 | 2.0 | 1120 | $1,595 | $1.42 | 44d | 1 | 1.09mi |
| 171 Madison St Unit 2415 Huntsville, AR | 3.0 | 2.0 | 1116 | $1,595 | $1.43 | 23d | 1 | 1.09mi |
Listing history 8 events
-
2026-06-05statusdays on market $269,999 Pending 37 DOM
-
2026-06-03days on market $269,999 Active 36 DOM
-
2026-06-02days on market $269,999 Active 35 DOM
-
2026-06-01days on market $269,999 Active 34 DOM
-
2026-05-31days on market $269,999 Active 33 DOM
-
2026-05-31days on market $269,999 Active 32 DOM
-
2026-04-28$269,999 Active 994-char remark
-
2024-03-14soldstatus $247,750
ⓘ Source: listings_history table (triggers on properties + properties_extension) + one-shot
backfill from property_details.listing_events for pre-trigger history.
Tax reassessment forecast AR · Resets to sale price
- Current annual tax
- $1,752 · $146/mo
- Projected year-2 tax
- $1,752 · $146/mo
- Expected delta
- $0/yr ($0/mo · 0.0%)
ⓘ Screening estimate from a state-policy table — verify with the county assessor before closing.
Nearby sold comps map
Loading sold comps map…
Walkable amenities ~0.75 mi
Loading nearby amenities…
Taxation est. · year 1
- Rental income
- $19,140
- − Mortgage interest
- −$15,124
- − Property taxes
- −$1,752
- − Insurance
- −$1,350
- − Repairs & maintenance
- −$1,531
- − Management
- −$1,531
- − Depreciation
- −$7,855
- Taxable loss
- −$10,003
- Est. tax savings @ 24.0%
- +$2,401
- After-tax cash flow
- $-2,571/yr
For passive investors: Depreciation is non-cash, so a rental often shows a tax loss while cash-flowing — sheltering income. Rental losses are passive: they offset passive income freely, and up to $25,000/yr can offset ordinary (W-2) income if you actively participate and your MAGI is under $100k (phasing out to $0 by $150k); unused losses carry forward. On sale, claimed depreciation is recaptured at up to 25%, and gains may owe capital-gains tax (a 1031 exchange can defer both). Figures are a year-1 estimate at your 24.0% rate — not tax advice; consult a CPA.
Schools (NCES district)
- District
- Huntsville School District
- NCES district ID
- 0508130
- Math proficiency
- 35% ▼ -7.00%
- Reading proficiency
- 29% ▼ -7.00%
- Median HH income
- $37,770
- Composite
- 26.72/100
- National rank
- #7146
- State rank
- #141 of 238 in AR
Livability — Huntsville
- Score
- 73/100
- State rank
- #26
- US rank
- #5604
Category grades
Schools grade is shown separately in the Schools card above.
Census & demographics
- Census place
- Huntsville, AR
- Population (ZIP)
- 10,226
Population outlook (Madison County) Hauer SSP2
- Today (2025)
- 15,655 people
- By 2030
- 15,418 · -1.5%
- By 2040
- 14,824 · -5.3%
- By 2050
- 14,198 · -9.3%
- By 2075
- 12,827 · -18.1%
- By 2100
- 10,871 · -30.6%
Race, ethnicity, and origin ACS 2023
- Neighborhood character
- Predominantly White (73%)
- Race & ethnicity
- White 73% Two or more races 22% Hispanic / Latino 4% Pacific Islander 1%
- Common ancestry
- Italian 3% Lithuanian 2% Slovak 2%
- Foreign-born
- 2% · Canada
- Languages at home
- 98% English-only · Spanish 1% Other Asian/Pacific 1%
Political lean MEDSL · Madison
- 2024 margin
- Solid R (+58.6) · D 19.9% · R 78.5% · Other 1.7%
- 2008→2024 swing
- -29.7pp toward R · 2008: -28.9pp · 2024: -58.6pp
- All cycles
- 2024: R+58.6 2020: R+55.7 2016: R+49.1 2012: R+32.9 2008: R+28.9
Not yet ingested
- Civics
- —
Market trends
- HPI YoY
- ▲ 57.73%
- Current HPI
- 353.404
- Rent YoY
- —
- Metro
- —
- State GDP YoY
- ▲ 3.80%
- F500 in state
- 10
Industry mix (Fortune 500 HQ in AR)
| Industry | F500 HQs | Revenue |
|---|---|---|
| Retail | 1 | $681B |
|
||
| Food / Agriculture | 1 | $53B |
|
||
| Retail / Energy | 1 | $22B |
|
||
| Transportation / Logistics | 1 | $12B |
|
||
| Energy | 1 | $4B |
|
||
Price history
+9.0% since first listed3 events — show timeline
- 2026-06-04 Pending — NWARMLS
- 2026-04-28 Listed $269,999 NWARMLS
- 2024-03-14 Sold (Public Records) $247,750 Public Records
Property tax history
+372.7%/yrLatest (2025): $1,752 · +2134.1% YoY. Source: county tax records.
Cash-flow waterfall
monthlySold comps — $/sqft
last 12 mo · ≤1 miLoading sold comps…