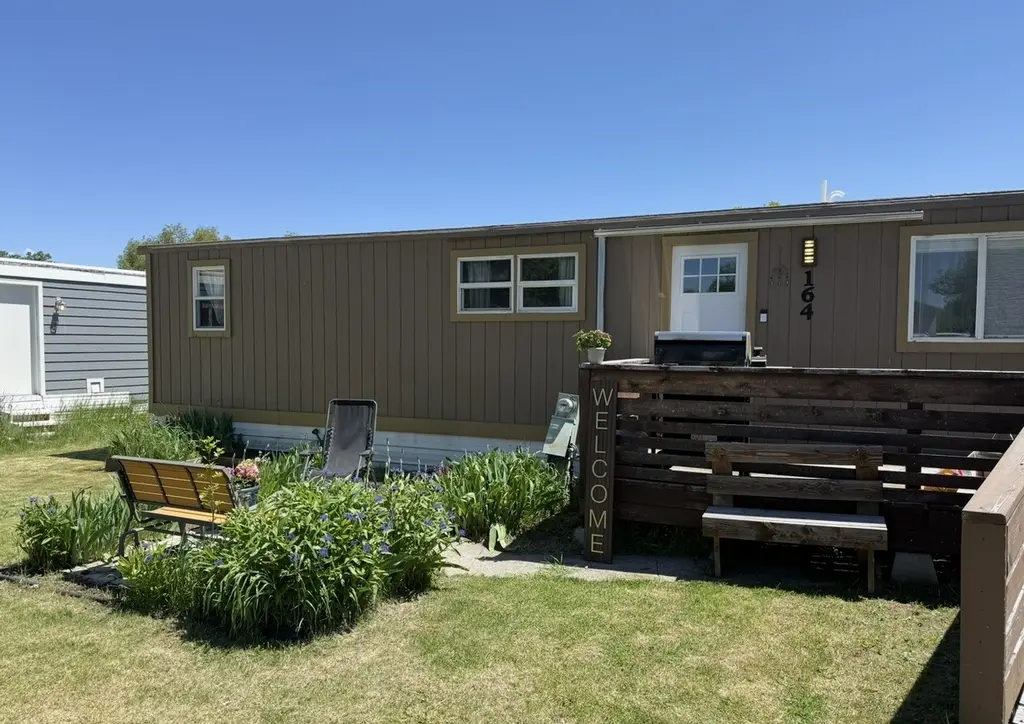
164 Wagon Train Trl · Bozeman, MT
Flood risk 1/10 · Minimal
- FEMA flood zone
- X (unshaded)
- Chance of flooding over 30 yrs
- 0.0%
- Est. flood insurance / yr
- $507 – $1,088
Fire risk 1/10 · Minimal
- Est. fire insurance / yr
- $918 – $1,706
Heat risk 2/10 · Minimal
- Hot days now (above 88°F)
- 7 days/yr
- Hot days in 30 yrs
- 17 days/yr
Wind risk 1/10 · Minimal
- Chance of severe wind over 30 yrs
- —
Air-quality risk 5/10 · Moderate
- Unhealthy air days now
- 8 days/yr
- Unhealthy air days in 30 yrs
- 8 days/yr
Risk factors via First Street. Map © Google.
Why this score? — see what drove the B grade
The composite is a weighted blend of 9 inputs, each scored 0–100. Each bar is that input's sub-score; the figure is the points it added to the 100-point composite (weight × sub-score).
- Cash flow +30.0/30.0
- 1% rule +10.0/10.0
- DSCR +10.0/10.0
- ARV discount +7.5/15.0
- Schools +5.2/10.0
- Livability +4.2/5.0
- Condition / age +3.8/5.0
- Rent growth +2.6/5.0
- Appreciation +0.0/10.0
$115,000
🖨 Deal sheet 📄 Offer letter ✓ Due diligence
Key facts
- Built 1969
- Listed 34 days
Property features AI
Finance
- Other: Located in Covered Wagon Mobile Home Park; directions: Wagon Wheel Park on the corner of Oak and 19th Street
- Financial info: Land is leased; Annual tax approximately $300
- HOA & community: Has homeowners association; HOA includes sewer, trash and water; HOA parking available; HOA fee $720 monthly
Exterior
- Parking: Assigned parking (see remarks)
- Utilities: Public sewer
- Home design: Manufactured home (single wide); Residential property; Pillar/post/pier foundation
- Construction: Single wide manufactured body type
- Exterior features: Deck; Back yard fencing
Interior
- Kitchen: Dishwasher, Range, Refrigerator
- Bathrooms: 1 full bathroom; 1 half bathroom
- Heating & cooling: Central air conditioning; Forced air heating
- Interior features: Dishwasher, Range, Refrigerator
Neighborhood map
What this means for you Summary
Snapshot
- This is a 3-bed/1.5-bath manufactured listed at $115k. Condition is rated good.
Deal economics
- At list price, monthly cash flow is $678 ($8k/yr) — positive.
- The deal already cash-flows at list — no discount required.
- Meets the 1% rule at list price ($3k rent vs $115k).
- Recommended offer: $112k (3.0% below list) — sets the bar for market timing.
- Cap rate 13.4% vs local median 2.1% in Bozeman — top-decile yield for the area; either an underpriced asset or a hidden risk that comps aren't pricing in. Stress-test before assuming the spread holds.
Location & tenants
- Location reads 85/100 on livability (#1 in MT, #537 nationally) — a professional / high-income tenant draw. Strengths: schools A+, amenities A+, commute A+; Watch: crime D, cost of living D-.
- Bozeman Elementary (town): math 56% / reading 66% proficiency, ranked #7 of 116 in MT (top 6%) — acceptable for families but not a draw, mixed tenant base, ~2y average lease; only 18% free/reduced lunch — higher-income household profile.
- Market conditions: Rents flat; 298 active listings in the ZIP; 17 comparable units currently listed for rent nearby; rentals at typical pace (median 21d on market — plan ~3-4 weeks tenant-placement turnaround); solid renter incomes; 1,706 units permitted in Gallatin County in 2024 (533 in 5+ unit buildings).
- This rent runs 38% of the median local income ($88k/yr) — at the standard rent-burdened threshold; future hikes will face affordability resistance.
Forward outlook
- Local home prices are declining (-3.0%/yr); year-one equity from $795 of loan paydown is wiped out by about $3k of value loss. Plan a longer hold.
- Gallatin County population projected at +61% by 2050 — long-run rental-demand tailwind backs the buy-and-hold thesis.
- At projected returns (-3.0% appreciation + 0.2% rent growth), your $32k cash investment doubles in ~7 years — after that, you're playing with house money.
Negotiation context
- It's been on market 35 days — a 3% lower offer ($112k) is reasonable based on typical stale-listing flexibility.
Risks & watch-outs
- Watch-outs: HOA is 26% of rent.
Questions for the listing agent
- It's been on market 35 days. Have you received any prior offers? Is the seller open to a 3% concession, seller financing, or rate buy-down credit?
- Built in 1969 — when were the roof, HVAC, electrical panel, plumbing, and water heater last replaced?
- What does the HOA fee cover, when was the last increase, and are there any pending special assessments or reserve-fund shortfalls?
- Is there a deadline driving the sale (1031 exchange, divorce, estate, relocation)? That informs how much negotiation room exists.
- Schools are A-rated — typically a magnet for longer-tenancy family renters. What's the average tenant stay here, and is there a school-zone premium baked into asking?
- Crime grade is D in this area — have there been break-ins, vandalism, or insurance claims at this property in the last 3 years? What carrier currently insures it and at what premium?
- What's the average days-on-market for RENTAL listings here right now (not sales)? A rising rental-DOM trend means longer vacancies and softer asking-rent achievability than the comps imply.
- What's the recent tenant-quality profile in this submarket — average credit score on applications, eviction rate, late-payment / NSF rate, and stable-employment percentage? A property-management company in the area should have these aggregated.
- How much new for-sale + rental construction is in the pipeline within 1–3 miles? Heavy new supply typically softens prices + rents 12–24 months out; constrained supply supports both.
Investment metrics
- 1% rule
- 2.41% ✓
- Cap rate
- 13.37%
- Cash-on-cash
- 25.26%
- DSCR
- 2.12
- GRM
- 3.5
CMA / ARV
No comps found within radius.
Projected returns pro-forma
-3.0% appreciation · 0.2% rent growth · sell at horizon
- IRR
- 14.2%
- Equity multiple
- 1.54×
- Total profit
- $17,409
- Equity at exit
- $17,147
- IRR
- 19.7%
- Equity multiple
- 2.34×
- Total profit
- $43,200
- Equity at exit
- $9,943
Cash invested: $32,200 (down + closing). Projections, not guarantees.
Landlord ↔ Tenant lean methodology
- Overall (STATE)
- 82 Strongly Landlord-Friendly
- State Montana
- 82 Strongly Landlord-Friendly · R+11
- County
- — inherits STATE
- City
- — inherits STATE
ZIP-level market 59715
- Rents YoY
- 0.2%
- Active inventory
- 298
- Price-to-rent
- 3.5×
Monthly cashflow live
- Estimated rent
- $2,775 high interval (Pro) →
- Mortgage (P&I)
- −$603
- Tax est. 1.5%
- −$144 /mo · $1,725/yr
- Insurance
- −$48
- HOA
- −$720
- Vacancy / Maint / Mgmt
- −$583
- Net cashflow
- $678
Break-even live
UW: 25.0% down · 7.5% · 30yr · 1.5% tax · 5.0% vac · 8.0% maint · 8.0% mgmt
Financing live
Cash to close
- Down payment
- $28,750
- Closing costs
- $3,450
- Reserves months
- —
- Total cash needed
- —
Loan-product check · same deal, 3 products live
Conventional
25% down · 7.5% · 30yr
- Down + closing
- —
- Monthly P&I
- —
- Monthly cashflow
- —
- DSCR
- —
- Eligible?
- —
Personal DTI + credit; lowest rate.
DSCR
20% down · 8.5% · 30yr
- Down + closing
- —
- Monthly P&I
- —
- Monthly cashflow
- —
- DSCR
- —
- Eligible?
- —
No personal income docs; deal must DSCR.
Hard money
10% down · 12.0% · 12mo
- Down + closing
- —
- Monthly P&I
- —
- Monthly cashflow
- —
- DSCR
- —
- Eligible?
- —
Short-term bridge; refi at stabilization.
Rent comps 17 comps
| Address | Beds | Baths | Sqft | Rent | $/sqft | DOM | Units | Dist |
|---|---|---|---|---|---|---|---|---|
| 603 Emily Dr Bozeman, MT | 2.0–3.0 | 1.0–2.0 | 1075 | $2,384 | $2.22 | 21d | 3 | 0.48mi |
| 2503 Lily Dr Bozeman, MT | 4.0 | 2.0 | 2088 | $3,250 | $1.56 | 21d | 1 | 0.59mi |
| 1481 N 25th Ave Bozeman, MT | 2.0 | 1.0–2.0 | 887 | $2,050 | $2.31 | 21d | 21 | 0.64mi |
| 1810 N 25th Ave Bozeman, MT | 1.0–3.0 | 1.0–2.0 | 1188 | $8,250 | $6.94 | 21d | 210 | 0.65mi |
| 1624 Gale Ct Bozeman, MT | 3.0 | 3.0 | 2214 | $3,450 | $1.56 | 21d | 1 | 0.79mi |
| 303 N 9th Ave Unit 307 Bozeman, MT | 2.0 | 1.0 | 1193 | $1,900 | $1.59 | 21d | 1 | 0.83mi |
| 1624 W Babcock St Bozeman, MT | 1.0–2.0 | 1.0–2.0 | 1039 | $2,465 | $2.37 | 21d | 6 | 0.97mi |
| 2130 S 18th Ave Bozeman, MT | 1.0–3.0 | 1.0–2.5 | 1438 | $4,140 | $2.88 | 21d | 28 | 1.04mi |
| 109 Meghans Way Bozeman, MT | 2.0 | 2.0 | 1100 | $3,500 | $3.18 | 21d | 1 | 1.06mi |
| 818 W Babcock St Bozeman, MT | 1.0–3.0 | 1.0–2.0 | 1003 | $5,195 | $5.18 | 21d | 8 | 1.07mi |
| 1504 New Holland Dr Bozeman, MT | 3.0 | 2.5 | 1581 | $3,250 | $2.06 | 21d | 1 | 1.07mi |
| 516 N Willson Ave Bozeman, MT | 3.0 | 2.0 | 2000 | $2,850 | $1.43 | 21d | 1 | 1.11mi |
| 304 S 20th Ave Bozeman, MT | 3.0 | 1.0 | 1500 | $2,300 | $1.53 | 21d | 1 | 1.12mi |
| 406 S 20th Ave Unit A Bozeman, MT | 2.0 | 1.0 | 1050 | $1,750 | $1.67 | 21d | 1 | 1.20mi |
| 111 W Lamme St Bozeman, MT | 2.0 | 1.0–2.0 | 1005 | $3,100 | $3.08 | 21d | 10 | 1.21mi |
| 3657 Laduke St Bozeman, MT | 3.0 | 2.5 | 1500 | $2,800 | $1.87 | 21d | 1 | 1.35mi |
| 2689 Blackbird Dr Unit 1 Bozeman, MT | 3.0 | 2.5 | 1725 | $3,000 | $1.74 | 21d | 1 | 1.46mi |
HOA detail
- Monthly dues
- $720 · $8,640/yr
Listing history 17 events
-
2026-06-19days on market $115,000 Active 35 DOM
-
2026-06-18days on market $115,000 Active 34 DOM
-
2026-06-17days on market $115,000 Active 33 DOM
-
2026-06-16days on market $115,000 Active 32 DOM
-
2026-06-15days on market $115,000 Active 31 DOM
-
2026-06-14days on market $115,000 Active 29 DOM
-
2026-06-13days on market $115,000 Active 28 DOM
-
2026-06-10days on market $115,000 Active 26 DOM
-
2026-06-09days on market $115,000 Active 25 DOM
-
2026-06-08days on market $115,000 Active 24 DOM
-
2026-06-07days on market $115,000 Active 23 DOM
-
2026-06-05days on market $115,000 Active 20 DOM
-
2026-06-02days on market $115,000 Active 18 DOM
-
2026-06-01days on market $115,000 Active 17 DOM
-
2026-05-31days on market $115,000 Active 16 DOM
-
2026-05-30days on market $115,000 Active 15 DOM
-
2026-05-15$115,000 Active
ⓘ Source: listings_history table (triggers on properties + properties_extension) + one-shot
backfill from property_details.listing_events for pre-trigger history.
Climate risk First Street
- Flood 1/10 Low FEMA zone X (unshaded) · 0% chance over 30 yrs
- Wildfire 1/10 Low
- Heat 2/10 Low 7 d/yr ≥88°F today · 17 d/yr by 30 yrs out
- Wind 1/10 Low
- Air quality 5/10 Major 8 unhealthy d/yr today · 8 by 30 yrs out
Nearby sold comps map
Loading sold comps map…
Walkable amenities ~0.75 mi
Loading nearby amenities…
Taxation est. · year 1
- Rental income
- $33,304
- − Mortgage interest
- −$6,442
- − Property taxes
- −$1,725
- − Insurance
- −$575
- − Repairs & maintenance
- −$2,664
- − Management
- −$2,664
- − HOA
- −$8,640
- − Depreciation
- −$3,345
- Taxable income
- $7,248
- Est. tax owed @ 24.0%
- −$1,739
- After-tax cash flow
- $6,394/yr
For passive investors: Depreciation is non-cash, so a rental often shows a tax loss while cash-flowing — sheltering income. Rental losses are passive: they offset passive income freely, and up to $25,000/yr can offset ordinary (W-2) income if you actively participate and your MAGI is under $100k (phasing out to $0 by $150k); unused losses carry forward. On sale, claimed depreciation is recaptured at up to 25%, and gains may owe capital-gains tax (a 1031 exchange can defer both). Figures are a year-1 estimate at your 24.0% rate — not tax advice; consult a CPA.
Condition & rehab AI · 29 photos
This manufactured home is in good condition with minimal repairs needed. It's move-in ready with a good curb appeal and clean interior.
Value-add opportunities
- Both Paint exterior siding — Enhances curb appeal and value
- Both Clean gutters — Improves drainage and property value
Renovation cost estimate screening
Value-add ROI direction
- Both Paint exterior siding — Enhances curb appeal and value ↑
- Both Clean gutters — Improves drainage and property value ↑
ⓘ Cost ranges are severity-bucket heuristics (US national rule-of-thumb). Get contractor quotes + a written scope before underwriting a rehab budget.
Schools (NCES district)
- District
- Bozeman Elementary
- NCES district ID
- 3004560
- Math proficiency
- 56% ▼ -5.00%
- Reading proficiency
- 66% ▼ -4.00%
- Median HH income
- $51,664
- Composite
- 52.03/100
- National rank
- #1635
- State rank
- #7 of 116 in MT
Livability — Bozeman
- Score
- 85/100
- State rank
- #1
- US rank
- #537
Category grades
Schools grade is shown separately in the Schools card above.
Census & demographics
- County
- Gallatin County · 108,510 people
- City population
- 84,228
- Metro
- Bozeman, MT
- Population (ZIP)
- 39,643
- Household income
- $88,407
- Rent vs Own
- Severe rent burden
- 1884.0
Population outlook (Gallatin County) Hauer SSP2
- Today (2025)
- 129,625 people
- By 2030
- 144,940 · +11.8%
- By 2040
- 176,266 · +36.0%
- By 2050
- 209,250 · +61.4%
- By 2075
- 294,207 · +127.0%
- By 2100
- 360,558 · +178.2%
Race, ethnicity, and origin ACS 2023
- Neighborhood character
- Predominantly White (87%)
- Race & ethnicity
- White 87% Two or more races 7% Hispanic / Latino 5% Asian 2%
- Common ancestry
- Portuguese 7% Italian 4% Slovak 3%
- Foreign-born
- 5% · Canada, China
- Languages at home
- 94% English-only · Spanish 2% Chinese 1% Other Indo-European 1%
Political lean MEDSL · Gallatin
- 2024 margin
- Toss-up / Even · D 50.0% · R 46.8% · Other 3.2%
- 2008→2024 swing
- -0.2pp no change · 2008: 3.4pp · 2024: 3.2pp
- All cycles
- 2024: D+3.2 2020: D+7.5 2016: D+1.0 2012: R+5.3 2008: D+3.4
Not yet ingested
- Civics
- —
Market trends
- HPI YoY
- ▼ -410.90%
- Current HPI
- 276.5017
- Rent YoY
- ▲ 0.20%
- Metro
- Bozeman, MT
- State GDP YoY
- ▲ 3.41%
- F500 in state
- 2
Industry mix (Fortune 500 HQ in MT)
| Industry | F500 HQs | Revenue |
|---|---|---|
| Technology / Analytics | 1 | $2B |
|
||
Price history
1 event — show timeline
- 2026-05-15 Listed $115,000 MRMLS
Cash-flow waterfall
monthlySold comps — $/sqft
last 12 mo · ≤1 miLoading sold comps…