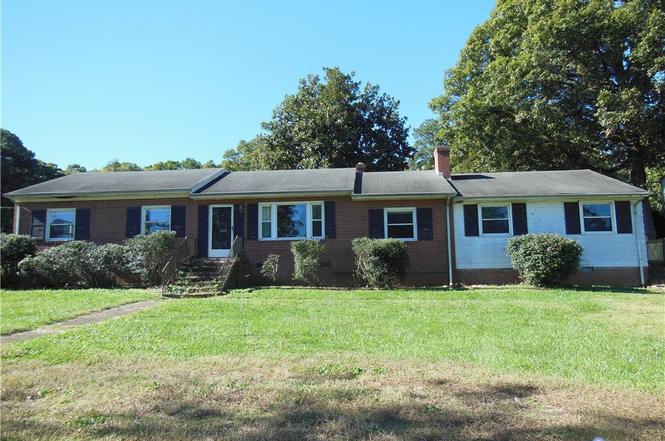
6310 Dalebrook Dr · Meadowbrook, VA
Flood risk 1/10 · Minimal
- FEMA flood zone
- X (unshaded)
- Chance of flooding over 30 yrs
- 0.0%
- Est. flood insurance / yr
- $507 – $1,088
Fire risk 1/10 · Minimal
- Est. fire insurance / yr
- $666 – $1,236
Heat risk 8/10 · Major
- Hot days now (above 106°F)
- 7 days/yr
- Hot days in 30 yrs
- 16 days/yr
Wind risk 6/10 · Moderate
- Chance of severe wind over 30 yrs
- 27.0%
Air-quality risk 2/10 · Minimal
- Unhealthy air days now
- 0 days/yr
- Unhealthy air days in 30 yrs
- 1 days/yr
Risk factors via First Street. Map © Google.
Why this score? — see what drove the D+ grade
The composite is a weighted blend of 9 inputs, each scored 0–100. Each bar is that input's sub-score; the figure is the points it added to the 100-point composite (weight × sub-score).
- ARV discount +15.0/15.0
- Cash flow +13.3/30.0
- Schools +5.2/10.0
- DSCR +4.0/10.0
- Livability +3.7/5.0
- 1% rule +3.1/10.0
- Rent growth +3.0/5.0
- Condition / age +2.5/5.0
- Appreciation +0.0/10.0
$279,900
🖨 Deal sheet (PDF) 📄 Offer letter ✓ Due diligence
Listing remarks
Nice Price Adjustment to $279,900 !!! It's never too late to own Real Estate. With some handy work and updating, you can turn this Ranch-style into a fantastic home for your family. Your Living Room is right at the entrance where you will greet and entertain your guests. The Eat-In Kitchen will be the center of your family universe. The adjoining Dining Room is loaded with Built-In Cabinets. Off the Kitchen is a large Family Room with a Masonry Fireplace and Wood Stove. A Laundry Room completes the area. Then. .. there's more. .. a huge Bonus Room with it's own side entrance could be used for an office or Day Care. The sleeping area includes 3 bedrooms and a full tub bath. The Primary Bedro
Key facts
- Wood stove
- Masonry fireplace
- Ranch-style
Tags
Neighborhood map
What this means for you Summary
Snapshot
- This is a 3-bed/1.5-bath single-family listed at $280k.
Deal economics
- At list price, monthly cash flow is $-1 ($-15/yr) — negative.
- To cash-flow at today's rent, offer at most $280k (0.1% below list).
- To meet the 1% rule (rent ≥ 1% of price), the offer needs to be $228k (18.6% below list).
- Recommended offer: $228k (18.6% below list) — sets the bar for 1% rule.
- Cap rate 6.3% vs local median 3.9% in Meadowbrook — top-decile yield for the area; either an underpriced asset or a hidden risk that comps aren't pricing in. Stress-test before assuming the spread holds.
Location & tenants
- Location reads 73/100 on livability (#161 in VA) — a middle-class / working-renter tenant base. Strengths: housing A+, health & safety A+, cost of living A-; Watch: amenities F, commute F.
- Chesterfield County Public School District (suburban): math 52% / reading 64% proficiency, ranked #57 of 131 in VA (top 44%) — acceptable for families but not a draw, mixed tenant base, ~2y average lease.
- Zoned schools: Hopkins Road Elementary (math 32% / reading 47%, grade F, #900 of 1,108 statewide, top 83%, 773 students, 81% FRL); Falling Creek Middle (math 28% / reading 46%, grade F, #319 of 342 statewide, top 93%, 1,419 students, 80% FRL); Meadowbrook High (math 22% / reading 65%, grade F, #314 of 319 statewide, top 98%, 2,033 students, 79% FRL) — zoned schools average 80% FRL vs 26% district-wide (54 pts higher); higher-poverty schools than district average — tighter screening recommended.
- Zoned-school proficiency averages 40% at this address vs 58% district-wide (-18 pts) — the specific schools serving this property underperform the Chesterfield County Public School District average; the district grade overstates school quality for this exact location.
- Market conditions: Rents rising (+1.9%/yr); 234 active listings in the ZIP; 5 comparable units currently listed for rent nearby; rentals at typical pace (median 19d on market — plan ~3-4 weeks tenant-placement turnaround); 2,307 units permitted in Chesterfield County in 2024 (462 in 5+ unit buildings).
- This rent runs 41% of the median local income ($67k/yr) — at the standard rent-burdened threshold; future hikes will face affordability resistance.
Forward outlook
- Local home prices are declining (-3.0%/yr); year-one equity from $2k of loan paydown is wiped out by about $8k of value loss. Plan a longer hold.
- Chesterfield County population projected at +20% by 2050 — long-run rental-demand tailwind backs the buy-and-hold thesis.
Negotiation context
- It's been on market 164 days — a 12% lower offer ($246k) is reasonable based on typical stale-listing flexibility.
- 2 sale attempts; this cycle's ask has dropped $20k (7%) from the opening price — seller is motivated, your offer sets the floor, not the list.
- Current owner paid $88k; list at $280k implies a 218% gain — meaningful room to come down on a strong offer.
Risks & watch-outs
- Climate carrying-cost: major wind risk, 27% chance of damaging wind over 30y; extreme-heat days projected 7→16/yr by 2055 (HVAC capex compounding) — expect insurance premiums to compound above CPI over the hold.
Questions for the listing agent
- What do current leases actually rent for vs. the listed asking? Can we see a recent rent roll and the last 12 months of T-12 income?
- It's been on market 164 days. Have you received any prior offers? Is the seller open to a 19% concession, seller financing, or rate buy-down credit?
- Built in 1960 — when were the roof, HVAC, electrical panel, plumbing, and water heater last replaced?
- Why hasn't it sold? Are there any deal-killer items the seller is aware of (foundation, flood, title, zoning, code violations)?
- Is there a deadline driving the sale (1031 exchange, divorce, estate, relocation)? That informs how much negotiation room exists.
- Schools are B-rated — typically a magnet for longer-tenancy family renters. What's the average tenant stay here, and is there a school-zone premium baked into asking?
- The area grade is low — what's the realistic commute time and amenity access for the typical tenant pool here? Any planned neighborhood developments (good or bad) we should know about?
- What's the average days-on-market for RENTAL listings here right now (not sales)? A rising rental-DOM trend means longer vacancies and softer asking-rent achievability than the comps imply.
- What's the recent tenant-quality profile in this submarket — average credit score on applications, eviction rate, late-payment / NSF rate, and stable-employment percentage? A property-management company in the area should have these aggregated.
- How much new for-sale + rental construction is in the pipeline within 1–3 miles? Heavy new supply typically softens prices + rents 12–24 months out; constrained supply supports both.
Investment metrics
- 1% rule
- 0.81% ✗
- Cap rate
- 6.29%
- Cash-on-cash
- -0.02%
- DSCR
- 1.00
- GRM
- 10.2
CMA / ARV
- ARV (on-the-fly)
- $351,050
- Comps found
- 12
Show comp detail 12 sales within ~0.75 mi
| Address | Dist | Beds/Ba | Sqft | Sold | Price | $/sf | Match |
|---|---|---|---|---|---|---|---|
| 3737 Frankmont Rd | 0.27mi | 4/2.0 (+1) | 2,102 (+5%) | 1mo | $365,000 | $174 | 71 |
| 6437 Moon Ln | 0.25mi | 4/2.0 (+1) | 1,938 (-3%) | 8mo | $340,000 | $175 | 69 |
| 6013 Daleshire Dr | 0.13mi | 3/2.0 | 1,725 (-14%) | 3mo | $330,000 | $191 | 66 |
| 5937 Dunnshire Rd | 0.35mi | 3/2.0 | 1,852 (-8%) | 5mo | $315,000 | $170 | 65 |
| 4007 Lawnwood Dr | 0.29mi | 3/2.0 | 1,725 (-14%) | 6mo | $360,000 | $209 | 56 |
| 6412 Lythgoe Ave | 0.49mi | 4/2.0 (+1) | 1,938 (-3%) | 11mo | $310,000 | $160 | 56 |
| 6925 Conifer Road Rd | 0.69mi | 4/2.0 (+1) | 2,028 (+1%) | 6mo | $368,800 | $182 | 54 |
| 4021 Cogbill Rd | 0.51mi | 3/2.5 | 2,177 (+8%) | 7mo | $430,000 | $198 | 52 |
| 6312 Philbrook Rd | 0.41mi | 4/2.0 (+1) | 1,788 (-11%) | 8mo | $292,000 | $163 | 49 |
| 3801 Applewood Rd | 0.51mi | 4/2.0 (+1) | 2,208 (+10%) | 10mo | $400,000 | $181 | 44 |
| 3609 Cogbill Rd | 0.64mi | 4/2.0 (+1) | 2,225 (+11%) | 6mo | $367,500 | $165 | 40 |
| 4424 Watchrun Dr | 0.72mi | 4/2.0 (+1) | 1,788 (-11%) | 7mo | $285,000 | $159 | 36 |
Match score weights: distance 35% · size 25% · config 20% · recency 20%. Top-matched comps best support the ARV.
Projected returns pro-forma
-3.0% appreciation · 1.93% rent growth · sell at horizon
- IRR
- -17.5%
- Equity multiple
- 0.39×
- Total profit
- $-47,909
- Equity at exit
- $41,734
- IRR
- -11.6%
- Equity multiple
- 0.34×
- Total profit
- $-51,760
- Equity at exit
- $24,201
Cash invested: $78,372 (down + closing). Projections, not guarantees.
Landlord ↔ Tenant lean methodology
- Overall (STATE)
- 55 Moderately Landlord-Leaning
- State Virginia
- 55 Moderately Landlord-Leaning · D+2
- County
- — inherits STATE
- City
- — inherits STATE
ZIP-level market 23234
- Rents YoY
- 1.9%
- Active inventory
- 234
- Price-to-rent
- 10.2×
Monthly cashflow live
- Estimated rent
- $2,280 high interval (Pro) →
- Mortgage (P&I)
- −$1,468
- Tax from tax record
- −$218 /mo · $2,612/yr
- Insurance
- −$117
- HOA
- −$0
- Vacancy / Maint / Mgmt
- −$479
- Net cashflow
- $-1
Break-even live
Sensitivity live
| Price | -10% $157 | -5% $78 | +0% $-1 | +5% $-80 | +10% $-160 |
|---|---|---|---|---|---|
| Rent | -10% $-181 | -5% $-91 | +0% $-1 | +5% $89 | +10% $179 |
| Rate | -1.0pp $140 | -0.5pp $70 | base $-1 | +0.5pp $-74 | +1.0pp $-148 |
UW: 25.0% down · 7.5% · 30yr · 1.5% tax · 5.0% vac · 8.0% maint · 8.0% mgmt
Financing live
Cash to close
- Down payment
- $69,975
- Closing costs
- $8,397
- Reserves months
- —
- Total cash needed
- —
Loan-product check · same deal, 3 products live
Conventional
25% down · 7.5% · 30yr
- Down + closing
- —
- Monthly P&I
- —
- Monthly cashflow
- —
- DSCR
- —
- Eligible?
- —
Personal DTI + credit; lowest rate.
DSCR
20% down · 8.5% · 30yr
- Down + closing
- —
- Monthly P&I
- —
- Monthly cashflow
- —
- DSCR
- —
- Eligible?
- —
No personal income docs; deal must DSCR.
Hard money
10% down · 12.0% · 12mo
- Down + closing
- —
- Monthly P&I
- —
- Monthly cashflow
- —
- DSCR
- —
- Eligible?
- —
Short-term bridge; refi at stabilization.
Rent comps 5 comps
| Address | Beds | Baths | Sqft | Rent | $/sqft | DOM | Units | Dist |
|---|---|---|---|---|---|---|---|---|
| 3907 Harvette Dr North Chesterfield, VA | 4.0 | 2.5 | 1700 | $2,600 | $1.53 | 19d | 1 | 0.80mi |
| 4502 Cinderwood Dr North Chesterfield, VA | 3.0 | 2.0 | 1540 | $2,200 | $1.43 | 19d | 1 | 1.10mi |
| 5314 Whetstone Rd Richmond, VA | 1.0–4.0 | 1.0–2.5 | 1029 | $1,833 | $1.78 | 0d | 1 | 1.14mi |
| 3814 Falstone Rd Unit N Richmond, VA | 3.0 | 1.5 | 1776 | $2,295 | $1.29 | 46d | 1 | 1.23mi |
| 3754 Sterling Woods Ln North Chesterfield, VA | 3.0 | 2.5 | 2293 | $2,800 | $1.22 | 25d | 1 | 1.37mi |
Listing history 6 events
-
2026-04-22status Pending
-
2026-02-19price $279,900
-
2026-01-07status Active
-
2025-12-16status Pending
-
2025-10-17$299,900 Active
-
1995-11-17soldstatus $87,950
ⓘ Source: listings_history table (triggers on properties + properties_extension) + one-shot
backfill from property_details.listing_events for pre-trigger history.
Tax reassessment forecast VA · Resets to sale price
- Current annual tax
- $2,612 · $218/mo
- Projected year-2 tax
- $2,612 · $218/mo
- Expected delta
- $0/yr ($0/mo · 0.0%)
ⓘ Screening estimate from a state-policy table — verify with the county assessor before closing.
Climate risk First Street
- Flood 1/10 Low FEMA zone X (unshaded) · 0% chance over 30 yrs
- Wildfire 1/10 Low
- Heat 8/10 Severe 7 d/yr ≥106°F today · 16 d/yr by 30 yrs out
- Wind 6/10 Major 27% chance of damaging wind over 30 yrs
- Air quality 2/10 Low 0 unhealthy d/yr today · 1 by 30 yrs out
Nearby sold comps map
Loading sold comps map…
Walkable amenities ~0.75 mi
Loading nearby amenities…
Taxation est. · year 1
- Rental income
- $27,356
- − Mortgage interest
- −$15,679
- − Property taxes
- −$2,612
- − Insurance
- −$1,400
- − Repairs & maintenance
- −$2,188
- − Management
- −$2,188
- − Depreciation
- −$8,143
- Taxable loss
- −$4,854
- Est. tax savings @ 24.0%
- +$1,165
- After-tax cash flow
- $1,150/yr
For passive investors: Depreciation is non-cash, so a rental often shows a tax loss while cash-flowing — sheltering income. Rental losses are passive: they offset passive income freely, and up to $25,000/yr can offset ordinary (W-2) income if you actively participate and your MAGI is under $100k (phasing out to $0 by $150k); unused losses carry forward. On sale, claimed depreciation is recaptured at up to 25%, and gains may owe capital-gains tax (a 1031 exchange can defer both). Figures are a year-1 estimate at your 24.0% rate — not tax advice; consult a CPA.
Schools (NCES district)
- District
- Chesterfield County Public School District
- NCES district ID
- 5100840
- Math proficiency
- 52% ▼ -30.00%
- Reading proficiency
- 64% ▼ -15.00%
- Median HH income
- $72,821
- Composite
- 51.56/100
- National rank
- #1712
- State rank
- #57 of 131 in VA
Livability — Meadowbrook
- Score
- 73/100
- State rank
- #161
- US rank
- #5004
Category grades
Schools grade is shown separately in the Schools card above.
Census & demographics
- Census place
- Meadowbrook, VA
- County
- Chesterfield County · 406,988 people
- City population
- 46,284
- Metro
- Richmond, VA
- Population (ZIP)
- 47,465
- Household income
- $66,619
- Rent vs Own
- Severe rent burden
- 2031.0
Population outlook (Chesterfield County) Hauer SSP2
- Today (2025)
- 377,190 people
- By 2030
- 395,710 · +4.9%
- By 2040
- 427,694 · +13.4%
- By 2050
- 452,706 · +20.0%
- By 2075
- 505,533 · +34.0%
- By 2100
- 521,282 · +38.2%
Race, ethnicity, and origin ACS 2023
- Neighborhood character
- Diverse neighborhood (Simpson 0.67)
- Race & ethnicity
- Black 46% Hispanic / Latino 30% White 18% Two or more races 9% Asian 2%
- Hispanic origin (detail)
- Mexican 5% Puerto Rican 3%
- Common ancestry
- Italian 1%
- Foreign-born
- 20% · Canada
- Languages at home
- 69% English-only · Spanish 26% Other Indo-European 1% Tagalog/Filipino 1%
Political lean MEDSL · Chesterfield
- 2024 margin
- Lean D (+9.0) · D 53.8% · R 44.8% · Other 1.4%
- 2008→2024 swing
- +16.4pp toward D · 2008: -7.5pp · 2024: 9.0pp
- All cycles
- 2024: D+9.0 2020: D+6.7 2016: R+2.2 2012: R+7.1 2008: R+7.5
Not yet ingested
- Civics
- —
Market trends
- HPI YoY
- ▼ -205.50%
- Current HPI
- 317.6006
- Rent YoY
- ▲ 1.93%
- Metro
- Richmond, VA
- State GDP YoY
- ▲ 2.40%
- F500 in state
- 50
Industry mix (Fortune 500 HQ in VA)
| Industry | F500 HQs | Revenue |
|---|---|---|
| Aerospace / Defense | 4 | $236B |
|
||
| Technology / Defense | 3 | $32B |
|
||
| Financial Services | 2 | $176B |
|
||
| Utilities | 2 | $27B |
|
||
| Insurance | 2 | $25B |
|
||
| Technology | 2 | $15B |
|
||
Price history
+218.2% since first listed6 events — show timeline
- 2026-04-22 Pending — CVRMLS
- 2026-02-19 Price Changed $279,900 CVRMLS
- 2026-01-07 Relisted — CVRMLS
- 2025-12-16 Pending — CVRMLS
- 2025-10-17 Listed $299,900 CVRMLS
- 1995-11-17 Sold (Public Records) $87,950 Public Records
Property tax history
+78.8%/yrLatest (2025): $2,612 · +8.3% YoY. Source: county tax records.
Cash-flow waterfall
monthlySold comps — $/sqft
last 12 mo · ≤1 miLoading sold comps…