 Multi-family
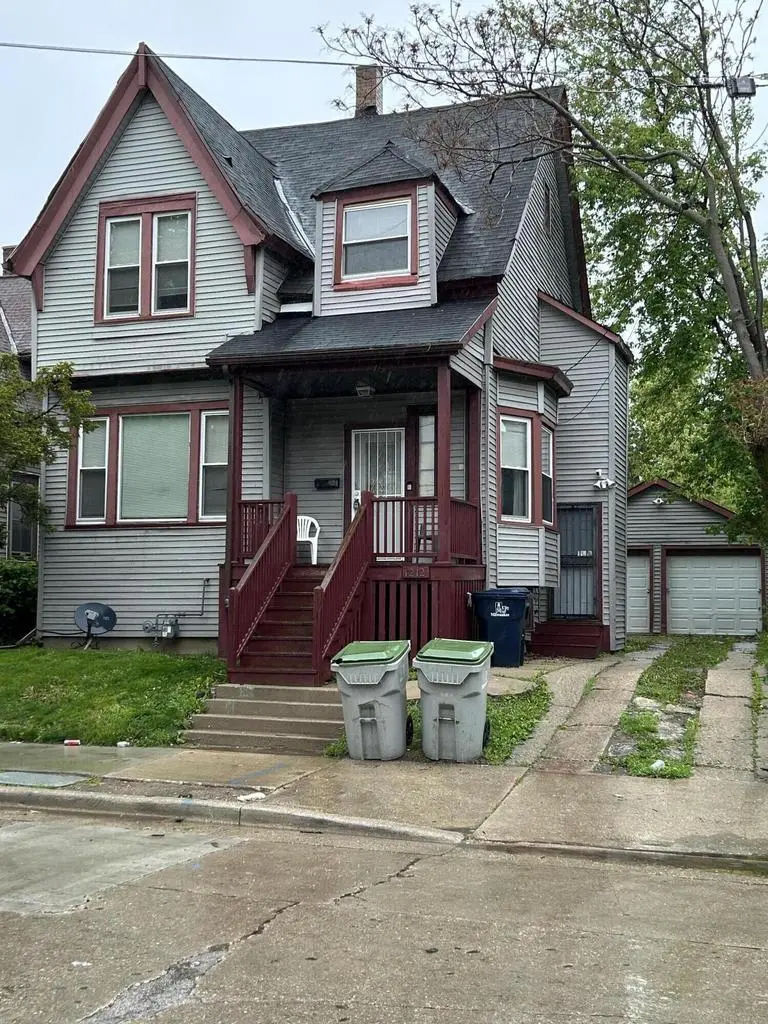
1212 W Chambers St · Milwaukee, WI
Flood risk 4/10 · Minor
- FEMA flood zone
- X (unshaded)
- Chance of flooding over 30 yrs
- 0.2%
- Est. flood insurance / yr
- $473 – $860
Fire risk 1/10 · Minimal
- Est. fire insurance / yr
- $636 – $1,182
Heat risk 2/10 · Minimal
- Hot days now (above 98°F)
- 7 days/yr
- Hot days in 30 yrs
- 13 days/yr
Wind risk 2/10 · Minimal
- Chance of severe wind over 30 yrs
- —
Air-quality risk 3/10 · Minor
- Unhealthy air days now
- 3 days/yr
- Unhealthy air days in 30 yrs
- 4 days/yr
Risk factors via First Street. Map © Google.
Why this score? — see what drove the D- grade
The composite is a weighted blend of 9 inputs, each scored 0–100. Each bar is that input's sub-score; the figure is the points it added to the 100-point composite (weight × sub-score).
- Appreciation +10.0/10.0
- Cash flow +9.8/30.0
- Rent growth +4.6/5.0
- Livability +4.0/5.0
- DSCR +2.8/10.0
- Condition / age +2.5/5.0
- 1% rule +1.9/10.0
- Schools +1.2/10.0
- ARV discount +0.0/15.0
$167,500
🖨 Deal sheet (PDF) 📄 Offer letter ✓ Due diligence
Multi-family units
County records classify this as Multi-Family (2-4 Unit). Listing-text estimate: 1 unit. estimate disagrees with records
Listing remarks MLS
Welcome to this large home in Milwaukee under $100k! Featuring FIVE generously sized BEDROOMS and TWO FULL BATHROOMS. Currently licensed as a group home and generating over $15,000 per month--even while only partially occupied--this unique offering presents an exceptional investment prospect for the discerning buyer. Whether you are seeking a revenue-generating asset or simply a home with ample room to grow, this property delivers on both fronts. Don't miss this chance to secure a property with real profit potential or the perfect setting for comfortable living. Seller prefers cash offer and quick closing. Make your appointment today!
Key facts
- New floors
- New kitchen
- Private back yard
Tags
Property features AI
Exterior
- Parking: Detached 2-car garage; Approximately 2.5 garage parking spaces
- Utilities: Municipal water; Municipal sewer; Natural gas
- Home design: Two-story single-family home; Less than 1/2 acre lot
- Construction: Vinyl construction
- Exterior features: Patio; Fenced yard; Vinyl exterior; Sidewalks
Interior
- Kitchen: Pantry
- Bedrooms: Primary bedroom (Upper) — 15 x 13; Bedroom 2 (Main) — 13 x 9; Bedroom 3 (Main) — 11 x 10; Bedroom 4 (Upper) — 13 x 11; Bedroom 5 (Upper) — 10 x 10
- Bathrooms: Two full bathrooms; Ceramic tile; Tub only; Shower over tub; Shower stall
- Heating & cooling: Forced air heating; Natural gas
- Interior features: Cable/satellite available; High-speed internet; Pantry
- Laundry & utility: Full basement partially finished with poured concrete
Neighborhood map
What this means for you Summary
Snapshot
- This is a 3-bed/2.0-bath multifamily listed at $168k.
Deal economics
- At list price, monthly cash flow is $-108 ($-1k/yr) — negative.
- To cash-flow at today's rent, offer at most $148k (11.4% below list).
- To meet the 1% rule (rent ≥ 1% of price), the offer needs to be $116k (31.0% below list).
- Recommended offer: $116k (31.0% below list) — sets the bar for 1% rule.
Location & tenants
- Location reads 81/100 on livability (#55 in WI, #1,534 nationally) — a professional / high-income tenant draw. Strengths: amenities A+, commute A+, cost of living A+; Watch: employment D+, schools F, crime F.
- Milwaukee School District (urban): math 10% / reading 18% proficiency, ranked #337 of 342 in WI (top 98%) — low school quality limits family demand, transient renter base, plan for 1-2y turnover; 77% free/reduced lunch — lower-income household profile, screen leases tightly.
- Market conditions: Rents rising fast (+8.3%/yr); 160 active listings in the ZIP; 40 comparable units currently listed for rent nearby; rentals at typical pace (median 26d on market — plan ~3-4 weeks tenant-placement turnaround); 42% of comp listings sitting > 30 days — soft ceiling on asking rent; lower-income renter base — watch delinquency; 1,017 units permitted in Milwaukee County in 2024 (803 in 5+ unit buildings).
- At $1,156/mo this rent would consume 47% of the median local household income ($29k/yr) (locally 2061% of renters already pay >50% of income on rent) — very limited rent-growth headroom before tenants either downsize or default.
Forward outlook
- In year one you build about $18k of equity ($1k loan paydown + $17k appreciation (10.0% local appreciation)).
- Milwaukee County population projected at +4% by 2050 — modest demand growth; plan on rents tracking national, not racing it.
- By year 3, paydown + projected appreciation supports a ~$45k cash-out refi (75% LTV) — recoverable capital for the next deal without selling this one.
Negotiation context
- Only 14 days on market — expect competitive offers; lowballing is unlikely to land.
- 2 sale attempts with the ask held roughly flat each time — persistent listings suggest the price (not the market) is what's stuck; bring a comps-based counter.
- Current owner paid $73k; list at $168k implies a 129% gain — meaningful room to come down on a strong offer.
Risks & watch-outs
- Watch-outs: built in 1913 — expect roof / HVAC / electrical / plumbing capex.
Questions for the listing agent
- What do current leases actually rent for vs. the listed asking? Can we see a recent rent roll and the last 12 months of T-12 income?
- Built in 1913 — when were the roof, HVAC, electrical panel, plumbing, and water heater last replaced?
- Is there a deadline driving the sale (1031 exchange, divorce, estate, relocation)? That informs how much negotiation room exists.
- Schools are F-rated, which usually means shorter tenancies and higher turnover. Who's the typical renter profile here, and what's been the actual vacancy rate?
- Crime grade is F in this area — have there been break-ins, vandalism, or insurance claims at this property in the last 3 years? What carrier currently insures it and at what premium?
- The area grade is low — what's the realistic commute time and amenity access for the typical tenant pool here? Any planned neighborhood developments (good or bad) we should know about?
- What's the average days-on-market for RENTAL listings here right now (not sales)? A rising rental-DOM trend means longer vacancies and softer asking-rent achievability than the comps imply.
- What's the recent tenant-quality profile in this submarket — average credit score on applications, eviction rate, late-payment / NSF rate, and stable-employment percentage? A property-management company in the area should have these aggregated.
- How much new apartment / multifamily construction is in the pipeline within 1–3 miles? Heavy new supply (>2% of stock underway) typically softens rents 12–24 months out; light construction supports rent growth.
Investment metrics
- 1% rule
- 0.69% ✗
- Cap rate
- 5.52%
- Cash-on-cash
- -2.76%
- DSCR
- 0.88
- GRM
- 12.1
CMA / ARV
- ARV (on-the-fly)
- $135,800
- Comps found
- 8
Show comp detail 8 sales within ~0.75 mi
| Address | Dist | Beds/Ba | Sqft | Sold | Price | $/sf | Match |
|---|---|---|---|---|---|---|---|
| 2901 N Mother Simpson Way | 0.20mi | 3/2.0 | 1,172 (-14%) | 1mo | $24,000 | $20 | 67 |
| 3204 N 14th St | 0.26mi | 3/2.0 | 1,300 (-4%) | 21mo | $130,000 | $100 | 64 |
| 3039 N 10th Ln | 0.13mi | 4/2.0 (+1) | 1,500 (+10%) | 12mo | $70,000 | $47 | 62 |
| 3349 N 16th St #3351 | 0.52mi | 4/2.0 (+1) | 1,288 (-5%) | 2mo | $195,000 | $151 | 60 |
| 2635 N 6th St | 0.62mi | 3/2.0 | 1,418 (+4%) | 7mo | $360,000 | $254 | 58 |
| 3147 N 13th St #3149 | 0.19mi | 3/2.0 | 1,543 (+14%) | 23mo | $132,500 | $86 | 49 |
| 3351 N 6th St Unit 3351A | 0.63mi | 4/2.0 (+1) | 1,538 (+13%) | 4mo | $93,000 | $60 | 40 |
| 2840 N Vel R Phillips Ave | 0.64mi | 4/2.0 (+1) | 1,500 (+10%) | 13mo | $160,000 | $107 | 37 |
Match score weights: distance 35% · size 25% · config 20% · recency 20%. Top-matched comps best support the ARV.
Projected returns pro-forma
10.0% appreciation · 8.0% rent growth · sell at horizon
- IRR
- 23.7%
- Equity multiple
- 2.93×
- Total profit
- $90,386
- Equity at exit
- $150,897
- IRR
- 22.2%
- Equity multiple
- 7.11×
- Total profit
- $286,581
- Equity at exit
- $325,416
Cash invested: $46,900 (down + closing). Projections, not guarantees.
Landlord ↔ Tenant lean methodology
- Overall (STATE)
- 73 Landlord-Friendly
- State Wisconsin
- 73 Landlord-Friendly · R+2
- County
- — inherits STATE
- City
- — inherits STATE
ZIP-level market 53206
- Rents YoY
- 8.3%
- Active inventory
- 160
- Price-to-rent
- 12.1×
Monthly cashflow live
- Estimated rent
- $1,156 high interval (Pro) →
- Mortgage (P&I)
- −$878
- Tax from tax record
- −$73 /mo · $874/yr
- Insurance
- −$70
- HOA
- −$0
- Vacancy / Maint / Mgmt
- −$243
- Net cashflow
- $-108
Break-even live
Sensitivity live
| Price | -10% $-13 | -5% $-61 | +0% $-108 | +5% $-155 | +10% $-203 |
|---|---|---|---|---|---|
| Rent | -10% $-199 | -5% $-154 | +0% $-108 | +5% $-62 | +10% $-17 |
| Rate | -1.0pp $-24 | -0.5pp $-65 | base $-108 | +0.5pp $-151 | +1.0pp $-196 |
UW: 25.0% down · 7.5% · 30yr · 1.5% tax · 5.0% vac · 8.0% maint · 8.0% mgmt
Financing live
Cash to close
- Down payment
- $41,875
- Closing costs
- $5,025
- Reserves months
- —
- Total cash needed
- —
Loan-product check · same deal, 3 products live
Conventional
25% down · 7.5% · 30yr
- Down + closing
- —
- Monthly P&I
- —
- Monthly cashflow
- —
- DSCR
- —
- Eligible?
- —
Personal DTI + credit; lowest rate.
DSCR
20% down · 8.5% · 30yr
- Down + closing
- —
- Monthly P&I
- —
- Monthly cashflow
- —
- DSCR
- —
- Eligible?
- —
No personal income docs; deal must DSCR.
Hard money
10% down · 12.0% · 12mo
- Down + closing
- —
- Monthly P&I
- —
- Monthly cashflow
- —
- DSCR
- —
- Eligible?
- —
Short-term bridge; refi at stabilization.
Rent comps 40 comps
| Address | Beds | Baths | Sqft | Rent | $/sqft | DOM | Units | Dist |
|---|---|---|---|---|---|---|---|---|
| 3045 N 11th St #3047 Milwaukee, WI | 3.0 | 1.0 | 1065 | $1,175 | $1.10 | 6d | 1 | 0.11mi |
| 1326 W Burleigh St Unit 1326 Lower Milwaukee, WI | 2.0 | 1.0 | 900 | $825 | $0.92 | 4d | 1 | 0.16mi |
| 2955 N 17th St Unit B UPSTAIRS Milwaukee, WI | 2.0 | 1.0 | 1000 | $900 | $0.90 | 19d | 1 | 0.39mi |
| 3298 N 13th St Milwaukee, WI | 3.0 | 1.0 | 885 | $895 | $1.01 | 45d | 1 | 0.40mi |
| 3025 N 6th St Milwaukee, WI | 2.0 | 1.0 | 1153 | $1,125 | $0.98 | 45d | 1 | 0.43mi |
| 3416 N 17th St Unit 1 Milwaukee, WI | 3.0 | 1.0 | 1200 | $1,100 | $0.92 | 45d | 1 | 0.58mi |
| 2945 N 23rd St Milwaukee, WI | 3.0 | 1.0 | 1014 | $1,195 | $1.18 | 45d | 1 | 0.73mi |
| 221 W Ring St Milwaukee, WI | 3.0 | 1.0 | 1170 | $1,498 | $1.28 | 0d | 1 | 0.76mi |
| 2577 N Vel R Phillips Ave Milwaukee, WI | 3.0 | 1.0 | 1048 | $1,400 | $1.34 | 19d | 1 | 0.76mi |
| 2741 N 23rd St Milwaukee, WI | 3.0 | 1.0 | 900 | $1,050 | $1.17 | 16d | 1 | 0.79mi |
| 2741 N 23rd St Unit 2 Milwaukee, WI | 3.0 | 1.0 | 1000 | $1,100 | $1.10 | 19d | 1 | 0.79mi |
| 2407 N 6th St Milwaukee, WI | 2.0 | 1.0 | 897 | $1,100 | $1.23 | 45d | 1 | 0.84mi |
| 3156 N 1st St Milwaukee, WI | 2.0 | 1.0 | 900 | $895 | $0.99 | 45d | 1 | 0.85mi |
| 2719 N 1st St Milwaukee, WI | 2.0 | 1.0 | 1300 | $1,095 | $0.84 | 16d | 1 | 0.86mi |
| 2308 W Clarke St Milwaukee, WI | 4.0 | 2.0 | 1545 | $1,750 | $1.13 | 25d | 1 | 0.88mi |
| 2630 N 24th St Milwaukee, WI | 2.0 | 1.0 | 934 | $1,450 | $1.55 | 22d | 1 | 0.88mi |
| 3646 N 19th St Milwaukee, WI | 2.0 | 1.0 | 935 | $1,100 | $1.18 | 6d | 1 | 0.88mi |
| 2106A W Keefe Ave Unit 2106 Lower Milwaukee, WI | 3.0 | 1.0 | 1300 | $1,100 | $0.85 | 19d | 1 | 0.89mi |
| 3747 N 16th St Milwaukee, WI | 2.0 | 1.0 | 1200 | $875 | $0.73 | 45d | 1 | 0.91mi |
| 3042 N Palmer St #5 Milwaukee, WI | 3.0 | 1.0 | 1718 | $1,050 | $0.61 | 25d | 1 | 0.91mi |
| 2808 N Palmer St Unit Lower Milwaukee, WI | 2.0 | 1.0 | 1200 | $875 | $0.73 | 45d | 1 | 0.93mi |
| 223 E Burleigh St Unit 223 Milwaukee, WI | 4.0 | 1.0 | 1153 | $1,395 | $1.21 | 45d | 1 | 0.93mi |
| 3600 N Vel R. Phillips Ave Milwaukee, WI | 2.0 | 1.0 | 900 | $950 | $1.06 | 6d | 1 | 0.94mi |
| 2724 N Palmer St Milwaukee, WI | 3.0 | 1.0 | 900 | $1,300 | $1.44 | 45d | 1 | 0.96mi |
| 2765 N 26th St Unit 1 Milwaukee, WI | 3.0 | 1.0 | 1125 | $1,200 | $1.07 | 6d | 1 | 1.01mi |
| 2765 N 26th St Unit 2 Milwaukee, WI | 2.0 | 1.0 | 1100 | $1,100 | $1.00 | 6d | 1 | 1.01mi |
| 3373 N Richards St Milwaukee, WI | 2.0 | 1.0 | 950 | $1,150 | $1.21 | 25d | 1 | 1.09mi |
| 3255 N Buffum St Unit 3255 Upper Milwaukee, WI | 2.0 | 1.0 | 1100 | $1,350 | $1.23 | 45d | 1 | 1.09mi |
| 3029 N Holton St Milwaukee, WI | 3.0 | 1.0 | 980 | $1,200 | $1.22 | 45d | 1 | 1.09mi |
| 3352 N Richards St Unit Second floor Milwaukee, WI | 2.0 | 1.0 | 1000 | $1,150 | $1.15 | 45d | 1 | 1.10mi |
| 3927-3929 N 17th St Milwaukee, WI | 2.0 | 1.0 | 900 | $1,195 | $1.33 | 45d | 1 | 1.10mi |
| 3703 N 1st St Unit Upper-3705 Milwaukee, WI | 3.0 | 1.0 | 1034 | $1,200 | $1.16 | 45d | 1 | 1.10mi |
| 2716A N Buffum St Milwaukee, WI | 2.0 | 1.0 | 1100 | $1,200 | $1.09 | 23d | 1 | 1.10mi |
| 312 E Townsend St Unit 312 Milwaukee, WI | 3.0 | 1.0 | 1400 | $1,250 | $0.89 | 25d | 1 | 1.13mi |
| 2536 N Richards St Unit 1ST Milwaukee, WI | 2.0 | 1.0 | 1200 | $950 | $0.79 | 45d | 1 | 1.14mi |
| 620 W Melvina St Milwaukee, WI | 3.0 | 1.0 | 1360 | $1,495 | $1.10 | 0d | 1 | 1.14mi |
| 2870 N 29th St #2872 Milwaukee, WI | 3.0 | 1.0 | 1300 | $1,250 | $0.96 | 45d | 1 | 1.14mi |
| 3388 N 27th St Unit 3388 Front House Milwaukee, WI | 4.0 | 1.0 | 1212 | $1,550 | $1.28 | 6d | 1 | 1.15mi |
| 3908 N 6th St Milwaukee, WI | 2.0 | 1.0 | 1100 | $1,150 | $1.05 | 25d | 1 | 1.16mi |
| 3911 N 20th St Unit 3913 Milwaukee, WI | 2.0 | 1.0 | 950 | $995 | $1.05 | 25d | 1 | 1.17mi |
Listing history 10 events
-
2026-06-21days on market $167,500 Active 14 DOM
-
2026-06-18days on market $167,500 Active 11 DOM
-
2026-06-17days on market $167,500 Active 10 DOM
-
2026-06-16days on market $167,500 Active 9 DOM
-
2026-06-15days on market $167,500 Active 8 DOM
-
2026-06-13days on market $167,500 Active 6 DOM
-
2026-06-13days on market $167,500 Active 5 DOM
-
2026-06-09days on market $167,500 Active 2 DOM
-
2026-06-08remarks 328-char remark
-
2026-06-08$167,500 Active 1 DOM
ⓘ Source: listings_history table (triggers on properties + properties_extension) + one-shot
backfill from property_details.listing_events for pre-trigger history.
Tax reassessment forecast WI · Partial reset (capped growth)
- Current annual tax
- $874 · $73/mo
- Projected year-2 tax
- $1,986 · $166/mo
- Expected delta
- +$1,112/yr (+$93/mo · 127.2%)
ⓘ Screening estimate from a state-policy table — verify with the county assessor before closing.
Climate risk First Street
- Flood 4/10 Moderate FEMA zone X (unshaded) · 20% chance over 30 yrs
- Wildfire 1/10 Low
- Heat 2/10 Low 7 d/yr ≥98°F today · 13 d/yr by 30 yrs out
- Wind 2/10 Low
- Air quality 3/10 Moderate 3 unhealthy d/yr today · 4 by 30 yrs out
Nearby sold comps map
Loading sold comps map…
Walkable amenities ~0.75 mi
Loading nearby amenities…
Taxation est. · year 1
- Rental income
- $13,868
- − Mortgage interest
- −$9,383
- − Property taxes
- −$874
- − Insurance
- −$838
- − Repairs & maintenance
- −$1,109
- − Management
- −$1,109
- − Depreciation
- −$4,873
- Taxable loss
- −$4,318
- Est. tax savings @ 24.0%
- +$1,036
- After-tax cash flow
- $-260/yr
For passive investors: Depreciation is non-cash, so a rental often shows a tax loss while cash-flowing — sheltering income. Rental losses are passive: they offset passive income freely, and up to $25,000/yr can offset ordinary (W-2) income if you actively participate and your MAGI is under $100k (phasing out to $0 by $150k); unused losses carry forward. On sale, claimed depreciation is recaptured at up to 25%, and gains may owe capital-gains tax (a 1031 exchange can defer both). Figures are a year-1 estimate at your 24.0% rate — not tax advice; consult a CPA.
Schools (NCES district)
- District
- Milwaukee School District
- NCES district ID
- 5509600
- Math proficiency
- 10% ▼ -5.00%
- Reading proficiency
- 18% ▬ 0.00%
- Median HH income
- $36,339
- Composite
- 11.61/100
- National rank
- #9696
- State rank
- #337 of 342 in WI
Livability — Milwaukee
- Score
- 81/100
- State rank
- #55
- US rank
- #1534
Category grades
Schools grade is shown separately in the Schools card above.
Census & demographics
- Census place
- Milwaukee, WI
- County
- Milwaukee County · 926,379 people
- City population
- 573,768
- Metro
- Milwaukee-Waukesha, WI
- Population (ZIP)
- 19,887
- Household income
- $29,336
- Rent vs Own
- Severe rent burden
- 2061.0
Population outlook (Milwaukee County) Hauer SSP2
- Today (2025)
- 995,758 people
- By 2030
- 1,009,124 · +1.3%
- By 2040
- 1,028,128 · +3.3%
- By 2050
- 1,040,066 · +4.4%
- By 2075
- 1,057,849 · +6.2%
- By 2100
- 1,039,774 · +4.4%
Race, ethnicity, and origin ACS 2023
- Neighborhood character
- Predominantly Black (91%)
- Race & ethnicity
- Black 91% Two or more races 3% White 3% Hispanic / Latino 3%
- Common ancestry
- Norwegian 1%
- Foreign-born
- 1% · Canada
- Languages at home
- 97% English-only · Spanish 2%
Political lean MEDSL · Milwaukee
- 2024 margin
- Solid D (+38.5) · D 68.3% · R 29.8% · Other 1.8%
- 2008→2024 swing
- +2.7pp toward D · 2008: 35.9pp · 2024: 38.5pp
- All cycles
- 2024: D+38.5 2020: D+39.9 2016: D+37.5 2012: D+34.6 2008: D+35.9
Not yet ingested
- Civics
- —
Market trends
- HPI YoY
- ▲ 133.03%
- Current HPI
- 397.7151
- Rent YoY
- ▲ 8.28%
- Metro
- Milwaukee-Waukesha, WI
- State GDP YoY
- ▲ 2.10%
- F500 in state
- 20
Industry mix (Fortune 500 HQ in WI)
| Industry | F500 HQs | Revenue |
|---|---|---|
| Industrial Machinery | 4 | $23B |
|
||
| Industrial Technology | 2 | $36B |
|
||
| Insurance | 1 | $36B |
|
||
| Professional Services | 1 | $19B |
|
||
| Utilities | 1 | $9B |
|
||
| Consumer Goods | 1 | $3B |
|
||
Price history
+34.1% since first listed5 events — show timeline
- 2026-06-06 Listed $167,500 METROMLS
- 2025-07-08 Sold (MLS) $73,000 METROMLS
- 2025-06-08 Pending — METROMLS
- 2025-05-30 Price Changed $79,900 METROMLS
- 2025-05-20 Listed $124,900 METROMLS
Property tax history
+2.4%/yrLatest (2024): $874 · +34.1% YoY. Source: county tax records.
Cash-flow waterfall
monthlySold comps — $/sqft
last 12 mo · ≤1 miLoading sold comps…