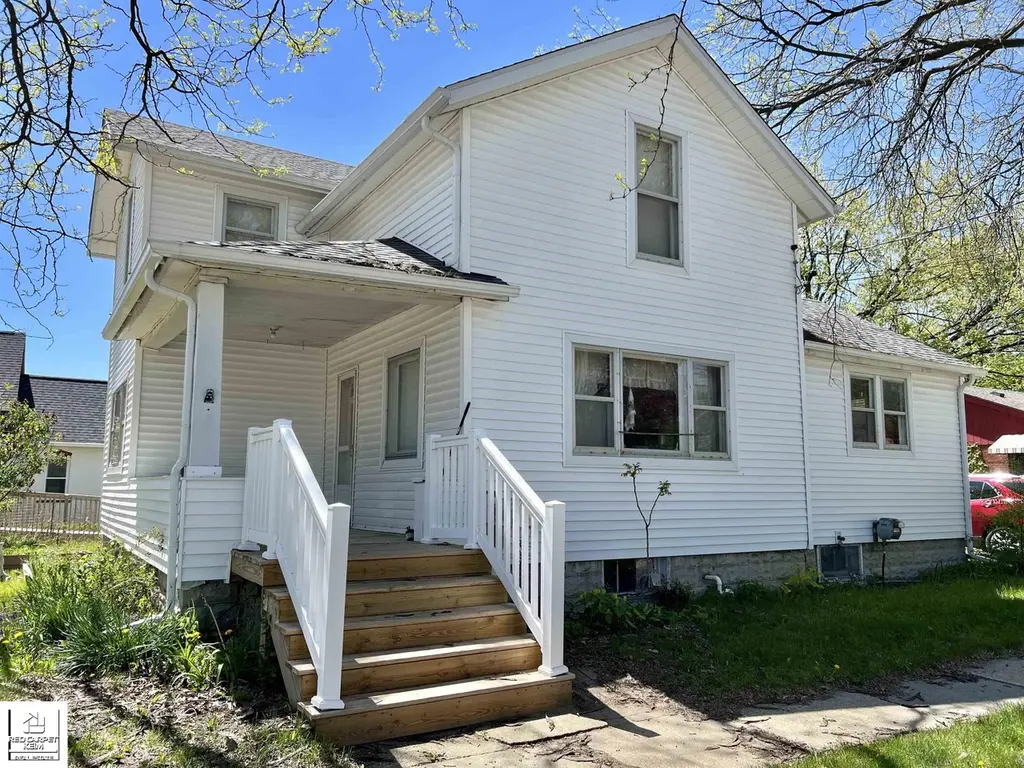
107 W Second St · Davison, MI
Flood risk 1/10 · Minimal
- FEMA flood zone
- X (unshaded)
- Chance of flooding over 30 yrs
- 0.0%
- Est. flood insurance / yr
- $473 – $860
Fire risk 1/10 · Minimal
- Est. fire insurance / yr
- $784 – $1,456
Heat risk 2/10 · Minimal
- Hot days now (above 97°F)
- 7 days/yr
- Hot days in 30 yrs
- 15 days/yr
Wind risk 2/10 · Minimal
- Chance of severe wind over 30 yrs
- —
Air-quality risk 3/10 · Minor
- Unhealthy air days now
- 2 days/yr
- Unhealthy air days in 30 yrs
- 3 days/yr
Risk factors via First Street. Map © Google.
Why this score? — see what drove the C+ grade
The composite is a weighted blend of 9 inputs, each scored 0–100. Each bar is that input's sub-score; the figure is the points it added to the 100-point composite (weight × sub-score).
- Cash flow +22.1/30.0
- ARV discount +15.0/15.0
- DSCR +7.1/10.0
- 1% rule +5.8/10.0
- Livability +4.2/5.0
- Schools +4.1/10.0
- Rent growth +2.5/5.0
- Condition / age +1.0/5.0
- Appreciation +0.0/10.0
$109,900
🖨 Deal sheet (PDF) 📄 Offer letter ✓ Due diligence
Listing remarks MLS
Like Challenges? This older home could use some remodeling. Estate is selling "AS IS", Cash Sale only. 5 year updates include roof and hot water heater. 3 Large Bedrooms upstairs, 10 x 10 Den on the first floor, vintage kitchen, Ideal location.
Key facts
- Vintage kitchen
- Ideal location
- 5,663 sq ft lot
Tags
Property features AI
Finance
- HOA & community: Homeowners association present; Sidewalks in the community
Exterior
- Parking: Detached assigned garage; Approximately 1.5 garage spaces
- Utilities: Public water; Public sewer
- Home design: Single-family residence; One and one-half story
- Construction: Vinyl siding; Above-grade finished area approximately 1,357; Has basement
- Exterior features: Front porch; City lot; Paved road access; Lot dimensions approximately 83 x 66
Interior
- Kitchen: Oven; Refrigerator; Range
- Bedrooms: Total of 7 rooms (room-level details not provided)
- Bathrooms: 1 full bathroom
- Heating & cooling: Forced air heating (natural gas); No cooling
- Interior features: Gas water heater; Oven; Refrigerator; Range; Interior entry basement; Partial basement with sump pump
- Laundry & utility: Gas water heater
Neighborhood map
What this means for you Summary
Snapshot
- This is a 3-bed/1.0-bath single-family listed at $110k. Condition is rated poor.
Deal economics
- At list price, monthly cash flow is $177 ($2k/yr) — positive.
- The deal already cash-flows at list — no discount required.
- Meets the 1% rule at list price ($1k rent vs $110k).
- Cap rate 8.2% vs local median 1.9% in Davison — top-decile yield for the area; either an underpriced asset or a hidden risk that comps aren't pricing in. Stress-test before assuming the spread holds.
Location & tenants
- Location reads 83/100 on livability (#45 in MI, #950 nationally) — a professional / high-income tenant draw. Strengths: amenities A+, cost of living A+, housing A+; Watch: employment D, commute F.
- Davison Community Schools (suburban): math 40% / reading 57% proficiency, ranked #117 of 540 in MI (top 22%) — families likely to look elsewhere, expect single-tenant / working-renter base with shorter leases.
- Market conditions: 221 active listings in the ZIP; 3 comparable units currently listed for rent nearby; rentals leasing fast (median 3d on market — plan ~1-2 weeks tenant-placement turnaround); 419 units permitted in Genesee County in 2024 (68 in 5+ unit buildings).
Forward outlook
- Local home prices are declining (-3.0%/yr); year-one equity from $760 of loan paydown is wiped out by about $3k of value loss. Plan a longer hold.
- Genesee County population projected at -27% by 2050 — secular population decline; favor cash flow + early exit over multi-decade hold.
Negotiation context
- Only 6 days on market — expect competitive offers; lowballing is unlikely to land.
- 2 sale attempts with the ask held roughly flat each time — persistent listings suggest the price (not the market) is what's stuck; bring a comps-based counter.
Risks & watch-outs
- Watch-outs: built in 1899 — expect roof / HVAC / electrical / plumbing capex.
Questions for the listing agent
- Have any recent inspections been done? Can we get a copy of the seller's disclosures and any deferred-maintenance estimates?
- Built in 1899 — when were the roof, HVAC, electrical panel, plumbing, and water heater last replaced?
- Is there a deadline driving the sale (1031 exchange, divorce, estate, relocation)? That informs how much negotiation room exists.
- Schools are B-rated — typically a magnet for longer-tenancy family renters. What's the average tenant stay here, and is there a school-zone premium baked into asking?
- What's the average days-on-market for RENTAL listings here right now (not sales)? A rising rental-DOM trend means longer vacancies and softer asking-rent achievability than the comps imply.
- What's the recent tenant-quality profile in this submarket — average credit score on applications, eviction rate, late-payment / NSF rate, and stable-employment percentage? A property-management company in the area should have these aggregated.
- How much new for-sale + rental construction is in the pipeline within 1–3 miles? Heavy new supply typically softens prices + rents 12–24 months out; constrained supply supports both.
Investment metrics
- 1% rule
- 1.08% ✓
- Cap rate
- 8.22%
- Cash-on-cash
- 6.89%
- DSCR
- 1.31
- GRM
- 7.7
CMA / ARV
- ARV (median comp)
- $195,340
- List price
- $109,900
- Delta
- -43.74%
- Verdict
- UNDERPRICED
- Comps
- 20 within 1.0 mi
Show comp detail 12 sales within ~0.75 mi
| Address | Dist | Beds/Ba | Sqft | Sold | Price | $/sf | Match |
|---|---|---|---|---|---|---|---|
| 420 W 2nd St | 0.27mi | 3/1.0 | 1,400 (+3%) | 7mo | $234,900 | $168 | 76 |
| 116 W 4th St | 0.16mi | 4/1.5 (+1) | 1,404 (+4%) | 8mo | $193,000 | $137 | 73 |
| 111 N Genesee St | 0.08mi | 2/2.0 (-1) | 1,317 (-3%) | 11mo | $130,000 | $99 | 73 |
| 350 E Rising St | 0.36mi | 3/1.5 | 1,288 (-5%) | 1mo | $230,000 | $179 | 72 |
| 719 Fitzner Dr | 0.64mi | 3/1.0 | 1,324 (-2%) | 0mo | $228,000 | $172 | 66 |
| 114 W Clark St | 0.41mi | 3/1.5 | 1,396 (+3%) | 10mo | $224,900 | $161 | 66 |
| 436 Gary Ray Dr | 0.54mi | 3/2.0 | 1,400 (+3%) | 4mo | $240,000 | $171 | 62 |
| 338 North Dr | 0.38mi | 3/1.0 | 1,467 (+8%) | 11mo | $230,000 | $157 | 60 |
| 405 Viet St | 0.44mi | 3/1.5 | 1,500 (+10%) | 6mo | $200,000 | $133 | 55 |
| 206 N Lapeer St | 0.26mi | 4/1.0 (+1) | 1,546 (+14%) | 9mo | $140,000 | $91 | 53 |
| 9145 Magnolia Ct | 0.69mi | 4/2.0 (+1) | 1,400 (+3%) | 11mo | $289,000 | $206 | 44 |
| 803 S Dayton St | 0.70mi | 3/1.5 | 1,517 (+12%) | 10mo | $231,000 | $152 | 38 |
Match score weights: distance 35% · size 25% · config 20% · recency 20%. Top-matched comps best support the ARV.
Projected returns pro-forma
-3.0% appreciation · 3.0% rent growth · sell at horizon
- IRR
- -5.7%
- Equity multiple
- 0.79×
- Total profit
- $-6,545
- Equity at exit
- $16,386
- IRR
- 3.9%
- Equity multiple
- 1.29×
- Total profit
- $8,853
- Equity at exit
- $9,502
Cash invested: $30,772 (down + closing). Projections, not guarantees.
Landlord ↔ Tenant lean methodology
- Overall (STATE)
- 62 Landlord-Friendly
- State Michigan
- 62 Landlord-Friendly · EVEN
- County
- — inherits STATE
- City
- — inherits STATE
ZIP-level market 48423
- Active inventory
- 221
- Price-to-rent
- 7.7×
Monthly cashflow live
- Estimated rent
- $1,185 medium interval (Pro) →
- Mortgage (P&I)
- −$576
- Tax est. 1.5%
- −$137 /mo · $1,648/yr
- Insurance
- −$46
- HOA
- −$0
- Vacancy / Maint / Mgmt
- −$249
- Net cashflow
- $177
Break-even live
Sensitivity live
| Price | -10% $253 | -5% $215 | +0% $177 | +5% $139 | +10% $101 |
|---|---|---|---|---|---|
| Rent | -10% $83 | -5% $130 | +0% $177 | +5% $223 | +10% $270 |
| Rate | -1.0pp $232 | -0.5pp $205 | base $177 | +0.5pp $148 | +1.0pp $119 |
UW: 25.0% down · 7.5% · 30yr · 1.5% tax · 5.0% vac · 8.0% maint · 8.0% mgmt
Financing live
Cash to close
- Down payment
- $27,475
- Closing costs
- $3,297
- Reserves months
- —
- Total cash needed
- —
Loan-product check · same deal, 3 products live
Conventional
25% down · 7.5% · 30yr
- Down + closing
- —
- Monthly P&I
- —
- Monthly cashflow
- —
- DSCR
- —
- Eligible?
- —
Personal DTI + credit; lowest rate.
DSCR
20% down · 8.5% · 30yr
- Down + closing
- —
- Monthly P&I
- —
- Monthly cashflow
- —
- DSCR
- —
- Eligible?
- —
No personal income docs; deal must DSCR.
Hard money
10% down · 12.0% · 12mo
- Down + closing
- —
- Monthly P&I
- —
- Monthly cashflow
- —
- DSCR
- —
- Eligible?
- —
Short-term bridge; refi at stabilization.
Rent comps 3 comps
| Address | Beds | Baths | Sqft | Rent | $/sqft | DOM | Units | Dist |
|---|---|---|---|---|---|---|---|---|
| 304 Milford Ct Davison, MI | 1.0–2.0 | 1.0 | 850 | $1,039 | $1.22 | 0d | 6 | 0.57mi |
| 1001 N State Rd Davison, MI | 1.0–2.0 | 1.0 | 800 | $1,200 | $1.50 | 14d | 1 | 0.75mi |
| 9175 Chatwell Club Ln Davison, MI | 2.0 | 2.0 | 1029 | $1,318 | $1.28 | 3d | 8 | 1.49mi |
Listing history 2 events
-
2026-05-13$109,900 Active 255-char remark
Show marketing remark (255 chars)
Like Challenges? This older home could use some remodeling. Estate is selling "AS IS", Cash Sale only. 5 year updates include roof and hot water heater. 3 Large Bedrooms upstairs, 10 x 10 Den on the first floor, vintage kitchen, Ideal location.
ⓘ Source: listings_history table (triggers on properties + properties_extension) + one-shot
backfill from property_details.listing_events for pre-trigger history.
Climate risk First Street
- Flood 1/10 Low FEMA zone X (unshaded) · 0% chance over 30 yrs
- Wildfire 1/10 Low
- Heat 2/10 Low 7 d/yr ≥97°F today · 15 d/yr by 30 yrs out
- Wind 2/10 Low
- Air quality 3/10 Moderate 2 unhealthy d/yr today · 3 by 30 yrs out
Nearby sold comps map
Loading sold comps map…
Walkable amenities ~0.75 mi
Loading nearby amenities…
Taxation est. · year 1
- Rental income
- $14,219
- − Mortgage interest
- −$6,156
- − Property taxes
- −$1,648
- − Insurance
- −$550
- − Repairs & maintenance
- −$1,137
- − Management
- −$1,137
- − Depreciation
- −$3,197
- Taxable income
- $392
- Est. tax owed @ 24.0%
- −$94
- After-tax cash flow
- $2,025/yr
For passive investors: Depreciation is non-cash, so a rental often shows a tax loss while cash-flowing — sheltering income. Rental losses are passive: they offset passive income freely, and up to $25,000/yr can offset ordinary (W-2) income if you actively participate and your MAGI is under $100k (phasing out to $0 by $150k); unused losses carry forward. On sale, claimed depreciation is recaptured at up to 25%, and gains may owe capital-gains tax (a 1031 exchange can defer both). Figures are a year-1 estimate at your 24.0% rate — not tax advice; consult a CPA.
Condition & rehab AI · 19 photos
This older home requires extensive renovations to improve its condition and increase its value. The property is currently in poor condition and needs major repairs and updates to the kitchen, bathrooms, exterior, flooring, interior walls, and HVAC system.
Repairs flagged
- Major Kitchen cabinets — Outdated and cluttered
- Major Bathroom fixtures — Outdated and cluttered
- Major Exterior siding — Weathered and peeling
- Major Flooring — Outdated and cluttered
- Major Interior walls — Outdated wallpaper and cluttered
- Major HVAC system — Outdated and cluttered
Value-add opportunities
- Both Paint and update kitchen cabinets — Fresh paint and updated cabinets will improve both resale and rental value
- Both Replace outdated bathroom fixtures — New fixtures will improve both resale and rental value
- Both Replace weathered siding and paint — Fresh siding and paint will improve both resale and rental value
- Both Replace outdated flooring — New flooring will improve both resale and rental value
- Both Paint and update interior walls — Fresh paint and updated walls will improve both resale and rental value
- Both Replace outdated HVAC system — A new HVAC system will improve both resale and rental value
Renovation cost estimate screening
| Repair item | Severity | Est. cost |
|---|---|---|
| Kitchen cabinets · Outdated and cluttered | Major | $15,000–50,000 |
| Bathroom fixtures · Outdated and cluttered | Major | $15,000–50,000 |
| Exterior siding · Weathered and peeling | Major | $15,000–50,000 |
| Flooring · Outdated and cluttered | Major | $15,000–50,000 |
| Interior walls · Outdated wallpaper and cluttered | Major | $15,000–50,000 |
| HVAC system · Outdated and cluttered | Major | $15,000–50,000 |
| Total estimated repair cost · 6 items | $90,000–300,000 |
Value-add ROI direction
- Both Paint and update kitchen cabinets — Fresh paint and updated cabinets will improve both resale and rental value ↑
- Both Replace outdated bathroom fixtures — New fixtures will improve both resale and rental value ↑
- Both Replace weathered siding and paint — Fresh siding and paint will improve both resale and rental value ↑
- Both Replace outdated flooring — New flooring will improve both resale and rental value ↑
- Both Paint and update interior walls — Fresh paint and updated walls will improve both resale and rental value ↑
- Both Replace outdated HVAC system — A new HVAC system will improve both resale and rental value ↑
ⓘ Cost ranges are severity-bucket heuristics (US national rule-of-thumb). Get contractor quotes + a written scope before underwriting a rehab budget.
Schools (NCES district)
- District
- Davison Community Schools
- NCES district ID
- 2611430
- Math proficiency
- 40% ▼ -8.00%
- Reading proficiency
- 57% ▼ -5.00%
- Median HH income
- $49,102
- Composite
- 41.39/100
- National rank
- #3479
- State rank
- #117 of 540 in MI
Livability — Davison
- Score
- 83/100
- State rank
- #45
- US rank
- #950
Category grades
Schools grade is shown separately in the Schools card above.
Census & demographics
- Census place
- Davison, MI
- County
- Genesee County · 221,329 people
- City population
- 33,757
- Metro
- Flint, MI
- Population (ZIP)
- 33,757
- Household income
- $65,079
- Rent vs Own
- Severe rent burden
- 1394.0
Population outlook (Genesee County) Hauer SSP2
- Today (2025)
- 381,312 people
- By 2030
- 362,731 · -4.9%
- By 2040
- 321,550 · -15.7%
- By 2050
- 279,212 · -26.8%
- By 2075
- 193,336 · -49.3%
- By 2100
- 128,118 · -66.4%
Race, ethnicity, and origin ACS 2023
- Neighborhood character
- Predominantly White (90%)
- Race & ethnicity
- White 90% Two or more races 5% Hispanic / Latino 4% Black 2%
- Common ancestry
- Romanian 10% Lithuanian 4% Italian 3%
- Foreign-born
- 2% · Canada
- Languages at home
- 97% English-only · Spanish 1% Russian/Polish/Slavic 1%
Political lean MEDSL · Genesee
- 2024 margin
- Toss-up / Even · D 51.4% · R 47.2% · Other 1.4%
- 2008→2024 swing
- -28.3pp toward R · 2008: 32.5pp · 2024: 4.2pp
- All cycles
- 2024: D+4.2 2020: D+9.3 2016: D+9.5 2012: D+28.2 2008: D+32.5
Not yet ingested
- Civics
- —
Market trends
- HPI YoY
- ▼ -226.14%
- Current HPI
- 228.684
- Rent YoY
- —
- Metro
- Flint, MI
- State GDP YoY
- ▲ 1.37%
- F500 in state
- 28
Industry mix (Fortune 500 HQ in MI)
| Industry | F500 HQs | Revenue |
|---|---|---|
| Automotive Parts | 3 | $48B |
|
||
| Automotive | 2 | $372B |
|
||
| Chemicals | 1 | $45B |
|
||
| Automotive Retail | 1 | $29B |
|
||
| Healthcare / Medical Devices | 1 | $23B |
|
||
| Automotive Technology | 1 | $20B |
|
||
Price history
+0.0% since first listed4 events — show timeline
- 2026-05-21 Pending — REALCOMP
- 2026-05-21 Pending — MiRealSource-MiMLS
- 2026-05-13 Listed $109,900 MiRealSource-MiMLS
- 2026-05-13 Listed $109,900 REALCOMP
Cash-flow waterfall
monthlySold comps — $/sqft
last 12 mo · ≤1 miLoading sold comps…