155 S Last Chance Dr · Laketown, UT
Flood risk 1/10 · Minimal
- FEMA flood zone
- —
- Chance of flooding over 30 yrs
- 0.0%
- Est. flood insurance / yr
- —
Fire risk 5/10 · Moderate
- Est. fire insurance / yr
- $453 – $841
Heat risk 2/10 · Minimal
- Hot days now (above 85°F)
- 8 days/yr
- Hot days in 30 yrs
- 22 days/yr
Wind risk 1/10 · Minimal
- Chance of severe wind over 30 yrs
- —
Air-quality risk 2/10 · Minimal
- Unhealthy air days now
- 1 days/yr
- Unhealthy air days in 30 yrs
- 1 days/yr
Risk factors via First Street. Map © Google.
Why this score? — see what drove the D- grade
The composite is a weighted blend of 9 inputs, each scored 0–100. Each bar is that input's sub-score; the figure is the points it added to the 100-point composite (weight × sub-score).
- Cash flow +7.7/30.0
- ARV discount +7.5/15.0
- Appreciation +5.9/10.0
- Schools +4.5/10.0
- Livability +3.4/5.0
- Rent growth +2.5/5.0
- Condition / age +2.5/5.0
- 1% rule +2.2/10.0
- DSCR +1.8/10.0
$209,000
🖨 Deal sheet 📄 Offer letter ✓ Due diligence
Listing remarks
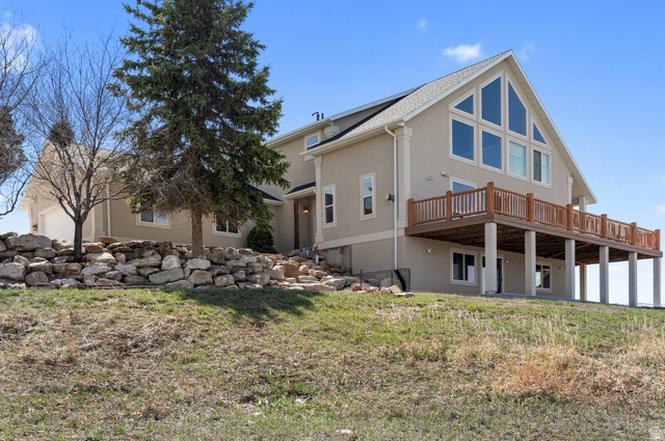
Experience the best of Bear Lake recreation with this beautiful fractional ownership opportunity in a custom home overlooking Big Creek and the sparkling waters of Bear Lake. Located in the desirable Last Chance Subdivision in Laketown, Utah, this spacious mountain retreat offers six bedrooms, four bathrooms, and three levels of comfortable living space designed for gathering with family and friends. Expansive windows capture the stunning views, while the large deck and patio provide the perfect setting to relax and enjoy the surrounding scenery. Ideally situated just minutes from Rendezvous Beach, Cottonwood Canyon, Temple Flat Canyon, and the First Point boat ramp, this property places en
Key facts
- Large deck
- Custom home
- Patio
Tags
Property features AI
Finance
- Other: Above-grade finished area approximately 2908; Subdivision: LAST CHANCE PH 1 LOT 8
- HOA & community: Homeowners association present
Exterior
- Parking: Attached garage; 2 garage spaces; 2 covered parking spaces; 8 open parking spaces; Total of 10 parking spaces
- Utilities: Electricity connected; Culinary water connected; Septic tank sewer
- Home design: Two-story home; Faces north; Single-family property; Fractional ownership
- Construction: Asphalt and stucco exterior; Asphalt pitched roof; Full basement (100% finished); Blt./Standing condition
- Exterior features: Double-pane windows; Entry foyer; Exterior lighting; Sliding glass doors; Walkout; Basketball standard; Partial landscaping; Mature trees; Views of lake, mountain and valley; Road access: paved and unpaved; Gradual slope terrain
Interior
- Kitchen: Double ovens; Wall oven; Gas range; Range hood; Microwave; Refrigerator; Gas grill/BBQ
- Bedrooms: Primary bedroom on 2nd floor
- Flooring: Carpet; Laminate; Tile
- Bathrooms: 3 full bathrooms; 1 three-quarter bathroom
- Heating & cooling: Radiant gas heating; Hot water heating; Propane heating; Natural ventilation cooling
- Interior features: Wet bar; Primary bathroom with separate tub and shower; Walk-in closet; Den/home office; Garbage disposal; Gas log fireplace; Great room; Jetted tub; Double wall ovens; Wall oven; Gas range; Freestanding range/oven; Vaulted ceilings; Granite countertops; Blinds (partial); Ceiling fan; Satellite dish
- Laundry & utility: Washer and dryer included; Electric dryer hookup
Neighborhood map
What this means for you Summary
Snapshot
- This is a 6-bed/4.0-bath other listed at $209k.
Deal economics
- At list price, monthly cash flow is $-242 ($-3k/yr) — negative.
- To cash-flow at today's rent, offer at most $166k (20.4% below list).
- To meet the 1% rule (rent ≥ 1% of price), the offer needs to be $151k (27.8% below list).
- Recommended offer: $151k (27.8% below list) — sets the bar for 1% rule.
Location & tenants
- Location reads 67/100 on livability (#128 in UT) — a middle-class / working-renter tenant base. Strengths: employment A+, housing A+, crime A; Watch: cost of living D+, amenities F, commute F.
- Rich District (rural): math 51% / reading 55% proficiency, ranked #16 of 80 in UT (top 20%) — acceptable for families but not a draw, mixed tenant base, ~2y average lease.
- Zoned schools: North Rich School (math 64% / reading 54%, grade B-, #59 of 585 statewide, top 10%, 113 students, 37% FRL); Rich Middle School (math 52% / reading 57%, grade B-, #13 of 138 statewide, top 9%, 123 students, 33% FRL); Rich High (math 30% / reading 50%, grade F, #63 of 171 statewide, top 37%, 156 students, 30% FRL).
- Market conditions: 13 active listings in the ZIP; 97 units permitted in Rich County in 2024 (19 in 5+ unit buildings).
Forward outlook
- In year one you build about $5k of equity ($1k loan paydown + $4k appreciation (1.9% local appreciation)).
- Rich County population projected to shrink 8% by 2050 — rents likely to lag national; underwrite the cash flow, not the appreciation.
- By year 7, paydown + projected appreciation supports a ~$35k cash-out refi (75% LTV) — recoverable capital for the next deal without selling this one.
Negotiation context
- Only 4 days on market — expect competitive offers; lowballing is unlikely to land.
- 7 sale attempts since 9y ago; this cycle's ask has dropped $70k (25%) from the opening price — seller is motivated, your offer sets the floor, not the list.
Risks & watch-outs
- Climate carrying-cost: moderate wildfire risk — expect insurance premiums to compound above CPI over the hold.
Questions for the listing agent
- What do current leases actually rent for vs. the listed asking? Can we see a recent rent roll and the last 12 months of T-12 income?
- Is there a deadline driving the sale (1031 exchange, divorce, estate, relocation)? That informs how much negotiation room exists.
- Schools are B-rated — typically a magnet for longer-tenancy family renters. What's the average tenant stay here, and is there a school-zone premium baked into asking?
- The area grade is low — what's the realistic commute time and amenity access for the typical tenant pool here? Any planned neighborhood developments (good or bad) we should know about?
- What's the average days-on-market for RENTAL listings here right now (not sales)? A rising rental-DOM trend means longer vacancies and softer asking-rent achievability than the comps imply.
- What's the recent tenant-quality profile in this submarket — average credit score on applications, eviction rate, late-payment / NSF rate, and stable-employment percentage? A property-management company in the area should have these aggregated.
- How much new for-sale + rental construction is in the pipeline within 1–3 miles? Heavy new supply typically softens prices + rents 12–24 months out; constrained supply supports both.
Investment metrics
- 1% rule
- 0.72% ✗
- Cap rate
- 4.91%
- Cash-on-cash
- -4.96%
- DSCR
- 0.78
- GRM
- 11.5
CMA / ARV
No comps found within radius.
Projected returns pro-forma
1.88% appreciation · 3.0% rent growth · sell at horizon
- IRR
- -0.7%
- Equity multiple
- 0.96×
- Total profit
- $-2,333
- Equity at exit
- $81,067
- IRR
- 3.7%
- Equity multiple
- 1.50×
- Total profit
- $29,135
- Equity at exit
- $115,695
Cash invested: $58,520 (down + closing). Projections, not guarantees.
Landlord ↔ Tenant lean methodology
- Overall (STATE)
- 86 Strongly Landlord-Friendly
- State Utah
- 86 Strongly Landlord-Friendly · R+15
- County
- — inherits STATE
- City
- — inherits STATE
ZIP-level market 84038
- Home prices YoY
- 1.8%
- Active inventory
- 13
- Price-to-rent
- 11.5×
Monthly cashflow live
- Estimated rent
- $1,510 medium interval (Pro) →
- Mortgage (P&I)
- −$1,096
- Tax from tax record
- −$251 /mo · $3,013/yr
- Insurance
- −$87
- HOA
- −$0
- Vacancy / Maint / Mgmt
- −$317
- Net cashflow
- $-242
Break-even live
UW: 25.0% down · 7.5% · 30yr · 1.5% tax · 5.0% vac · 8.0% maint · 8.0% mgmt
Financing live
Cash to close
- Down payment
- $52,250
- Closing costs
- $6,270
- Reserves months
- —
- Total cash needed
- —
Loan-product check · same deal, 3 products live
Conventional
25% down · 7.5% · 30yr
- Down + closing
- —
- Monthly P&I
- —
- Monthly cashflow
- —
- DSCR
- —
- Eligible?
- —
Personal DTI + credit; lowest rate.
DSCR
20% down · 8.5% · 30yr
- Down + closing
- —
- Monthly P&I
- —
- Monthly cashflow
- —
- DSCR
- —
- Eligible?
- —
No personal income docs; deal must DSCR.
Hard money
10% down · 12.0% · 12mo
- Down + closing
- —
- Monthly P&I
- —
- Monthly cashflow
- —
- DSCR
- —
- Eligible?
- —
Short-term bridge; refi at stabilization.
Listing history 33 events
-
2026-06-19days on market $209,000 Active 4 DOM
-
2026-06-18days on market $209,000 Active 3 DOM
-
2026-06-17days on market $209,000 Active 2 DOM
-
2026-06-15remarks 699-char remark
-
2026-06-15pricedays on market $209,000 Active 1 DOM
-
2026-06-15days on market $249,000 Active 432 DOM
-
2026-06-14days on market $249,000 Active 430 DOM
-
2026-06-13days on market $249,000 Active 429 DOM
-
2026-06-10days on market $249,000 Active 427 DOM
-
2026-06-09days on market $249,000 Active 426 DOM
-
2026-06-08days on market $249,000 Active 425 DOM
-
2026-06-07days on market $249,000 Active 424 DOM
-
2026-06-03days on market $249,000 Active 420 DOM
-
2026-06-02days on market $249,000 Active 419 DOM
-
2026-06-01days on market $249,000 Active 418 DOM
-
2026-05-31days on market $249,000 Active 417 DOM
-
2026-05-30days on market $249,000 Active 416 DOM
-
2026-05-07status Active
-
2026-05-07price $249,000
-
2026-05-01historical
-
2026-05-01historical
-
2025-07-25price $239,000
-
2025-04-15$279,000 Active
-
2025-04-03$295,000 Active
-
2024-10-28historical
-
2024-03-14$295,000 Active
-
2020-07-18soldstatus Sold
-
2020-06-07status Under Contract
-
2020-02-13$159,000 Active
-
2019-09-05historical
-
2018-11-01status Active
-
2018-10-31historical
-
2017-10-09$145,000 Active
ⓘ Source: listings_history table (triggers on properties + properties_extension) + one-shot
backfill from property_details.listing_events for pre-trigger history.
Tax reassessment forecast UT · Resets to sale price
- Current annual tax
- $3,013 · $251/mo
- Projected year-2 tax
- $3,013 · $251/mo
- Expected delta
- $0/yr ($0/mo · 0.0%)
ⓘ Screening estimate from a state-policy table — verify with the county assessor before closing.
Climate risk First Street
- Flood 1/10 Low 0% chance over 30 yrs
- Wildfire 5/10 Major
- Heat 2/10 Low 8 d/yr ≥85°F today · 22 d/yr by 30 yrs out
- Wind 1/10 Low
- Air quality 2/10 Low 1 unhealthy d/yr today · 1 by 30 yrs out
Nearby sold comps map
Loading sold comps map…
Walkable amenities ~0.75 mi
Loading nearby amenities…
Taxation est. · year 1
- Rental income
- $18,115
- − Mortgage interest
- −$11,707
- − Property taxes
- −$3,013
- − Insurance
- −$1,045
- − Repairs & maintenance
- −$1,449
- − Management
- −$1,449
- − Depreciation
- −$6,080
- Taxable loss
- −$6,629
- Est. tax savings @ 24.0%
- +$1,591
- After-tax cash flow
- $-1,309/yr
For passive investors: Depreciation is non-cash, so a rental often shows a tax loss while cash-flowing — sheltering income. Rental losses are passive: they offset passive income freely, and up to $25,000/yr can offset ordinary (W-2) income if you actively participate and your MAGI is under $100k (phasing out to $0 by $150k); unused losses carry forward. On sale, claimed depreciation is recaptured at up to 25%, and gains may owe capital-gains tax (a 1031 exchange can defer both). Figures are a year-1 estimate at your 24.0% rate — not tax advice; consult a CPA.
Schools (NCES district)
- District
- Rich District
- NCES district ID
- 4900840
- Math proficiency
- 51% ▼ -3.00%
- Reading proficiency
- 55% ▲ 1.00%
- Median HH income
- $51,144
- Composite
- 45.37/100
- National rank
- #2633
- State rank
- #16 of 80 in UT
Livability — Laketown
- Score
- 67/100
- State rank
- #128
- US rank
- #10692
Category grades
Schools grade is shown separately in the Schools card above.
Census & demographics
- Census place
- Laketown, UT
- Population (ZIP)
- 589
Population outlook (Rich County) Hauer SSP2
- Today (2025)
- 2,278 people
- By 2030
- 2,241 · -1.6%
- By 2040
- 2,142 · -6.0%
- By 2050
- 2,085 · -8.5%
- By 2075
- 1,814 · -20.4%
- By 2100
- 1,530 · -32.8%
Race, ethnicity, and origin ACS 2023
- Neighborhood character
- Predominantly White (96%)
- Race & ethnicity
- White 96% Two or more races 4% Hispanic / Latino 4%
- Common ancestry
- Italian 16% Serbian 6% Iranian 3%
- Foreign-born
- 1% · Canada
- Languages at home
- 99% English-only · Spanish 1%
Political lean MEDSL · Rich
- 2024 margin
- Solid R (+68.9) · D 14.8% · R 83.7% · Other 1.5%
- 2008→2024 swing
- -1.6pp toward R · 2008: -67.3pp · 2024: -68.9pp
- All cycles
- 2024: R+68.9 2020: R+71.7 2016: R+62.2 2012: R+82.5 2008: R+67.3
Not yet ingested
- Civics
- —
Market trends
- HPI YoY
- ▲ 1.88%
- Current HPI
- 108.4797
- Rent YoY
- —
- Metro
- —
- State GDP YoY
- ▲ 3.54%
- F500 in state
- 2
Industry mix (Fortune 500 HQ in UT)
| Industry | F500 HQs | Revenue |
|---|---|---|
| Financial Services | 1 | $3B |
|
||
Price history
+71.7% since first listed16 events — show timeline
- 2026-05-07 Relisted — WFRMLS
- 2026-05-07 Price Changed $249,000 WFRMLS
- 2026-05-01 Listing Removed — WFRMLS
- 2026-05-01 Listing Removed — WFRMLS
- 2025-07-25 Price Changed $239,000 WFRMLS
- 2025-04-15 Listed $279,000 WFRMLS
- 2025-04-03 Listed $295,000 WFRMLS
- 2024-10-28 Listing Removed — WFRMLS
- 2024-03-14 Listed $295,000 WFRMLS
- 2020-07-18 Sold (MLS) — WFRMLS
- 2020-06-07 Pending — WFRMLS
- 2020-02-13 Listed $159,000 WFRMLS
- 2019-09-05 Listing Removed — WFRMLS
- 2018-11-01 Relisted — WFRMLS
- 2018-10-31 Listing Removed — WFRMLS
- 2017-10-09 Listed $145,000 WFRMLS
Property tax history
+6.4%/yrLatest (2025): $3,013 · -1.5% YoY. Source: county tax records.
Cash-flow waterfall
monthlySold comps — $/sqft
last 12 mo · ≤1 miLoading sold comps…