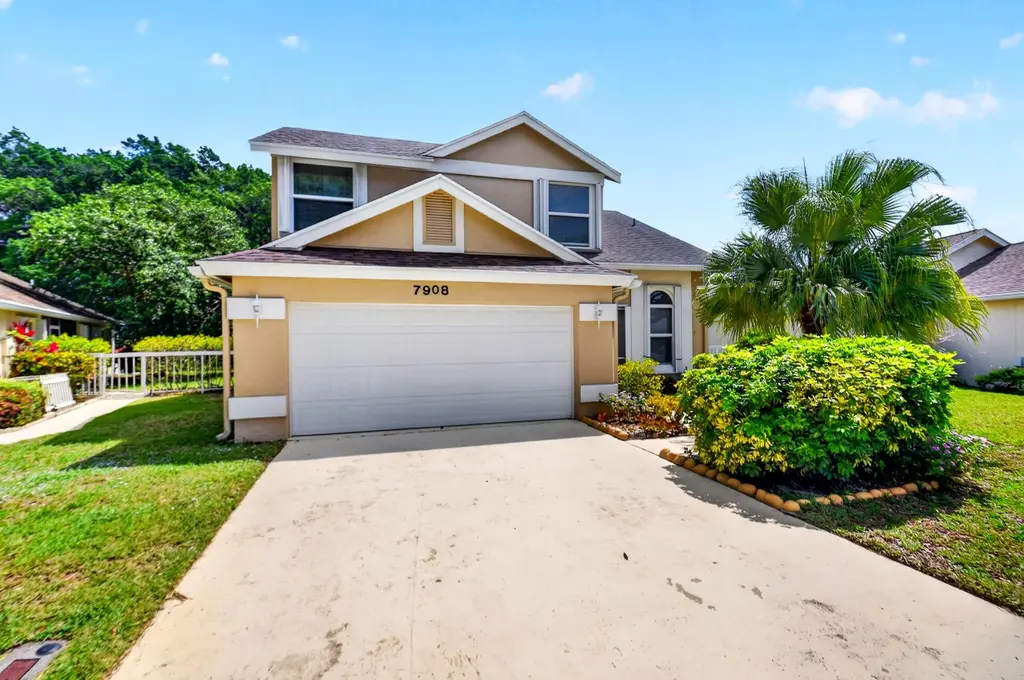
7908 Mansfield Hollow Rd · Delray Beach, FL
Flood risk 1/10 · Minimal
- FEMA flood zone
- X (unshaded)
- Chance of flooding over 30 yrs
- 0.0%
- Est. flood insurance / yr
- $507 – $1,088
Fire risk 3/10 · Minor
- Est. fire insurance / yr
- $947 – $1,759
Heat risk 9/10 · Severe
- Hot days now (above 107°F)
- 7 days/yr
- Hot days in 30 yrs
- 26 days/yr
Wind risk 10/10 · Severe
- Chance of severe wind over 30 yrs
- 99.0%
Air-quality risk 2/10 · Minimal
- Unhealthy air days now
- 0 days/yr
- Unhealthy air days in 30 yrs
- 2 days/yr
Risk factors via First Street. Map © Google.
Why this score? — see what drove the D grade
The composite is a weighted blend of 9 inputs, each scored 0–100. Each bar is that input's sub-score; the figure is the points it added to the 100-point composite (weight × sub-score).
- Cash flow +8.8/30.0
- ARV discount +7.5/15.0
- Appreciation +5.3/10.0
- Schools +4.3/10.0
- Livability +3.9/5.0
- 1% rule +2.7/10.0
- Rent growth +2.6/5.0
- Condition / age +2.5/5.0
- DSCR +2.4/10.0
$435,000
🖨 Deal sheet (PDF) 📄 Offer letter ✓ Due diligence
Listing remarks
Beautifully maintained two-story home with a NEW ROOF, new A/C, IMPACT WINDOWS, and a renovated kitchen complete with stainless steel appliances (refrigerator needed). The home offers a lovely lake view and a large enclosed patio, ideal for additional seating or flexible use. Situated in a desirable 55+ community in Delray Beach, close to Atlantic Avenue, shopping, dining, and the beach.
Key facts
- Lake view
- Renovated kitchen
- New a/c
Tags
Property features AI
Finance
- Other: Pets allowed with restrictions; Senior community
- HOA & community: Community association with clubhouse, fitness center, pool, shuffleboard, tennis courts, pickleball courts and street lights; Quarterly HOA fee
Exterior
- Parking: Attached 2-car garage; Driveway; 2 covered parking spaces
- Utilities: Public water; Public sewer; Cable available; Electricity available; Natural gas not available; Sewer connected; Underground utilities; Water available
- Home design: Single family residence; Two stories; Entry level: 1; Faces west
- Construction: CBS construction; Shingle roof; Built as resale property
- Exterior features: Covered patio; Screened patio; Patio; Waterfront
Interior
- Kitchen: Dishwasher; Electric range; Microwave; Electric water heater
- Bedrooms: One main-level bedroom
- Flooring: Carpet; Laminate; Tile
- Bathrooms: Two full bathrooms; One half bathroom
- Heating & cooling: Central heating; Central air; Ceiling fans
- Interior features: Entrance foyer; Vaulted ceilings; Wet bar; Walk-in closets; French doors
- Laundry & utility: Laundry in garage
Neighborhood map
What this means for you Summary
Snapshot
- This is a 3-bed/2.5-bath single-family listed at $435k.
Deal economics
- At list price, monthly cash flow is $-356 ($-4k/yr) — negative.
- To cash-flow at today's rent, offer at most $372k (14.5% below list).
- To meet the 1% rule (rent ≥ 1% of price), the offer needs to be $333k (23.5% below list).
- Recommended offer: $333k (23.5% below list) — sets the bar for 1% rule.
- Cap rate 5.3% vs local median 4.3% in Delray Beach — meaningfully above typical; check what's discounted (condition, days-on-market, listing class) to confirm the premium yield is real.
Location & tenants
- Location reads 77/100 on livability (#202 in FL, #3,160 nationally) — a middle-class / working-renter tenant base. Strengths: housing A+, health & safety A+, commute A-; Watch: cost of living C-, crime D-, amenities F.
- Palm Beach (suburban): math 46% / reading 53% proficiency, ranked #34 of 73 in FL (top 47%) — families likely to look elsewhere, expect single-tenant / working-renter base with shorter leases.
- Zoned schools: Hagen Road Elementary School (math 55% / reading 63%, grade B-, #722 of 2,144 statewide, top 34%, 773 students, 46% FRL); Carver Middle School (math 22% / reading 34%, grade F, #486 of 571 statewide, top 86%, 732 students, 73% FRL); Spanish River Community High School (math 64% / reading 74%, grade B, #63 of 667 statewide, top 10%, 2,578 students, 25% FRL) — zoned schools at 48% FRL track the district average.
- Market conditions: Rents flat; 584 active listings in the ZIP; 40 comparable units currently listed for rent nearby; rentals at typical pace (median 21d on market — plan ~3-4 weeks tenant-placement turnaround); solid renter incomes; 3,974 units permitted in Palm Beach County in 2024 (1,012 in 5+ unit buildings).
- At $3,329/mo this rent would consume 50% of the median local household income ($80k/yr) (locally 494% of renters already pay >50% of income on rent) — very limited rent-growth headroom before tenants either downsize or default.
Forward outlook
- In year one you build about $6k of equity ($3k loan paydown + $3k appreciation (0.7% local appreciation)).
- Palm Beach County population projected at +30% by 2050 — long-run rental-demand tailwind backs the buy-and-hold thesis.
- By year 6, paydown + projected appreciation supports a ~$36k cash-out refi (75% LTV) — recoverable capital for the next deal without selling this one.
Negotiation context
- It's been on market 16 days — a 2% lower offer ($428k) is reasonable based on typical stale-listing flexibility.
- 2 sale attempts since 27y ago with the ask held roughly flat each time — persistent listings suggest the price (not the market) is what's stuck; bring a comps-based counter.
- Current owner paid $182k; list at $435k implies a 138% gain — meaningful room to come down on a strong offer.
Risks & watch-outs
- Climate carrying-cost: severe wind risk, 99% chance of damaging wind over 30y; extreme-heat days projected 7→26/yr by 2055 (HVAC capex compounding) — expect insurance premiums to compound above CPI over the hold.
Questions for the listing agent
- What do current leases actually rent for vs. the listed asking? Can we see a recent rent roll and the last 12 months of T-12 income?
- What does the HOA fee cover, when was the last increase, and are there any pending special assessments or reserve-fund shortfalls?
- Is there a deadline driving the sale (1031 exchange, divorce, estate, relocation)? That informs how much negotiation room exists.
- Schools are B-rated — typically a magnet for longer-tenancy family renters. What's the average tenant stay here, and is there a school-zone premium baked into asking?
- Crime grade is D in this area — have there been break-ins, vandalism, or insurance claims at this property in the last 3 years? What carrier currently insures it and at what premium?
- The area grade is low — what's the realistic commute time and amenity access for the typical tenant pool here? Any planned neighborhood developments (good or bad) we should know about?
- What's the average days-on-market for RENTAL listings here right now (not sales)? A rising rental-DOM trend means longer vacancies and softer asking-rent achievability than the comps imply.
- What's the recent tenant-quality profile in this submarket — average credit score on applications, eviction rate, late-payment / NSF rate, and stable-employment percentage? A property-management company in the area should have these aggregated.
- How much new for-sale + rental construction is in the pipeline within 1–3 miles? Heavy new supply typically softens prices + rents 12–24 months out; constrained supply supports both.
Investment metrics
- 1% rule
- 0.77% ✗
- Cap rate
- 5.31%
- Cash-on-cash
- -3.51%
- DSCR
- 0.84
- GRM
- 10.9
CMA / ARV
No comps found within radius.
Projected returns pro-forma
0.69% appreciation · 0.51% rent growth · sell at horizon
- IRR
- -4.9%
- Equity multiple
- 0.76×
- Total profit
- $-29,284
- Equity at exit
- $141,455
- IRR
- -0.9%
- Equity multiple
- 0.90×
- Total profit
- $-12,699
- Equity at exit
- $182,648
Cash invested: $121,800 (down + closing). Projections, not guarantees.
Landlord ↔ Tenant lean methodology
- Overall (STATE)
- 87 Strongly Landlord-Friendly
- State Florida
- 87 Strongly Landlord-Friendly · R+3
- County
- — inherits STATE
- City
- — inherits STATE
ZIP-level market 33446
- Home prices YoY
- 0.3%
- Rents YoY
- 0.5%
- Active inventory
- 584
- Price-to-rent
- 10.9×
Monthly cashflow live
- Estimated rent
- $3,329 high interval (Pro) →
- Mortgage (P&I)
- −$2,281
- Tax from tax record
- −$204 /mo · $2,446/yr
- Insurance
- −$181
- HOA
- −$320
- Vacancy / Maint / Mgmt
- −$699
- Net cashflow
- $-356
Break-even live
Sensitivity live
| Price | -10% $-110 | -5% $-233 | +0% $-356 | +5% $-479 | +10% $-603 |
|---|---|---|---|---|---|
| Rent | -10% $-619 | -5% $-488 | +0% $-356 | +5% $-225 | +10% $-93 |
| Rate | -1.0pp $-137 | -0.5pp $-246 | base $-356 | +0.5pp $-469 | +1.0pp $-584 |
UW: 25.0% down · 7.5% · 30yr · 1.5% tax · 5.0% vac · 8.0% maint · 8.0% mgmt
Financing live
Cash to close
- Down payment
- $108,750
- Closing costs
- $13,050
- Reserves months
- —
- Total cash needed
- —
Loan-product check · same deal, 3 products live
Conventional
25% down · 7.5% · 30yr
- Down + closing
- —
- Monthly P&I
- —
- Monthly cashflow
- —
- DSCR
- —
- Eligible?
- —
Personal DTI + credit; lowest rate.
DSCR
20% down · 8.5% · 30yr
- Down + closing
- —
- Monthly P&I
- —
- Monthly cashflow
- —
- DSCR
- —
- Eligible?
- —
No personal income docs; deal must DSCR.
Hard money
10% down · 12.0% · 12mo
- Down + closing
- —
- Monthly P&I
- —
- Monthly cashflow
- —
- DSCR
- —
- Eligible?
- —
Short-term bridge; refi at stabilization.
Rent comps 40 comps
| Address | Beds | Baths | Sqft | Rent | $/sqft | DOM | Units | Dist |
|---|---|---|---|---|---|---|---|---|
| 7904 Mansfield Hollow Rd Delray Beach, FL | 3.0 | 2.0 | 1865 | $3,950 | $2.12 | 26d | 1 | 0.01mi |
| 13811 Oneida Dr Unit H2 Delray Beach, FL | 2.0 | 2.0 | 1078 | $2,100 | $1.95 | 26d | 1 | 0.22mi |
| 13851 Oneida Dr Unit D2 Delray Beach, FL | 3.0 | 2.0 | 1557 | $2,850 | $1.83 | 5d | 1 | 0.23mi |
| 13542 Weyburne Dr Delray Beach, FL | 3.0 | 2.0 | 1727 | $3,145 | $1.82 | 23d | 1 | 0.37mi |
| 14131 Rock Salt Rd Delray Beach, FL | 3.0 | 2.0 | 1490 | $4,800 | $3.22 | 1d | 1 | 0.49mi |
| 14131 Rock Salt Rd Delray Beach, FL | 3.0 | 2.0 | 1490 | $4,800 | $3.22 | 3d | 1 | 0.49mi |
| 13916 Viale Elizabeth Unit F Delray Beach, FL | 2.0 | 2.0 | 989 | $3,000 | $3.03 | 26d | 1 | 0.63mi |
| 8085 Tumblestone Ct Delray Beach, FL | 2.0 | 2.0 | 1076 | $2,668 | $2.48 | 4d | 1 | 0.72mi |
| 8085 Tumblestone Ct Delray Beach, FL | 3.0 | 2.0 | 1242 | $2,998 | $2.41 | 3d | 1 | 0.72mi |
| 8085 Tumblestone Ct Delray Beach, FL | 2.0 | 2.0 | 1097 | $2,679 | $2.44 | 26d | 1 | 0.72mi |
| 7301 Amberly Ln #304 Delray Beach, FL | 2.0 | 2.0 | 1080 | $1,495 | $1.38 | 9d | 1 | 0.80mi |
| 14856 Barletta Way Delray Beach, FL | 2.0 | 2.0 | 1406 | $3,200 | $2.28 | 26d | 1 | 0.81mi |
| 7310 Ashford Pl Delray Beach, FL | 2.0 | 2.0 | 1230 | $2,700 | $2.20 | 20d | 2 | 0.92mi |
| 7310 Ashford Pl Delray Beach, FL | 2.0 | 2.0 | 1230 | $3,200 | $2.60 | 17d | 1 | 0.92mi |
| 7310 Ashford Pl Delray Beach, FL | 2.0 | 2.0 | 1230 | $3,200 | $2.60 | 9d | 1 | 0.92mi |
| 7350 Kinghurst Dr Delray Beach, FL | 2.0 | 2.0 | 1220 | $4,500 | $3.69 | 17d | 1 | 0.93mi |
| 7350 Kinghurst Dr #305 Delray Beach, FL | 2.0 | 2.0 | 1220 | $4,500 | $3.69 | 1d | 1 | 0.93mi |
| 7350 Kinghurst Dr #305 Delray Beach, FL | 2.0 | 2.0 | 1220 | $4,500 | $3.69 | 23d | 1 | 0.93mi |
| 8061 Red Jasper Ln Delray Beach, FL | 2.0 | 2.0 | 1153 | $3,002 | $2.60 | 4d | 1 | 0.93mi |
| 8061 Red Jasper Ln Delray Beach, FL | 2.0 | 2.0 | 1097 | $2,877 | $2.62 | 26d | 1 | 0.93mi |
| 8061 Red Jasper Ln Delray Beach, FL | 2.0 | 2.0 | 1097 | $2,892 | $2.64 | 13d | 1 | 0.93mi |
| 7286 Huntington Ln #105 Delray Beach, FL | 2.0 | 2.0 | 1070 | $3,350 | $3.13 | 26d | 1 | 0.95mi |
| 7260 Kinghurst Dr #205 Delray Beach, FL | 2.0 | 2.0 | 1230 | $2,800 | $2.28 | 20d | 1 | 1.03mi |
| 7192 Huntington Ln #307 Delray Beach, FL | 2.0 | 2.0 | 1070 | $3,500 | $3.27 | 20d | 1 | 1.04mi |
| 14307 Bedford Dr #302 Delray Beach, FL | 2.0 | 2.0 | 990 | $2,200 | $2.22 | 26d | 1 | 1.06mi |
| 15018 Three Ponds Trl Delray Beach, FL | 3.0 | 2.0 | 1703 | $4,150 | $2.44 | 26d | 1 | 1.10mi |
| 15018 Three Ponds Trl Delray Beach, FL | 3.0 | 2.0 | 1703 | $4,150 | $2.44 | 13d | 1 | 1.10mi |
| 14509 Sloan Ridge Dr Unit 10-104 Luminosa Delray Beach, FL | 3.0 | 2.0 | 1328 | $3,827 | $2.88 | 26d | 1 | 1.12mi |
| 14828 Golden Jax Ln Unit 8103 Delray Beach, FL | 2.0 | 2.0 | 1321 | $3,948 | $2.99 | 0d | 1 | 1.12mi |
| 14828 Golden Jax Ln Unit 8-105 Radiance Delray Beach, FL | 2.0 | 2.0 | 1321 | $3,948 | $2.99 | 16d | 1 | 1.12mi |
| 14828 Golden Jax Ln Unit 6-105 Radiance Delray Beach, FL | 2.0 | 2.0 | 1321 | $4,148 | $3.14 | 18d | 1 | 1.12mi |
| 7076 Huntington Ln #608 Delray Beach, FL | 2.0 | 2.0 | 1230 | $2,600 | $2.11 | 26d | 1 | 1.13mi |
| 14534 Highland Center Way Delray Beach, FL | 2.0 | 2.0 | 1319 | $3,400 | $2.58 | 9d | 1 | 1.18mi |
| 14800 Cumberland Dr Delray Beach, FL | 2.0–3.0 | 2.0 | 1324 | $3,948 | $2.98 | 0d | 4 | 1.21mi |
| 14747 Cumberland Dr #301 Delray Beach, FL | 2.0 | 2.0 | 1044 | $1,900 | $1.82 | 26d | 1 | 1.22mi |
| 14556 Wiley Range Rd Delray Beach, FL | 2.0 | 2.0 | 1319 | $3,000 | $2.27 | 26d | 1 | 1.22mi |
| 6795 Huntington Ln #406 Delray Beach, FL | 2.0 | 2.0 | 990 | $2,500 | $2.53 | 22d | 1 | 1.23mi |
| 6866 Huntington Ln #305 Delray Beach, FL | 2.0 | 2.0 | 1230 | $4,500 | $3.66 | 26d | 1 | 1.23mi |
| 14895 Builtmore Way Delray Beach, FL | 2.0 | 2.0 | 1103 | $1,800 | $1.63 | 26d | 1 | 1.25mi |
| 14898 Wedgefield Dr #202 Delray Beach, FL | 2.0 | 2.0 | 1103 | $2,000 | $1.81 | 19d | 1 | 1.25mi |
HOA detail
- Monthly dues
- $320 · $3,840/yr
Listing history 7 events
-
2026-05-08status Pending
-
2026-04-22$435,000 Active
-
2003-10-30soldstatus $182,500
-
2001-07-26historical
-
2000-02-15soldstatus $105,000
-
1999-08-16$118,000
-
1989-01-27soldstatus $114,500
ⓘ Source: listings_history table (triggers on properties + properties_extension) + one-shot
backfill from property_details.listing_events for pre-trigger history.
Tax reassessment forecast FL · Resets to sale price
- Current annual tax
- $2,446 · $204/mo
- Projected year-2 tax
- $3,610 · $301/mo
- Expected delta
- +$1,165/yr (+$97/mo · 47.6%)
ⓘ Screening estimate from a state-policy table — verify with the county assessor before closing.
Climate risk First Street
- Flood 1/10 Low FEMA zone X (unshaded) · 0% chance over 30 yrs
- Wildfire 3/10 Moderate
- Heat 9/10 Extreme 7 d/yr ≥107°F today · 26 d/yr by 30 yrs out
- Wind 10/10 Extreme 99% chance of damaging wind over 30 yrs
- Air quality 2/10 Low 0 unhealthy d/yr today · 2 by 30 yrs out
Nearby sold comps map
Loading sold comps map…
Walkable amenities ~0.75 mi
Loading nearby amenities…
Taxation est. · year 1
- Rental income
- $39,948
- − Mortgage interest
- −$24,367
- − Property taxes
- −$2,446
- − Insurance
- −$2,175
- − Repairs & maintenance
- −$3,196
- − Management
- −$3,196
- − HOA
- −$3,840
- − Depreciation
- −$12,655
- Taxable loss
- −$11,925
- Est. tax savings @ 24.0%
- +$2,862
- After-tax cash flow
- $-1,414/yr
For passive investors: Depreciation is non-cash, so a rental often shows a tax loss while cash-flowing — sheltering income. Rental losses are passive: they offset passive income freely, and up to $25,000/yr can offset ordinary (W-2) income if you actively participate and your MAGI is under $100k (phasing out to $0 by $150k); unused losses carry forward. On sale, claimed depreciation is recaptured at up to 25%, and gains may owe capital-gains tax (a 1031 exchange can defer both). Figures are a year-1 estimate at your 24.0% rate — not tax advice; consult a CPA.
Schools (NCES district)
- District
- Palm Beach
- NCES district ID
- 1201500
- Math proficiency
- 46% ▼ -16.00%
- Reading proficiency
- 53% ▼ -4.00%
- Median HH income
- $53,943
- Composite
- 42.72/100
- National rank
- #3160
- State rank
- #34 of 73 in FL
Livability — Delray Beach
- Score
- 77/100
- State rank
- #202
- US rank
- #3160
Category grades
Schools grade is shown separately in the Schools card above.
Census & demographics
- County
- Palm Beach County · 1,438,312 people
- City population
- 123,167
- Metro
- Miami-Fort Lauderdale-Pompano Beach, FL
- Population (ZIP)
- 28,431
- Household income
- $80,187
- Rent vs Own
- Severe rent burden
- 494.0
Population outlook (Palm Beach County) Hauer SSP2
- Today (2025)
- 1,637,487 people
- By 2030
- 1,743,255 · +6.5%
- By 2040
- 1,948,712 · +19.0%
- By 2050
- 2,132,979 · +30.3%
- By 2075
- 2,530,027 · +54.5%
- By 2100
- 2,706,979 · +65.3%
Race, ethnicity, and origin ACS 2023
- Neighborhood character
- Predominantly White (79%)
- Race & ethnicity
- White 79% Hispanic / Latino 13% Two or more races 9% Black 4%
- Hispanic origin (detail)
- Puerto Rican 3% Dominican 1%
- Common ancestry
- Romanian 9% Scotch-Irish 9% Italian 2%
- Foreign-born
- 20% · Canada, Jamaica, Guatemala
- Languages at home
- 80% English-only · Spanish 12% Other Indo-European 2% French/Haitian/Cajun 2%
Political lean MEDSL · Palm Beach
- 2024 margin
- Toss-up / Even · D 50.0% · R 49.2%
- 2008→2024 swing
- -22.1pp toward R · 2008: 22.9pp · 2024: 0.8pp
- All cycles
- 2024: D+0.8 2020: D+12.8 2016: D+15.3 2012: D+17.0 2008: D+22.9
Not yet ingested
- Civics
- —
Market trends
- HPI YoY
- ▲ 0.69%
- Current HPI
- 242.5138
- Rent YoY
- ▲ 0.51%
- Metro
- Miami-Fort Lauderdale-Pompano Beach, FL
- State GDP YoY
- ▲ 3.28%
- F500 in state
- 36
Industry mix (Fortune 500 HQ in FL)
| Industry | F500 HQs | Revenue |
|---|---|---|
| Industrial Technology | 2 | $29B |
|
||
| Insurance | 2 | $17B |
|
||
| Retail | 1 | $60B |
|
||
| Technology Distribution | 1 | $58B |
|
||
| Homebuilding | 1 | $35B |
|
||
| Technology Manufacturing | 1 | $35B |
|
||
Price history
+279.9% since first listed7 events — show timeline
- 2026-05-08 Pending — Beaches MLS
- 2026-04-22 Listed $435,000 Beaches MLS
- 2003-10-30 Sold (Public Records) $182,500 Public Records
- 2001-07-26 Listing Removed — Beaches MLS
- 2000-02-15 Sold (Public Records) $105,000 Public Records
- 1999-08-16 Listed $118,000 Beaches MLS
- 1989-01-27 Sold (Public Records) $114,500 Public Records
Property tax history
+0.7%/yrLatest (2025): $2,446 · +3.4% YoY. Source: county tax records.
Cash-flow waterfall
monthlySold comps — $/sqft
last 12 mo · ≤1 miLoading sold comps…