 Triplex
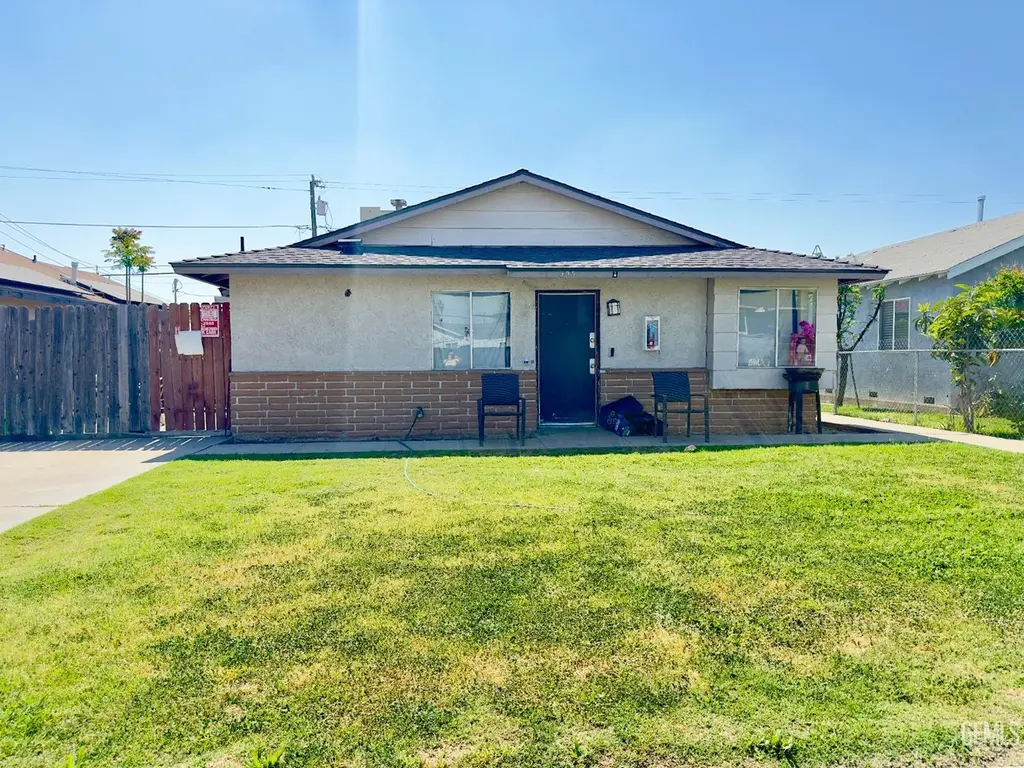
505 Washington Ave · Oildale, CA
Flood risk 1/10 · Minimal
- FEMA flood zone
- X (unshaded)
- Chance of flooding over 30 yrs
- 0.0%
- Est. flood insurance / yr
- $507 – $1,088
Fire risk 5/10 · Moderate
- Est. fire insurance / yr
- $659 – $1,223
Heat risk 8/10 · Major
- Hot days now (above 105°F)
- 7 days/yr
- Hot days in 30 yrs
- 16 days/yr
Wind risk 1/10 · Minimal
- Chance of severe wind over 30 yrs
- —
Air-quality risk 10/10 · Severe
- Unhealthy air days now
- 39 days/yr
- Unhealthy air days in 30 yrs
- 45 days/yr
Risk factors via First Street. Map © Google.
Why this score? — see what drove the D grade
The composite is a weighted blend of 9 inputs, each scored 0–100. Each bar is that input's sub-score; the figure is the points it added to the 100-point composite (weight × sub-score).
- Cash flow +17.7/30.0
- DSCR +5.5/10.0
- 1% rule +4.5/10.0
- Rent growth +3.1/5.0
- Livability +2.9/5.0
- Appreciation +2.7/10.0
- Condition / age +2.5/5.0
- Schools +2.1/10.0
- ARV discount +0.0/15.0
$420,000
🖨 Deal sheet (PDF) 📄 Offer letter ✓ Due diligence
Multi-family units
County records classify this as Multi-Family (2-4 Unit). Listing-text estimate: 3 units. confirmed
Listing remarks MLS
Opportunity for a triplex in Oildale. Each unit is 2 bedrooms, 1 bath. Alley access. Uncovered parking. Close to local amenities - shopping, school, and area park.
Key facts
- Alley access
- Triplex
- Uncovered parking
Tags
Neighborhood map
What this means for you Summary
Snapshot
- This is a 3 × 2-bed/1-bath units multifamily listed at $420k.
Deal economics
- At list price, monthly cash flow is $335 ($4k/yr) — positive. Per door: $112/mo.
- The deal already cash-flows at list — no discount required.
- To meet the 1% rule (rent ≥ 1% of price), the offer needs to be $398k (5.3% below list).
- Recommended offer: $395k (6.0% below list) — sets the bar for market timing.
- Cap rate 7.2% vs local median 3.9% in Oildale — top-decile yield for the area; either an underpriced asset or a hidden risk that comps aren't pricing in. Stress-test before assuming the spread holds.
Location & tenants
- Location reads 58/100 on livability (#680 in CA) — a working-class tenant base; expect higher turnover. Strengths: housing A+; Watch: crime F, amenities F, commute F.
- Standard Elementary (suburban): math 16% / reading 27% proficiency, ranked #1,227 of 1,400 in CA (top 88%) — low school quality limits family demand, transient renter base, plan for 1-2y turnover; 66% free/reduced lunch — lower-income household profile, screen leases tightly.
- Zoned schools: Wingland Elementary (751 students, 89% FRL); Standard Middle (991 students, 88% FRL); North High (reading 75%, 2,214 students, 87% FRL) — zoned schools average 88% FRL vs 66% district-wide (23 pts higher); higher-poverty schools than district average — tighter screening recommended.
- Market conditions: Rents rising (+2.2%/yr); 313 active listings in the ZIP; 3,244 units permitted in Kern County in 2024 (73 in 5+ unit buildings).
- At $3,978/mo this rent would consume 76% of the median local household income ($62k/yr) (locally 2931% of renters already pay >50% of income on rent) — very limited rent-growth headroom before tenants either downsize or default.
Forward outlook
- Local home prices are declining (-3.0%/yr); year-one equity from $3k of loan paydown is wiped out by about $13k of value loss. Plan a longer hold.
- Kern County population projected at +17% by 2050 — long-run rental-demand tailwind backs the buy-and-hold thesis.
Negotiation context
- It's been on market 90 days — a 6% lower offer ($395k) is reasonable based on typical stale-listing flexibility.
- 6 sale attempts since 22y ago with the ask held roughly flat each time — persistent listings suggest the price (not the market) is what's stuck; bring a comps-based counter.
- Current owner paid $160k; list at $420k implies a 162% gain — meaningful room to come down on a strong offer.
Risks & watch-outs
- Climate carrying-cost: moderate wildfire risk; extreme-heat days projected 7→16/yr by 2055 (HVAC capex compounding) — expect insurance premiums to compound above CPI over the hold.
Questions for the listing agent
- It's been on market 90 days. Have you received any prior offers? Is the seller open to a 6% concession, seller financing, or rate buy-down credit?
- Can we see the unit-by-unit rent roll, current vacancy, and any below-market leases? What's the average tenancy length?
- What capital expenditures (roof, boiler, parking lot, exteriors) have been made in the last 5 years, and what's planned in the next 2?
- Built in 1975 — when were the roof, HVAC, electrical panel, plumbing, and water heater last replaced?
- Why hasn't it sold? Are there any deal-killer items the seller is aware of (foundation, flood, title, zoning, code violations)?
- Is there a deadline driving the sale (1031 exchange, divorce, estate, relocation)? That informs how much negotiation room exists.
- Schools are B-rated — typically a magnet for longer-tenancy family renters. What's the average tenant stay here, and is there a school-zone premium baked into asking?
- Crime grade is F in this area — have there been break-ins, vandalism, or insurance claims at this property in the last 3 years? What carrier currently insures it and at what premium?
- The area grade is low — what's the realistic commute time and amenity access for the typical tenant pool here? Any planned neighborhood developments (good or bad) we should know about?
- What's the average days-on-market for RENTAL listings here right now (not sales)? A rising rental-DOM trend means longer vacancies and softer asking-rent achievability than the comps imply.
- What's the recent tenant-quality profile in this submarket — average credit score on applications, eviction rate, late-payment / NSF rate, and stable-employment percentage? A property-management company in the area should have these aggregated.
- How much new apartment / multifamily construction is in the pipeline within 1–3 miles? Heavy new supply (>2% of stock underway) typically softens rents 12–24 months out; light construction supports rent growth.
Investment metrics
- 1% rule
- 0.95% ✗
- Cap rate
- 7.25%
- Cash-on-cash
- 3.42%
- DSCR
- 1.15
- GRM
- 8.8
CMA / ARV
- ARV (median comp)
- $293,585
- List price
- $420,000
- Delta
- 43.06%
- Verdict
- OVERPRICED
- Comps
- 20 within 1.0 mi
Show comp detail 12 sales within ~0.75 mi
| Address | Dist | Beds/Ba | Sqft | Sold | Price | $/sf | Match |
|---|---|---|---|---|---|---|---|
| 505 Woodrow Ave | 0.06mi | 6/3.0 | 2,324 (0%) | 2mo | $355,000 | $153 | 95 |
| 522 Lincoln Ave / 908 Yosemite | 0.09mi | 6/2.0 | 2,228 (-4%) | 5mo | $240,000 | $108 | 80 |
| 222 Harding | 0.38mi | 6/3.5 | 2,220 (-4%) | 1mo | $428,000 | $193 | 72 |
| 414 Washington Ave | 0.10mi | 6/4.0 | 2,464 (+6%) | 14mo | $479,000 | $194 | 70 |
| 622 Lincoln Ave | 0.21mi | 6/3.0 | 2,208 (-5%) | 15mo | $382,000 | $173 | 69 |
| 441 Sequoia Dr | 0.39mi | 6/2.0 | 2,332 (+0%) | 13mo | $450,000 | $193 | 66 |
| 619 Ann Arbor Dr | 0.39mi | 6/3.0 | 2,479 (+7%) | 6mo | $340,000 | $137 | 66 |
| 723 Lincoln Ave | 0.34mi | 6/3.0 | 2,117 (-9%) | 7mo | $360,000 | $170 | 63 |
| 338 Norris Rd | 0.36mi | 5/5.0 (-1) | 2,388 (+3%) | 3mo | $490,000 | $205 | 63 |
| 820 Woodrow | 0.46mi | 7/3.0 (+1) | 2,556 (+10%) | 3mo | $545,000 | $213 | 54 |
| 115 Arvin St | 0.73mi | 5/5.0 (-1) | 2,420 (+4%) | 2mo | $500,000 | $207 | 45 |
| 1017 El Tejon Ave | 0.71mi | 5/5.0 (-1) | 2,475 (+6%) | 10mo | $465,000 | $188 | 35 |
Match score weights: distance 35% · size 25% · config 20% · recency 20%. Top-matched comps best support the ARV.
Projected returns pro-forma
-3.0% appreciation · 2.22% rent growth · sell at horizon
- IRR
- -11.8%
- Equity multiple
- 0.58×
- Total profit
- $-49,835
- Equity at exit
- $62,623
- IRR
- -3.8%
- Equity multiple
- 0.76×
- Total profit
- $-28,450
- Equity at exit
- $36,314
Cash invested: $117,600 (down + closing). Projections, not guarantees.
Landlord ↔ Tenant lean methodology
- Overall (STATE)
- 18 Strongly Tenant-Friendly
- State California
- 18 Strongly Tenant-Friendly · D+13
- County
- — inherits STATE
- City
- — inherits STATE
ZIP-level market 93308
- Home prices YoY
- -0.5%
- Rents YoY
- 2.2%
- Active inventory
- 313
- Price-to-rent
- 26.4×
Monthly cashflow live
- Estimated rent
- $3,978 high interval (Pro) →
- Mortgage (P&I)
- −$2,203
- Tax from tax record
- −$430 /mo · $5,164/yr
- Insurance
- −$175
- HOA
- −$0
- Vacancy / Maint / Mgmt
- −$835
- Net cashflow
- $335
Break-even live
Sensitivity live
| Price | -10% $572 | -5% $454 | +0% $335 | +5% $216 | +10% $97 |
|---|---|---|---|---|---|
| Rent | -10% $20 | -5% $178 | +0% $335 | +5% $492 | +10% $649 |
| Rate | -1.0pp $546 | -0.5pp $442 | base $335 | +0.5pp $226 | +1.0pp $115 |
3-unit breakdown (identical units grouped — click to expand)
| Units | Beds | Baths | Est. rent |
|---|---|---|---|
| 3× units | 2 | 1 | $3,978 |
| #1 | 2 | 1 | $1,326 |
| #2 | 2 | 1 | $1,326 |
| #3 | 2 | 1 | $1,326 |
| Total (3 units) | $3,978 | ||
UW: 25.0% down · 7.5% · 30yr · 1.5% tax · 5.0% vac · 8.0% maint · 8.0% mgmt
Financing live
Cash to close
- Down payment
- $105,000
- Closing costs
- $12,600
- Reserves months
- —
- Total cash needed
- —
Loan-product check · same deal, 3 products live
Conventional
25% down · 7.5% · 30yr
- Down + closing
- —
- Monthly P&I
- —
- Monthly cashflow
- —
- DSCR
- —
- Eligible?
- —
Personal DTI + credit; lowest rate.
DSCR
20% down · 8.5% · 30yr
- Down + closing
- —
- Monthly P&I
- —
- Monthly cashflow
- —
- DSCR
- —
- Eligible?
- —
No personal income docs; deal must DSCR.
Hard money
10% down · 12.0% · 12mo
- Down + closing
- —
- Monthly P&I
- —
- Monthly cashflow
- —
- DSCR
- —
- Eligible?
- —
Short-term bridge; refi at stabilization.
Listing history 36 events
-
2026-06-18days on market $420,000 Active 90 DOM
-
2026-06-17days on market $420,000 Active 89 DOM
-
2026-06-16days on market $420,000 Active 88 DOM
-
2026-06-15days on market $420,000 Active 87 DOM
-
2026-06-14days on market $420,000 Active 85 DOM
-
2026-06-10days on market $420,000 Active 82 DOM
-
2026-06-09days on market $420,000 Active 81 DOM
-
2026-06-08days on market $420,000 Active 80 DOM
-
2026-06-07days on market $420,000 Active 79 DOM
-
2026-06-05days on market $420,000 Active 76 DOM
-
2026-06-03days on market $420,000 Active 75 DOM
-
2026-06-03days on market $420,000 Active 74 DOM
-
2026-06-01days on market $420,000 Active 73 DOM
-
2026-05-31days on market $420,000 Active 72 DOM
-
2026-04-28price $420,000 163-char remark
Show marketing remark (163 chars)
Opportunity for a triplex in Oildale. Each unit is 2 bedrooms, 1 bath. Alley access. Uncovered parking. Close to local amenities - shopping, school, and area park.
-
2026-03-18$430,000 Active 163-char remark
Show marketing remark (163 chars)
Opportunity for a triplex in Oildale. Each unit is 2 bedrooms, 1 bath. Alley access. Uncovered parking. Close to local amenities - shopping, school, and area park.
-
2025-04-22$450,000 Active
-
2015-03-19soldstatus $160,000
-
2015-03-19soldstatus $160,000
-
2015-01-24historical
-
2015-01-24price $165,000
-
2015-01-16$160,000
-
2013-03-05soldstatus $136,000
-
2013-03-04soldstatus $136,000
-
2013-02-25historical
-
2013-02-25price $140,000
-
2013-01-04$136,000
-
2010-03-18soldstatus $110,000
-
2010-03-18soldstatus $110,000
-
2009-08-14historical
-
2009-08-14$110,000
-
2005-05-10soldstatus $270,000
-
2005-05-10soldstatus $270,000
-
2005-02-28historical
-
2004-11-08$270,000
-
1991-03-15soldstatus $89,000
ⓘ Source: listings_history table (triggers on properties + properties_extension) + one-shot
backfill from property_details.listing_events for pre-trigger history.
Tax reassessment forecast CA · Resets to sale price
- Current annual tax
- $5,164 · $430/mo
- Projected year-2 tax
- $5,164 · $430/mo
- Expected delta
- $0/yr ($0/mo · 0.0%)
ⓘ Screening estimate from a state-policy table — verify with the county assessor before closing.
Climate risk First Street
- Flood 1/10 Low FEMA zone X (unshaded) · 0% chance over 30 yrs
- Wildfire 5/10 Major
- Heat 8/10 Severe 7 d/yr ≥105°F today · 16 d/yr by 30 yrs out
- Wind 1/10 Low
- Air quality 10/10 Extreme 39 unhealthy d/yr today · 45 by 30 yrs out
Nearby sold comps map
Loading sold comps map…
Walkable amenities ~0.75 mi
Loading nearby amenities…
Taxation est. · year 1
- Rental income
- $47,736
- − Mortgage interest
- −$23,527
- − Property taxes
- −$5,164
- − Insurance
- −$2,100
- − Repairs & maintenance
- −$3,819
- − Management
- −$3,819
- − Depreciation
- −$12,218
- Taxable loss
- −$2,911
- Est. tax savings @ 24.0%
- +$699
- After-tax cash flow
- $4,715/yr
For passive investors: Depreciation is non-cash, so a rental often shows a tax loss while cash-flowing — sheltering income. Rental losses are passive: they offset passive income freely, and up to $25,000/yr can offset ordinary (W-2) income if you actively participate and your MAGI is under $100k (phasing out to $0 by $150k); unused losses carry forward. On sale, claimed depreciation is recaptured at up to 25%, and gains may owe capital-gains tax (a 1031 exchange can defer both). Figures are a year-1 estimate at your 24.0% rate — not tax advice; consult a CPA.
Schools (NCES district)
- District
- Standard Elementary
- NCES district ID
- 0637890
- Math proficiency
- 16% ▬ 0.00%
- Reading proficiency
- 27% ▼ -3.00%
- Median HH income
- $40,574
- Composite
- 21.42/100
- National rank
- #13640
- State rank
- #1227 of 1400 in CA
Livability — Oildale
- Score
- 58/100
- State rank
- #680
- US rank
- #20848
Category grades
Schools grade is shown separately in the Schools card above.
Census & demographics
- Census place
- Oildale, CA
- County
- Kern County · 710,371 people
- Metro
- Bakersfield, CA
- Population (ZIP)
- 55,078
- Household income
- $62,445
- Rent vs Own
- Severe rent burden
- 2931.0
Population outlook (Kern County) Hauer SSP2
- Today (2025)
- 947,286 people
- By 2030
- 978,984 · +3.3%
- By 2040
- 1,045,018 · +10.3%
- By 2050
- 1,105,232 · +16.7%
- By 2075
- 1,229,538 · +29.8%
- By 2100
- 1,238,059 · +30.7%
Race, ethnicity, and origin ACS 2023
- Neighborhood character
- Diverse neighborhood (Simpson 0.57)
- Race & ethnicity
- White 57% Hispanic / Latino 32% Two or more races 15% Black 3% Asian 3% Native American 1%
- Hispanic origin (detail)
- Mexican 26%
- Common ancestry
- Slovak 3% Italian 1% Romanian 1%
- Foreign-born
- 8% · Canada, Vietnam
- Languages at home
- 80% English-only · Spanish 17%
Political lean MEDSL · Kern
- 2024 margin
- Strong R (+21.1) · D 38.2% · R 59.3% · Other 2.5%
- 2008→2024 swing
- -3.3pp toward R · 2008: -17.8pp · 2024: -21.1pp
- All cycles
- 2024: R+21.1 2020: R+10.2 2016: R+15.0 2012: R+20.9 2008: R+17.8
Not yet ingested
- Civics
- —
Market trends
- HPI YoY
- ▼ -4.52%
- Current HPI
- 825.65
- Rent YoY
- ▲ 2.22%
- Metro
- Bakersfield, CA
- State GDP YoY
- ▲ 3.21%
- F500 in state
- 116
Industry mix (Fortune 500 HQ in CA)
| Industry | F500 HQs | Revenue |
|---|---|---|
| Technology | 27 | $1,492B |
|
||
| Financial Services | 3 | $174B |
|
||
| Retail | 3 | $44B |
|
||
| Insurance | 3 | $26B |
|
||
| Media / Entertainment | 2 | $115B |
|
||
| Pharmaceuticals / Biotech | 2 | $62B |
|
||
Price history
+371.9% since first listed22 events — show timeline
- 2026-04-28 Price Changed $420,000 GEMLS
- 2026-03-18 Listed $430,000 GEMLS
- 2025-04-22 Listed $450,000 GEMLS
- 2015-03-19 Sold (Public Records) $160,000 Public Records
- 2015-03-19 Sold (MLS) $160,000 GEMLS
- 2015-01-24 Price Changed $165,000 GEMLS
- 2015-01-24 Delisted — GEMLS
- 2015-01-16 Listed $160,000 GEMLS
- 2013-03-05 Sold (Public Records) $136,000 Public Records
- 2013-03-04 Sold (MLS) $136,000 GEMLS
- 2013-02-25 Price Changed $140,000 GEMLS
- 2013-02-25 Delisted — GEMLS
- 2013-01-04 Listed $136,000 GEMLS
- 2010-03-18 Sold (Public Records) $110,000 Public Records
- 2010-03-18 Sold (MLS) $110,000 GEMLS
- 2009-08-14 Listed $110,000 GEMLS
- 2009-08-14 Delisted — GEMLS
- 2005-05-10 Sold (Public Records) $270,000 Public Records
- 2005-05-10 Sold (MLS) $270,000 GEMLS
- 2005-02-28 Delisted — GEMLS
- 2004-11-08 Listed $270,000 GEMLS
- 1991-03-15 Sold (Public Records) $89,000 Public Records
Property tax history
+4.5%/yrLatest (2025): $5,164 · +3.6% YoY. Source: county tax records.
Cash-flow waterfall
monthlySold comps — $/sqft
last 12 mo · ≤1 miLoading sold comps…