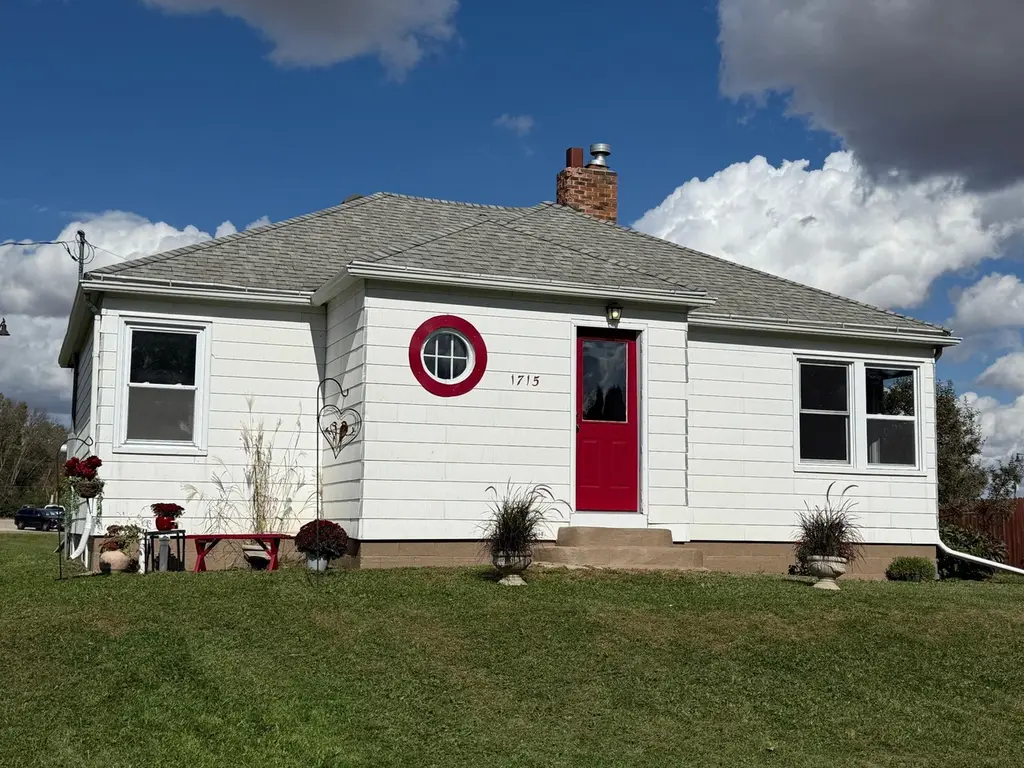
1715 SE Marshall St · Albert Lea, MN
Flood risk 1/10 · Minimal
- FEMA flood zone
- X (unshaded)
- Chance of flooding over 30 yrs
- 0.0%
- Est. flood insurance / yr
- $507 – $1,088
Fire risk 1/10 · Minimal
- Est. fire insurance / yr
- $888 – $1,650
Heat risk 2/10 · Minimal
- Hot days now (above 99°F)
- 7 days/yr
- Hot days in 30 yrs
- 16 days/yr
Wind risk 2/10 · Minimal
- Chance of severe wind over 30 yrs
- —
Air-quality risk 1/10 · Minimal
- Unhealthy air days now
- 0 days/yr
- Unhealthy air days in 30 yrs
- 0 days/yr
Risk factors via First Street. Map © Google.
Why this score? — see what drove the D grade
The composite is a weighted blend of 9 inputs, each scored 0–100. Each bar is that input's sub-score; the figure is the points it added to the 100-point composite (weight × sub-score).
- ARV discount +15.0/15.0
- Cash flow +11.2/30.0
- Livability +3.6/5.0
- DSCR +3.3/10.0
- Schools +3.0/10.0
- 1% rule +2.6/10.0
- Rent growth +2.5/5.0
- Condition / age +2.5/5.0
- Appreciation +0.0/10.0
$169,900
🖨 Deal sheet (PDF) 📄 Offer letter ✓ Due diligence
Listing remarks MLS
Be the first to move in to this completely remodeled 3 bed, 2 bath ranch home on 3/4 acre lot! New flooring, new and updated baths, newer windows, paint, etc.!!! Gas fireplace in living room to keep you cozy as the temperatures drop! New furnace, hot water heater, central air and electrical breakers! Large circular driveway for plenty of parking. Can be used for a business per zoning!!!
Key facts
- Updated baths
- Newer furnace
- Completely remodeled
Tags
Neighborhood map
What this means for you Summary
Snapshot
- This is a 3-bed/2.0-bath single-family listed at $170k.
Deal economics
- At list price, monthly cash flow is $-67 ($-801/yr) — negative.
- To cash-flow at today's rent, offer at most $158k (6.9% below list).
- To meet the 1% rule (rent ≥ 1% of price), the offer needs to be $129k (24.1% below list).
- Recommended offer: $129k (24.1% below list) — sets the bar for 1% rule.
- Cap rate 5.8% vs local median 4.1% in Albert Lea — top-decile yield for the area; either an underpriced asset or a hidden risk that comps aren't pricing in. Stress-test before assuming the spread holds.
Location & tenants
- Location reads 72/100 on livability (#274 in MN) — a middle-class / working-renter tenant base. Strengths: cost of living A+, housing A+, health & safety A+; Watch: employment D+, amenities F, commute F.
- Albert Lea Public School District (town): math 30% / reading 40% proficiency, ranked #258 of 301 in MN (top 86%) — families likely to look elsewhere, expect single-tenant / working-renter base with shorter leases.
- Zoned schools: Hawthorne Elementary (math 27% / reading 37%, grade F, #670 of 857 statewide, top 79%, 424 students, 69% FRL); Southwest Middle (math 19% / reading 38%, grade F, #210 of 258 statewide, top 81%, 474 students, 62% FRL); Albert Lea Senior High (math 23% / reading 37%, grade F, #345 of 471 statewide, top 74%, 1,218 students, 53% FRL) — zoned schools average 61% FRL vs 40% district-wide (22 pts higher); higher-poverty schools than district average — tighter screening recommended.
- Market conditions: 154 active listings in the ZIP; 1 comparable units currently listed for rent nearby; 16 units permitted in Freeborn County in 2024 (0 in 5+ unit buildings).
Forward outlook
- Local home prices are declining (-3.0%/yr); year-one equity from $1k of loan paydown is wiped out by about $5k of value loss. Plan a longer hold.
- Freeborn County population projected at -11% by 2050 — secular population decline; favor cash flow + early exit over multi-decade hold.
Negotiation context
- It's been on market 257 days — a 12% lower offer ($150k) is reasonable based on typical stale-listing flexibility.
- 2 sale attempts; this cycle's ask has dropped $30k (15%) from the opening price — seller is motivated, your offer sets the floor, not the list.
Risks & watch-outs
- Watch-outs: built in 1940 — expect roof / HVAC / electrical / plumbing capex.
Questions for the listing agent
- What do current leases actually rent for vs. the listed asking? Can we see a recent rent roll and the last 12 months of T-12 income?
- It's been on market 257 days. Have you received any prior offers? Is the seller open to a 24% concession, seller financing, or rate buy-down credit?
- Built in 1940 — when were the roof, HVAC, electrical panel, plumbing, and water heater last replaced?
- Why hasn't it sold? Are there any deal-killer items the seller is aware of (foundation, flood, title, zoning, code violations)?
- Is there a deadline driving the sale (1031 exchange, divorce, estate, relocation)? That informs how much negotiation room exists.
- The area grade is low — what's the realistic commute time and amenity access for the typical tenant pool here? Any planned neighborhood developments (good or bad) we should know about?
- What's the average days-on-market for RENTAL listings here right now (not sales)? A rising rental-DOM trend means longer vacancies and softer asking-rent achievability than the comps imply.
- What's the recent tenant-quality profile in this submarket — average credit score on applications, eviction rate, late-payment / NSF rate, and stable-employment percentage? A property-management company in the area should have these aggregated.
- How much new for-sale + rental construction is in the pipeline within 1–3 miles? Heavy new supply typically softens prices + rents 12–24 months out; constrained supply supports both.
Investment metrics
- 1% rule
- 0.76% ✗
- Cap rate
- 5.82%
- Cash-on-cash
- -1.68%
- DSCR
- 0.93
- GRM
- 11.0
CMA / ARV
- ARV (median comp)
- $262,443
- List price
- $169,900
- Delta
- -35.26%
- Verdict
- UNDERPRICED
- Comps
- 2 within 1.0 mi
Projected returns pro-forma
-3.0% appreciation · 3.0% rent growth · sell at horizon
- IRR
- -19.1%
- Equity multiple
- 0.33×
- Total profit
- $-31,817
- Equity at exit
- $25,333
- IRR
- -11.8%
- Equity multiple
- 0.30×
- Total profit
- $-33,321
- Equity at exit
- $14,690
Cash invested: $47,572 (down + closing). Projections, not guarantees.
Landlord ↔ Tenant lean methodology
- Overall (STATE)
- 46 Balanced
- State Minnesota
- 46 Balanced · D+2
- County
- — inherits STATE
- City
- — inherits STATE
ZIP-level market 56007
- Home prices YoY
- -22.3%
- Active inventory
- 154
- Price-to-rent
- 11.0×
Monthly cashflow live
- Estimated rent
- $1,290 medium interval (Pro) →
- Mortgage (P&I)
- −$891
- Tax from tax record
- −$124 /mo · $1,492/yr
- Insurance
- −$71
- HOA
- −$0
- Vacancy / Maint / Mgmt
- −$271
- Net cashflow
- $-67
Break-even live
Sensitivity live
| Price | -10% $29 | -5% $-19 | +0% $-67 | +5% $-115 | +10% $-163 |
|---|---|---|---|---|---|
| Rent | -10% $-169 | -5% $-118 | +0% $-67 | +5% $-16 | +10% $35 |
| Rate | -1.0pp $19 | -0.5pp $-24 | base $-67 | +0.5pp $-111 | +1.0pp $-156 |
UW: 25.0% down · 7.5% · 30yr · 1.5% tax · 5.0% vac · 8.0% maint · 8.0% mgmt
Financing live
Cash to close
- Down payment
- $42,475
- Closing costs
- $5,097
- Reserves months
- —
- Total cash needed
- —
Loan-product check · same deal, 3 products live
Conventional
25% down · 7.5% · 30yr
- Down + closing
- —
- Monthly P&I
- —
- Monthly cashflow
- —
- DSCR
- —
- Eligible?
- —
Personal DTI + credit; lowest rate.
DSCR
20% down · 8.5% · 30yr
- Down + closing
- —
- Monthly P&I
- —
- Monthly cashflow
- —
- DSCR
- —
- Eligible?
- —
No personal income docs; deal must DSCR.
Hard money
10% down · 12.0% · 12mo
- Down + closing
- —
- Monthly P&I
- —
- Monthly cashflow
- —
- DSCR
- —
- Eligible?
- —
Short-term bridge; refi at stabilization.
Rent comps 1 comps
| Address | Beds | Baths | Sqft | Rent | $/sqft | DOM | Units | Dist |
|---|---|---|---|---|---|---|---|---|
| 1307 Saint Joseph Ave Albert Lea, MN | 2.0 | 1.0 | 1101 | $1,050 | $0.95 | 45d | 1 | 1.30mi |
Listing history 23 events
-
2026-06-22days on market $169,900 Active 257 DOM
-
2026-06-19days on market $169,900 Active 254 DOM
-
2026-06-18days on market $169,900 Active 253 DOM
-
2026-06-17days on market $169,900 Active 252 DOM
-
2026-06-16days on market $169,900 Active 251 DOM
-
2026-06-15days on market $169,900 Active 250 DOM
-
2026-06-14days on market $169,900 Active 248 DOM
-
2026-06-12days on market $169,900 Active 247 DOM
-
2026-06-09days on market $169,900 Active 244 DOM
-
2026-06-08days on market $169,900 Active 243 DOM
-
2026-06-07days on market $169,900 Active 242 DOM
-
2026-06-05days on market $169,900 Active 239 DOM
-
2026-06-03days on market $169,900 Active 238 DOM
-
2026-06-02days on market $169,900 Active 237 DOM
-
2026-06-01days on market $169,900 Active 236 DOM
-
2026-05-31days on market $169,900 Active 235 DOM
-
2026-05-30days on market $169,900 Active 234 DOM
-
2026-04-17price $179,900 394-char remark
Show marketing remark (394 chars)
Be the first to move in to this completely remodeled 3 bed, 2 bath ranch home on 3/4 acre lot! New flooring, new and updated baths, newer windows, paint, etc.!!! Gas fireplace in living room to keep you cozy as the temperatures drop! New furnace, hot water heater, central air and electrical breakers! Large circular driveway for plenty of parking. Can be used for a business per zoning!!!
-
2025-12-04price $189,900 394-char remark
Show marketing remark (394 chars)
Be the first to move in to this completely remodeled 3 bed, 2 bath ranch home on 3/4 acre lot! New flooring, new and updated baths, newer windows, paint, etc.!!! Gas fireplace in living room to keep you cozy as the temperatures drop! New furnace, hot water heater, central air and electrical breakers! Large circular driveway for plenty of parking. Can be used for a business per zoning!!!
-
2025-10-08$199,900 Active 394-char remark
Show marketing remark (394 chars)
Be the first to move in to this completely remodeled 3 bed, 2 bath ranch home on 3/4 acre lot! New flooring, new and updated baths, newer windows, paint, etc.!!! Gas fireplace in living room to keep you cozy as the temperatures drop! New furnace, hot water heater, central air and electrical breakers! Large circular driveway for plenty of parking. Can be used for a business per zoning!!!
-
2025-09-17historical
-
2025-09-06price $230,000
-
2025-01-20$293,000 Active
ⓘ Source: listings_history table (triggers on properties + properties_extension) + one-shot
backfill from property_details.listing_events for pre-trigger history.
Tax reassessment forecast MN · Partial reset (capped growth)
- Current annual tax
- $1,492 · $124/mo
- Projected year-2 tax
- $1,697 · $141/mo
- Expected delta
- +$205/yr (+$17/mo · 13.8%)
ⓘ Screening estimate from a state-policy table — verify with the county assessor before closing.
Climate risk First Street
- Flood 1/10 Low FEMA zone X (unshaded) · 0% chance over 30 yrs
- Wildfire 1/10 Low
- Heat 2/10 Low 7 d/yr ≥99°F today · 16 d/yr by 30 yrs out
- Wind 2/10 Low
- Air quality 1/10 Low 0 unhealthy d/yr today · 0 by 30 yrs out
Nearby sold comps map
Loading sold comps map…
Walkable amenities ~0.75 mi
Loading nearby amenities…
Taxation est. · year 1
- Rental income
- $15,484
- − Mortgage interest
- −$9,517
- − Property taxes
- −$1,492
- − Insurance
- −$850
- − Repairs & maintenance
- −$1,239
- − Management
- −$1,239
- − Depreciation
- −$4,943
- Taxable loss
- −$3,795
- Est. tax savings @ 24.0%
- +$911
- After-tax cash flow
- $110/yr
For passive investors: Depreciation is non-cash, so a rental often shows a tax loss while cash-flowing — sheltering income. Rental losses are passive: they offset passive income freely, and up to $25,000/yr can offset ordinary (W-2) income if you actively participate and your MAGI is under $100k (phasing out to $0 by $150k); unused losses carry forward. On sale, claimed depreciation is recaptured at up to 25%, and gains may owe capital-gains tax (a 1031 exchange can defer both). Figures are a year-1 estimate at your 24.0% rate — not tax advice; consult a CPA.
Schools (NCES district)
- District
- Albert Lea Public School District
- NCES district ID
- 2702970
- Math proficiency
- 30% ▼ -14.00%
- Reading proficiency
- 40% ▼ -8.00%
- Median HH income
- $42,776
- Composite
- 29.62/100
- National rank
- #6472
- State rank
- #258 of 301 in MN
Livability — Albert Lea
- Score
- 72/100
- State rank
- #274
- US rank
- #5963
Category grades
Schools grade is shown separately in the Schools card above.
Census & demographics
- Census place
- Albert Lea, MN
- County
- Freeborn County · 21,377 people
- City population
- 21,377
- Metro
- Albert Lea, MN
- Population (ZIP)
- 21,377
- Household income
- $68,846
- Rent vs Own
- Severe rent burden
- 483.0
Population outlook (Freeborn County) Hauer SSP2
- Today (2025)
- 29,680 people
- By 2030
- 29,038 · -2.2%
- By 2040
- 27,650 · -6.8%
- By 2050
- 26,387 · -11.1%
- By 2075
- 25,224 · -15.0%
- By 2100
- 23,842 · -19.7%
Race, ethnicity, and origin ACS 2023
- Neighborhood character
- Predominantly White (79%)
- Race & ethnicity
- White 79% Hispanic / Latino 14% Two or more races 8% Asian 4% Black 2%
- Hispanic origin (detail)
- Mexican 11%
- Common ancestry
- Portuguese 23% Iranian 3% Romanian 2%
- Foreign-born
- 4% · Canada, Philippines
- Languages at home
- 90% English-only · Spanish 7% Other Asian/Pacific 3%
Political lean MEDSL · Freeborn
- 2024 margin
- Strong R (+21.3) · D 38.7% · R 60.0% · Other 1.3%
- 2008→2024 swing
- -38.5pp toward R · 2008: 17.1pp · 2024: -21.3pp
- All cycles
- 2024: R+21.3 2020: R+16.0 2016: R+17.4 2012: D+14.2 2008: D+17.1
Not yet ingested
- Civics
- —
Market trends
- HPI YoY
- ▼ -63.40%
- Current HPI
- 220.7963
- Rent YoY
- —
- Metro
- Albert Lea, MN
- State GDP YoY
- ▲ 2.41%
- F500 in state
- 34
Industry mix (Fortune 500 HQ in MN)
| Industry | F500 HQs | Revenue |
|---|---|---|
| Healthcare | 2 | $407B |
|
||
| Retail | 2 | $150B |
|
||
| Consumer Goods | 2 | $32B |
|
||
| Industrial Machinery | 2 | $6B |
|
||
| Agriculture | 1 | $40B |
|
||
| Healthcare / Medical Devices | 1 | $32B |
|
||
Price history
-38.6% since first listed6 events — show timeline
- 2026-04-17 Price Changed $179,900 NORTHSTARMLS as Distributed by MLS Grid
- 2025-12-04 Price Changed $189,900 NORTHSTARMLS as Distributed by MLS Grid
- 2025-10-08 Listed $199,900 NORTHSTARMLS as Distributed by MLS Grid
- 2025-09-17 Listing Removed — NORTHSTARMLS as Distributed by MLS Grid
- 2025-09-06 Price Changed $230,000 NORTHSTARMLS as Distributed by MLS Grid
- 2025-01-20 Listed $293,000 NORTHSTARMLS as Distributed by MLS Grid
Property tax history
-4.9%/yrLatest (2025): $1,492 · +14.8% YoY. Source: county tax records.
Cash-flow waterfall
monthlySold comps — $/sqft
last 12 mo · ≤1 miLoading sold comps…