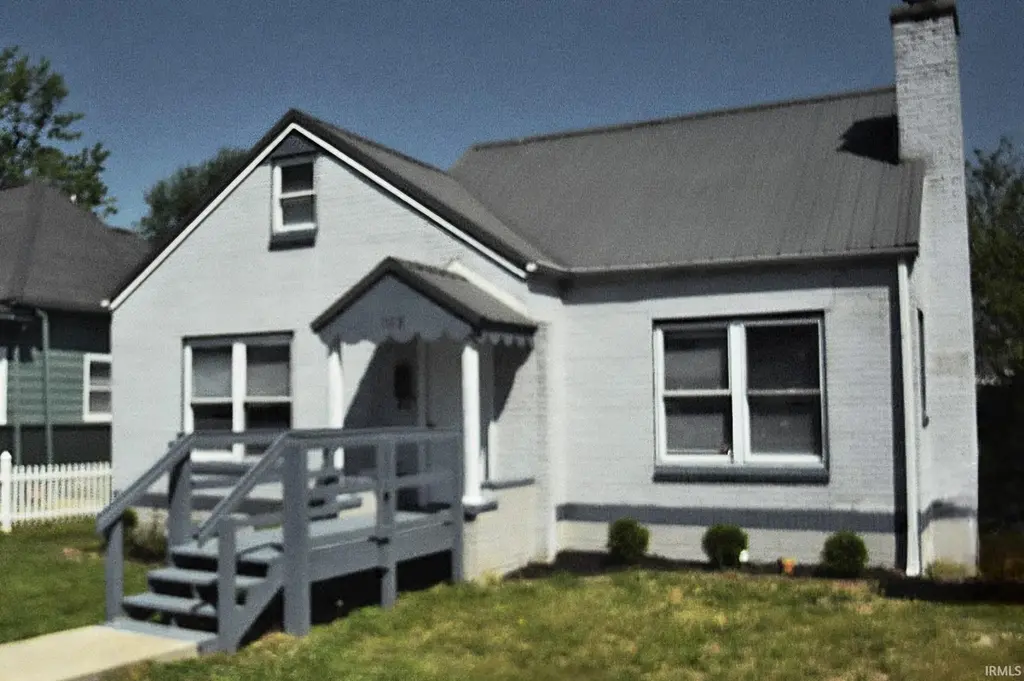
1113 W Oak St · Mitchell, IN
Flood risk 1/10 · Minimal
- FEMA flood zone
- X (unshaded)
- Chance of flooding over 30 yrs
- 0.0%
- Est. flood insurance / yr
- $507 – $1,088
Fire risk 2/10 · Minimal
- Est. fire insurance / yr
- $717 – $1,331
Heat risk 5/10 · Moderate
- Hot days now (above 104°F)
- 7 days/yr
- Hot days in 30 yrs
- 20 days/yr
Wind risk 2/10 · Minimal
- Chance of severe wind over 30 yrs
- 1.0%
Air-quality risk 2/10 · Minimal
- Unhealthy air days now
- 1 days/yr
- Unhealthy air days in 30 yrs
- 2 days/yr
Risk factors via First Street. Map © Google.
Why this score? — see what drove the C- grade
The composite is a weighted blend of 9 inputs, each scored 0–100. Each bar is that input's sub-score; the figure is the points it added to the 100-point composite (weight × sub-score).
- ARV discount +15.0/15.0
- Cash flow +13.2/30.0
- Appreciation +5.3/10.0
- DSCR +4.0/10.0
- Livability +3.5/5.0
- 1% rule +2.8/10.0
- Schools +2.7/10.0
- Rent growth +2.5/5.0
- Condition / age +2.5/5.0
$165,000
🖨 Deal sheet 📄 Offer letter ✓ Due diligence
Listing remarks MLS
This is a one time showing.
Key facts
- New pex water lines
- Brick cottage style
- Large backyard
Tags
Property features AI
Exterior
- Parking: Gravel and concrete off-street parking
- Utilities: Public water; Public sewer
- Home design: Single-family residence (site-built); One story
- Construction: Brick construction; Metal roof; Stone foundation; Built as site-built home
- Exterior features: Covered porch; Patio; Level, landscaped lot; Workshop and shed(s) on the property
Interior
- Kitchen: No appliances listed
- Bedrooms: Total of 5 rooms (includes bedrooms and living areas)
- Flooring: Carpet; Vinyl
- Bathrooms: 1 full bathroom (main level)
- Heating & cooling: Natural gas forced-air heating; Central air conditioning
- Interior features: Living room fireplace (wood burning); Crawl space basement
- Laundry & utility: Gas dryer hookup on the main level
Neighborhood map
What this means for you Summary
Snapshot
- This is a 2-bed/1.0-bath single-family listed at $165k.
Deal economics
- At list price, monthly cash flow is $-3 ($-31/yr) — negative.
- To cash-flow at today's rent, offer at most $165k (0.3% below list).
- To meet the 1% rule (rent ≥ 1% of price), the offer needs to be $128k (22.2% below list).
- Recommended offer: $128k (22.2% below list) — sets the bar for 1% rule.
Location & tenants
- Location reads 69/100 on livability (#187 in IN) — a middle-class / working-renter tenant base. Strengths: cost of living A+, housing A+, crime B; Watch: employment D, amenities F, commute F.
- Mitchell Community Schools (town): math 26% / reading 37% proficiency, ranked #230 of 301 in IN (top 76%) — families likely to look elsewhere, expect single-tenant / working-renter base with shorter leases.
- Zoned schools: Mitchell Jr High School (math 16% / reading 33%, grade F, #251 of 330 statewide, top 77%, 359 students, 61% FRL); Mitchell High School (math 32% / reading 67%, grade D, #123 of 369 statewide, top 36%, 436 students, 51% FRL).
- Market conditions: 61 active listings in the ZIP; 8 units permitted in Lawrence County in 2024 (0 in 5+ unit buildings).
Forward outlook
- In year one you build about $2k of equity ($1k loan paydown + $1k appreciation (0.6% local appreciation)).
- Lawrence County population projected at -14% by 2050 — secular population decline; favor cash flow + early exit over multi-decade hold.
Negotiation context
- It's been on market 52 days — a 3% lower offer ($160k) is reasonable based on typical stale-listing flexibility.
- 6 sale attempts since 13y ago with the ask held roughly flat each time — persistent listings suggest the price (not the market) is what's stuck; bring a comps-based counter.
- Current owner paid $59k; list at $165k implies a 179% gain — meaningful room to come down on a strong offer.
Risks & watch-outs
- Watch-outs: built in 1925 — expect roof / HVAC / electrical / plumbing capex.
- Climate carrying-cost: extreme-heat days projected 7→20/yr by 2055 (HVAC capex compounding) — expect insurance premiums to compound above CPI over the hold.
Questions for the listing agent
- What do current leases actually rent for vs. the listed asking? Can we see a recent rent roll and the last 12 months of T-12 income?
- It's been on market 52 days. Have you received any prior offers? Is the seller open to a 22% concession, seller financing, or rate buy-down credit?
- Built in 1925 — when were the roof, HVAC, electrical panel, plumbing, and water heater last replaced?
- Is there a deadline driving the sale (1031 exchange, divorce, estate, relocation)? That informs how much negotiation room exists.
- Schools are D-rated, which usually means shorter tenancies and higher turnover. Who's the typical renter profile here, and what's been the actual vacancy rate?
- What's the average days-on-market for RENTAL listings here right now (not sales)? A rising rental-DOM trend means longer vacancies and softer asking-rent achievability than the comps imply.
- What's the recent tenant-quality profile in this submarket — average credit score on applications, eviction rate, late-payment / NSF rate, and stable-employment percentage? A property-management company in the area should have these aggregated.
- How much new for-sale + rental construction is in the pipeline within 1–3 miles? Heavy new supply typically softens prices + rents 12–24 months out; constrained supply supports both.
Investment metrics
- 1% rule
- 0.78% ✗
- Cap rate
- 6.27%
- Cash-on-cash
- -0.07%
- DSCR
- 1.00
- GRM
- 10.7
CMA / ARV
- ARV (median comp)
- $214,147
- List price
- $165,000
- Delta
- -22.95%
- Verdict
- UNDERPRICED
- Comps
- 20 within 1.0 mi
Show comp detail 12 sales within ~0.75 mi
| Address | Dist | Beds/Ba | Sqft | Sold | Price | $/sf | Match |
|---|---|---|---|---|---|---|---|
| 1215 W Warren St | 0.16mi | 2/1.0 | 858 (-1%) | 1mo | $150,000 | $175 | 90 |
| 1211 & 1209 W Main St | 0.22mi | 2/1.0 | 867 (+0%) | 1mo | $145,000 | $167 | 89 |
| 1134 N Marion St | 0.50mi | 2/1.0 | 863 (-0%) | 2mo | $147,000 | $170 | 74 |
| 844 W Frank St | 0.39mi | 2/1.0 | 908 (+5%) | 0mo | $150,000 | $165 | 74 |
| 1330 W Crandall St | 0.41mi | 2/1.0 | 840 (-3%) | 4mo | $135,000 | $161 | 72 |
| 512 W Mississippi Ave | 0.51mi | 2/1.0 | 852 (-2%) | 1mo | $122,000 | $143 | 72 |
| 507 W Oak St | 0.39mi | 2/1.0 | 912 (+5%) | 6mo | $121,000 | $133 | 68 |
| 455 S 9th St | 0.58mi | 2/1.0 | 900 (+4%) | 11mo | $167,500 | $186 | 58 |
| 609 W Grissom Ave | 0.53mi | 2/1.5 | 902 (+4%) | 15mo | $24,000 | $27 | 54 |
| 201 W Main St | 0.67mi | 1/1.0 (-1) | 884 (+2%) | 8mo | $125,000 | $141 | 53 |
| 421 W Warren St | 0.49mi | 2/1.0 | 956 (+10%) | 12mo | $140,000 | $146 | 50 |
| 402 W Hancock Ave | 0.55mi | 2/1.0 | 960 (+11%) | 12mo | $83,000 | $86 | 46 |
Match score weights: distance 35% · size 25% · config 20% · recency 20%. Top-matched comps best support the ARV.
Projected returns pro-forma
0.62% appreciation · 3.0% rent growth · sell at horizon
- IRR
- -0.1%
- Equity multiple
- 1.00×
- Total profit
- $-216
- Equity at exit
- $53,053
- IRR
- 5.0%
- Equity multiple
- 1.58×
- Total profit
- $26,623
- Equity at exit
- $68,036
Cash invested: $46,200 (down + closing). Projections, not guarantees.
Landlord ↔ Tenant lean methodology
- Overall (STATE)
- 90 Strongly Landlord-Friendly
- State Indiana
- 90 Strongly Landlord-Friendly · R+11
- County
- — inherits STATE
- City
- — inherits STATE
ZIP-level market 47446
- Home prices YoY
- 0.2%
- Active inventory
- 61
- Price-to-rent
- 10.7×
Monthly cashflow live
- Estimated rent
- $1,283 medium interval (Pro) →
- Mortgage (P&I)
- −$865
- Tax from tax record
- −$82 /mo · $987/yr
- Insurance
- −$69
- HOA
- −$0
- Vacancy / Maint / Mgmt
- −$269
- Net cashflow
- $-3
Break-even live
UW: 25.0% down · 7.5% · 30yr · 1.5% tax · 5.0% vac · 8.0% maint · 8.0% mgmt
Financing live
Cash to close
- Down payment
- $41,250
- Closing costs
- $4,950
- Reserves months
- —
- Total cash needed
- —
Loan-product check · same deal, 3 products live
Conventional
25% down · 7.5% · 30yr
- Down + closing
- —
- Monthly P&I
- —
- Monthly cashflow
- —
- DSCR
- —
- Eligible?
- —
Personal DTI + credit; lowest rate.
DSCR
20% down · 8.5% · 30yr
- Down + closing
- —
- Monthly P&I
- —
- Monthly cashflow
- —
- DSCR
- —
- Eligible?
- —
No personal income docs; deal must DSCR.
Hard money
10% down · 12.0% · 12mo
- Down + closing
- —
- Monthly P&I
- —
- Monthly cashflow
- —
- DSCR
- —
- Eligible?
- —
Short-term bridge; refi at stabilization.
Listing history 27 events
-
2026-06-19days on market $165,000 Active 52 DOM
-
2026-06-18days on market $165,000 Active 51 DOM
-
2026-06-17days on market $165,000 Active 50 DOM
-
2026-06-16days on market $165,000 Active 49 DOM
-
2026-06-15days on market $165,000 Active 48 DOM
-
2026-06-14days on market $165,000 Active 46 DOM
-
2026-06-12days on market $165,000 Active 45 DOM
-
2026-06-09days on market $165,000 Active 42 DOM
-
2026-06-08days on market $165,000 Active 41 DOM
-
2026-06-07days on market $165,000 Active 40 DOM
-
2026-06-05days on market $165,000 Active 38 DOM
-
2026-06-03days on market $165,000 Active 36 DOM
-
2026-06-02days on market $165,000 Active 35 DOM
-
2026-06-01days on market $165,000 Active 34 DOM
-
2026-05-31days on market $165,000 Active 33 DOM
-
2026-05-30days on market $165,000 Active 32 DOM
-
2026-04-28$165,000 Active 968-char remark
-
2022-04-12soldstatus $59,200
-
2020-01-13soldstatus $65,000
Show marketing remark (27 chars)
This is a one time showing.
-
2020-01-11$65,000
Show marketing remark (27 chars)
This is a one time showing.
-
2020-01-09soldstatus $52,000
-
2019-10-07$59,900
-
2016-03-15soldstatus $84,900
-
2015-05-19$79,900
-
2014-12-26soldstatus $25,000
-
2013-08-15$55,900
-
2013-08-06$45,000
ⓘ Source: listings_history table (triggers on properties + properties_extension) + one-shot
backfill from property_details.listing_events for pre-trigger history.
Tax reassessment forecast IN · Partial reset (capped growth)
- Current annual tax
- $987 · $82/mo
- Projected year-2 tax
- $1,195 · $100/mo
- Expected delta
- +$208/yr (+$17/mo · 21.1%)
ⓘ Screening estimate from a state-policy table — verify with the county assessor before closing.
Climate risk First Street
- Flood 1/10 Low FEMA zone X (unshaded) · 0% chance over 30 yrs
- Wildfire 2/10 Low
- Heat 5/10 Major 7 d/yr ≥104°F today · 20 d/yr by 30 yrs out
- Wind 2/10 Low 100% chance of damaging wind over 30 yrs
- Air quality 2/10 Low 1 unhealthy d/yr today · 2 by 30 yrs out
Nearby sold comps map
Loading sold comps map…
Walkable amenities ~0.75 mi
Loading nearby amenities…
Taxation est. · year 1
- Rental income
- $15,397
- − Mortgage interest
- −$9,243
- − Property taxes
- −$987
- − Insurance
- −$825
- − Repairs & maintenance
- −$1,232
- − Management
- −$1,232
- − Depreciation
- −$4,800
- Taxable loss
- −$2,921
- Est. tax savings @ 24.0%
- +$701
- After-tax cash flow
- $670/yr
For passive investors: Depreciation is non-cash, so a rental often shows a tax loss while cash-flowing — sheltering income. Rental losses are passive: they offset passive income freely, and up to $25,000/yr can offset ordinary (W-2) income if you actively participate and your MAGI is under $100k (phasing out to $0 by $150k); unused losses carry forward. On sale, claimed depreciation is recaptured at up to 25%, and gains may owe capital-gains tax (a 1031 exchange can defer both). Figures are a year-1 estimate at your 24.0% rate — not tax advice; consult a CPA.
Schools (NCES district)
- District
- Mitchell Community Schools
- NCES district ID
- 1806900
- Math proficiency
- 26% ▼ -16.00%
- Reading proficiency
- 37% ▼ -10.00%
- Median HH income
- $43,994
- Composite
- 26.83/100
- National rank
- #7113
- State rank
- #230 of 301 in IN
Livability — Mitchell
- Score
- 69/100
- State rank
- #187
- US rank
- #8606
Category grades
Schools grade is shown separately in the Schools card above.
Census & demographics
- Census place
- Mitchell, IN
- Population (ZIP)
- 9,259
Population outlook (Lawrence County) Hauer SSP2
- Today (2025)
- 44,347 people
- By 2030
- 43,331 · -2.3%
- By 2040
- 40,887 · -7.8%
- By 2050
- 38,297 · -13.6%
- By 2075
- 32,479 · -26.8%
- By 2100
- 26,051 · -41.3%
Race, ethnicity, and origin ACS 2023
- Neighborhood character
- Predominantly White (93%)
- Race & ethnicity
- White 93% Two or more races 4% Asian 2% Hispanic / Latino 1%
- Common ancestry
- Italian 3% Slovak 2% Serbian 1%
- Foreign-born
- 3% · Canada
- Languages at home
- 96% English-only · Other Indo-European 2% Spanish 1%
Political lean MEDSL · Lawrence
- 2024 margin
- Solid R (+51.0) · D 23.6% · R 74.6% · Other 1.7%
- 2008→2024 swing
- -30.5pp toward R · 2008: -20.6pp · 2024: -51.0pp
- All cycles
- 2024: R+51.0 2020: R+50.6 2016: R+51.5 2012: R+32.8 2008: R+20.6
Not yet ingested
- Civics
- —
Market trends
- HPI YoY
- ▲ 0.62%
- Current HPI
- 248.9604
- Rent YoY
- —
- Metro
- —
- State GDP YoY
- ▲ 2.90%
- F500 in state
- 18
Industry mix (Fortune 500 HQ in IN)
| Industry | F500 HQs | Revenue |
|---|---|---|
| Industrial Machinery | 2 | $37B |
|
||
| Healthcare | 1 | $177B |
|
||
| Pharmaceuticals | 1 | $45B |
|
||
| Metals / Steel | 1 | $18B |
|
||
| Agriculture | 1 | $17B |
|
||
| Packaging | 1 | $12B |
|
||
Price history
+266.7% since first listed11 events — show timeline
- 2026-04-28 Listed $165,000 IRMLS
- 2022-04-12 Sold (Public Records) $59,200 Public Records
- 2020-01-13 Sold (MLS) $65,000 IRMLS
- 2020-01-11 Listed $65,000 IRMLS
- 2020-01-09 Sold (MLS) $52,000 IRMLS
- 2019-10-07 Listed $59,900 IRMLS
- 2016-03-15 Sold (Public Records) $84,900 Public Records
- 2015-05-19 Listed $79,900 IRMLS
- 2014-12-26 Sold (MLS) $25,000 IRMLS
- 2013-08-15 Listed $55,900 IRMLS
- 2013-08-06 Listed $45,000 IRMLS
Property tax history
+7.7%/yrLatest (2025): $987 · +2.5% YoY. Source: county tax records.
Cash-flow waterfall
monthlySold comps — $/sqft
last 12 mo · ≤1 miLoading sold comps…