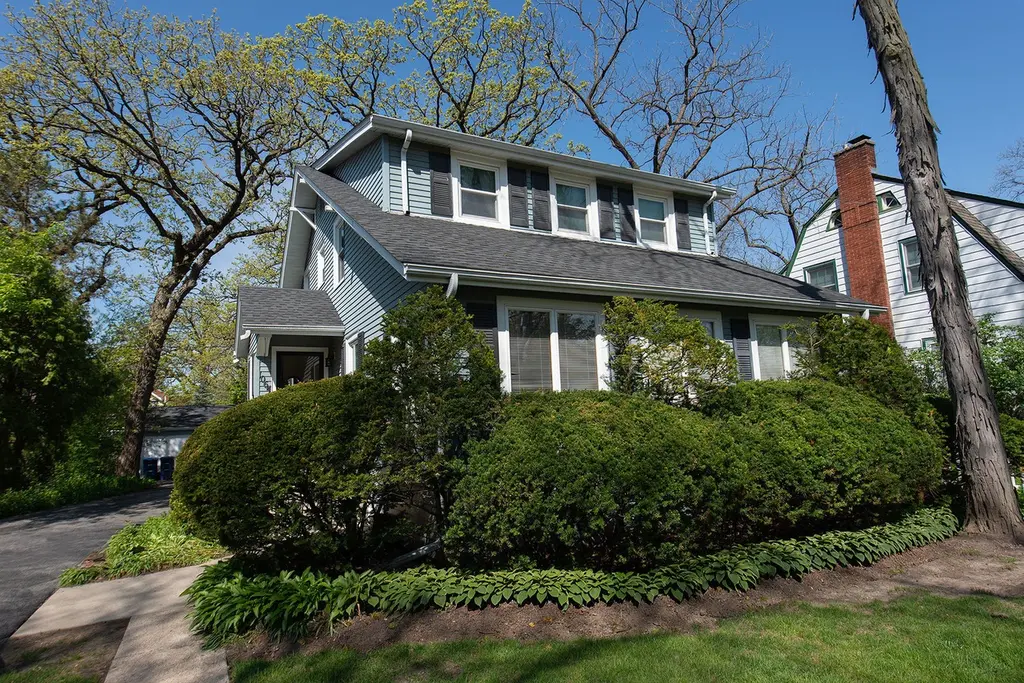
1064 Springfield Ave · Deerfield, IL
Flood risk 1/10 · Minimal
- FEMA flood zone
- X (unshaded)
- Chance of flooding over 30 yrs
- 0.0%
- Est. flood insurance / yr
- $507 – $1,088
Fire risk 1/10 · Minimal
- Est. fire insurance / yr
- $804 – $1,492
Heat risk 2/10 · Minimal
- Hot days now (above 98°F)
- 7 days/yr
- Hot days in 30 yrs
- 14 days/yr
Wind risk 2/10 · Minimal
- Chance of severe wind over 30 yrs
- 0.0%
Air-quality risk 4/10 · Minor
- Unhealthy air days now
- 4 days/yr
- Unhealthy air days in 30 yrs
- 5 days/yr
Risk factors via First Street. Map © Google.
Why this score? — see what drove the D grade
The composite is a weighted blend of 9 inputs, each scored 0–100. Each bar is that input's sub-score; the figure is the points it added to the 100-point composite (weight × sub-score).
- Cash flow +14.3/30.0
- ARV discount +6.7/15.0
- Schools +5.9/10.0
- DSCR +4.4/10.0
- Livability +4.2/5.0
- 1% rule +3.4/10.0
- Rent growth +2.5/5.0
- Condition / age +2.5/5.0
- Appreciation +0.0/10.0
$465,000
🖨 Deal sheet 📄 Offer letter ✓ Due diligence
Listing remarks
Charming and full of potential, this ideally located Deerfield home offers an incredible opportunity just steps from everything downtown has to offer. Situated next to beautiful Jewett Park and less than two blocks from the vibrant downtown Deerfield shopping and dining district, as well as the Metra station, the location truly speaks for itself. The home features a functional and inviting layout with timeless character throughout. The main level includes a spacious family room with fireplace, formal dining room, kitchen, bright four seasons room, and a convenient powder room. Upstairs offers three bedrooms, one full bathroom, and an additional flexible room ideal for a nursery, home office
Key facts
- Flexible room
- Four seasons room
- Two-car garage
Tags
Property features AI
Finance
- Other: Living area based on plans; Total finished area reported as 1,819; Main level and upper level finished area reported (main ~1053, upper ~766); Property not currently leased; Built before 1978
- HOA & community: No master association fee required; Community features include curbs, sidewalks, and paved streets
Exterior
- Parking: Detached garage (owned) with 2 garage spaces; Asphalt driveway; 2 total parking spaces
- Utilities: Water: Lake Michigan / public; Sewer: public sewer; Electric service
- Home design: Detached single-family home; 1.5-story; Fee simple ownership; Built over 100 years ago; Asphalt roof; Vinyl siding
- Construction: Vinyl siding construction; Asphalt roof; Full unfinished basement
- Exterior features: Patio; School bus service; Lot approximately 50 x 150; less than 0.25 acre; Lot features: none
Interior
- Kitchen: Range; Dishwasher; Refrigerator; Range hood; Eating area / table space
- Bedrooms: 3 bedrooms (master bedroom on second level; additional bedrooms on second level)
- Flooring: Hardwood
- Bathrooms: 1 full bath; 1 half bath
- Heating & cooling: Natural gas and electric heating; Central air conditioning
- Interior features: Built-in features; Ceiling fan(s); One fireplace in the living room; 7 total rooms
- Laundry & utility: Washer; Dryer; Laundry room
Neighborhood map
What this means for you Summary
Snapshot
- This is a 3-bed/1.0-bath single-family listed at $465k.
Deal economics
- At list price, monthly cash flow is $89 ($1k/yr) — positive.
- The deal already cash-flows at list — no discount required.
- To meet the 1% rule (rent ≥ 1% of price), the offer needs to be $389k (16.3% below list).
- Recommended offer: $389k (16.3% below list) — sets the bar for 1% rule.
- Cap rate 6.5% vs local median 3.8% in Deerfield — top-decile yield for the area; either an underpriced asset or a hidden risk that comps aren't pricing in. Stress-test before assuming the spread holds.
Location & tenants
- Location reads 84/100 on livability (#35 in IL, #705 nationally) — a professional / high-income tenant draw. Strengths: crime A+, commute A+, employment A+; Watch: amenities C-, health & safety C-, cost of living F.
- Twp Hsd 113 (suburban): math 60% / reading 63% proficiency, ranked #19 of 620 in IL (top 3%) — acceptable for families but not a draw, mixed tenant base, ~2y average lease.
- Zoned schools: Deerfield High School (math 67% / reading 69%, grade B, #9 of 693 statewide, top 1%, 1,483 students, 0% FRL).
- Market conditions: 117 active listings in the ZIP; 18 comparable units currently listed for rent nearby; rentals at typical pace (median 22d on market — plan ~3-4 weeks tenant-placement turnaround); high-income renter base; 948 units permitted in Lake County in 2024 (424 in 5+ unit buildings).
Forward outlook
- Local home prices are declining (-3.0%/yr); year-one equity from $3k of loan paydown is wiped out by about $14k of value loss. Plan a longer hold.
- Lake County population projected to shrink 8% by 2050 — rents likely to lag national; underwrite the cash flow, not the appreciation.
Negotiation context
- Only 6 days on market — expect competitive offers; lowballing is unlikely to land.
Risks & watch-outs
- Watch-outs: built in 1925 — expect roof / HVAC / electrical / plumbing capex.
Questions for the listing agent
- Built in 1925 — when were the roof, HVAC, electrical panel, plumbing, and water heater last replaced?
- Is there a deadline driving the sale (1031 exchange, divorce, estate, relocation)? That informs how much negotiation room exists.
- Schools are A-rated — typically a magnet for longer-tenancy family renters. What's the average tenant stay here, and is there a school-zone premium baked into asking?
- The area grade is low — what's the realistic commute time and amenity access for the typical tenant pool here? Any planned neighborhood developments (good or bad) we should know about?
- What's the average days-on-market for RENTAL listings here right now (not sales)? A rising rental-DOM trend means longer vacancies and softer asking-rent achievability than the comps imply.
- What's the recent tenant-quality profile in this submarket — average credit score on applications, eviction rate, late-payment / NSF rate, and stable-employment percentage? A property-management company in the area should have these aggregated.
- How much new for-sale + rental construction is in the pipeline within 1–3 miles? Heavy new supply typically softens prices + rents 12–24 months out; constrained supply supports both.
Investment metrics
- 1% rule
- 0.84% ✗
- Cap rate
- 6.52%
- Cash-on-cash
- 0.82%
- DSCR
- 1.04
- GRM
- 10.0
CMA / ARV
- ARV (on-the-fly)
- $457,170
- Comps found
- 12
Show comp detail 12 sales within ~0.75 mi
| Address | Dist | Beds/Ba | Sqft | Sold | Price | $/sf | Match |
|---|---|---|---|---|---|---|---|
| 1030 Chestnut St | 0.11mi | 3/1.5 | 1,500 (+2%) | 1mo | $430,000 | $287 | 88 |
| 1029 Elmwood Ave | 0.32mi | 3/2.0 | 1,465 (-0%) | 0mo | $497,500 | $340 | 80 |
| 1052 Greenwood Ave | 0.28mi | 3/1.0 | 1,500 (+2%) | 5mo | $377,000 | $251 | 79 |
| 1032 Sheridan Ave | 0.23mi | 4/2.0 (+1) | 1,611 (+10%) | 1mo | $425,000 | $264 | 63 |
| 505 Margate Ter | 0.52mi | 3/1.5 | 1,540 (+5%) | 7mo | $470,000 | $305 | 60 |
| 1343 Oxford Rd | 0.70mi | 3/1.5 | 1,504 (+2%) | 4mo | $467,000 | $311 | 58 |
| 555 Longfellow Ave | 0.66mi | 3/2.0 | 1,415 (-4%) | 2mo | $525,000 | $371 | 58 |
| 1314 Somerset Ave | 0.53mi | 3/1.5 | 1,386 (-6%) | 9mo | $416,150 | $300 | 56 |
| 1033 Kenton Rd | 0.55mi | 4/1.5 (+1) | 1,561 (+6%) | 1mo | $570,000 | $365 | 56 |
| 1337 Knollwood Rd | 0.59mi | 3/2.0 | 1,382 (-6%) | 8mo | $550,000 | $398 | 52 |
| 630 Hermitage Dr | 0.68mi | 4/2.0 (+1) | 1,617 (+10%) | 4mo | $535,000 | $331 | 39 |
| 956 Brookside Ln | 0.68mi | 3/2.0 | 1,668 (+14%) | 8mo | $515,000 | $309 | 36 |
Match score weights: distance 35% · size 25% · config 20% · recency 20%. Top-matched comps best support the ARV.
Projected returns pro-forma
-3.0% appreciation · 3.0% rent growth · sell at horizon
- IRR
- -15.0%
- Equity multiple
- 0.46×
- Total profit
- $-69,792
- Equity at exit
- $69,333
- IRR
- -6.5%
- Equity multiple
- 0.59×
- Total profit
- $-53,840
- Equity at exit
- $40,205
Cash invested: $130,200 (down + closing). Projections, not guarantees.
Landlord ↔ Tenant lean methodology
- Overall (STATE)
- 43 Moderately Tenant-Leaning
- State Illinois
- 43 Moderately Tenant-Leaning · D+7
- County
- — inherits STATE
- City
- — inherits STATE
ZIP-level market 60015
- Active inventory
- 117
- Price-to-rent
- 10.0×
Monthly cashflow live
- Estimated rent
- $3,893 high interval (Pro) →
- Mortgage (P&I)
- −$2,439
- Tax from tax record
- −$355 /mo · $4,259/yr
- Insurance
- −$194
- HOA
- −$0
- Vacancy / Maint / Mgmt
- −$818
- Net cashflow
- $89
Break-even live
UW: 25.0% down · 7.5% · 30yr · 1.5% tax · 5.0% vac · 8.0% maint · 8.0% mgmt
Financing live
Cash to close
- Down payment
- $116,250
- Closing costs
- $13,950
- Reserves months
- —
- Total cash needed
- —
Loan-product check · same deal, 3 products live
Conventional
25% down · 7.5% · 30yr
- Down + closing
- —
- Monthly P&I
- —
- Monthly cashflow
- —
- DSCR
- —
- Eligible?
- —
Personal DTI + credit; lowest rate.
DSCR
20% down · 8.5% · 30yr
- Down + closing
- —
- Monthly P&I
- —
- Monthly cashflow
- —
- DSCR
- —
- Eligible?
- —
No personal income docs; deal must DSCR.
Hard money
10% down · 12.0% · 12mo
- Down + closing
- —
- Monthly P&I
- —
- Monthly cashflow
- —
- DSCR
- —
- Eligible?
- —
Short-term bridge; refi at stabilization.
Rent comps 18 comps
| Address | Beds | Baths | Sqft | Rent | $/sqft | DOM | Units | Dist |
|---|---|---|---|---|---|---|---|---|
| 1141 Waukegan Rd Unit 2 Bedroom Deerfield, IL | 2.0 | 1.0 | 875 | $1,625 | $1.86 | 20d | 1 | 0.13mi |
| 1150 Blackthorn Ln Deerfield, IL | 3.0 | 2.5 | 1566 | $4,500 | $2.87 | 24d | 1 | 0.35mi |
| 1344 Barclay Ln Unit 1344 Deerfield, IL | 2.0 | 1.5 | 1232 | $2,450 | $1.99 | 20d | 1 | 0.36mi |
| 1430 Waukegan Rd Deerfield, IL | 3.0 | 3.0 | 1562 | $3,800 | $2.43 | 24d | 1 | 0.42mi |
| 740 Chestnut St Unit 2 Deerfield, IL | 2.0 | 2.0 | 1100 | $2,990 | $2.72 | 24d | 1 | 0.43mi |
| 625 Deerfield Rd Deerfield, IL | 1.0–2.0 | 1.0–2.0 | 1057 | $3,580 | $3.39 | 5d | 11 | 0.53mi |
| 728 Waukegan Rd Deerfield, IL | 2.0 | 2.0 | 1117 | $4,495 | $4.02 | 21d | 1 | 0.55mi |
| 728 Waukegan Rd Unit 206 Deerfield, IL | 2.0 | 2.0 | 1117 | $4,700 | $4.21 | 24d | 1 | 0.55mi |
| 728 Waukegan Rd Unit 206 Deerfield, IL | 2.0 | 2.0 | 1117 | $4,495 | $4.02 | 24d | 1 | 0.55mi |
| 728 Waukegan Rd Unit 209 Deerfield, IL | 3.0 | 2.5 | 1767 | $5,950 | $3.37 | 16d | 1 | 0.55mi |
| 728 Waukegan Rd Unit 203 Deerfield, IL | 2.0 | 2.0 | 1117 | $4,295 | $3.85 | 21d | 1 | 0.55mi |
| 728 Waukegan Rd Unit 209 Deerfield, IL | 3.0 | 2.5 | 1767 | $5,950 | $3.37 | 21d | 1 | 0.55mi |
| 728 Waukegan Rd Unit 203 Deerfield, IL | 2.0 | 2.0 | 1117 | $4,295 | $3.85 | 16d | 1 | 0.55mi |
| 728 Waukegan Rd Deerfield, IL | 3.0 | 2.0 | 1767 | $7,000 | $3.96 | 24d | 1 | 0.55mi |
| 621 Waukegan Rd Deerfield, IL | 2.0 | 1.0 | 1200 | $2,350 | $1.96 | 12d | 1 | 0.69mi |
| 630 Thayer St Deerfield, IL | 1.0–3.0 | 1.5–2.5 | 1791 | $7,500 | $4.19 | 1d | 15 | 1.30mi |
| 631 Thayer St Deerfield, IL | 1.0–3.0 | 1.5–2.5 | 1791 | $7,900 | $4.41 | 1d | 1 | 1.30mi |
| 15 Parkway North Blvd Deerfield, IL | 1.0–2.0 | 1.0–2.0 | 994 | $3,348 | $3.37 | 1d | 33 | 1.45mi |
Listing history 1 events
-
2026-05-21$465,000 Active
ⓘ Source: listings_history table (triggers on properties + properties_extension) + one-shot
backfill from property_details.listing_events for pre-trigger history.
Tax reassessment forecast IL · Partial reset (capped growth)
- Current annual tax
- $4,259 · $355/mo
- Projected year-2 tax
- $7,407 · $617/mo
- Expected delta
- +$3,148/yr (+$262/mo · 73.9%)
ⓘ Screening estimate from a state-policy table — verify with the county assessor before closing.
Climate risk First Street
- Flood 1/10 Low FEMA zone X (unshaded) · 0% chance over 30 yrs
- Wildfire 1/10 Low
- Heat 2/10 Low 7 d/yr ≥98°F today · 14 d/yr by 30 yrs out
- Wind 2/10 Low 0% chance of damaging wind over 30 yrs
- Air quality 4/10 Moderate 4 unhealthy d/yr today · 5 by 30 yrs out
Nearby sold comps map
Loading sold comps map…
Walkable amenities ~0.75 mi
Loading nearby amenities…
Taxation est. · year 1
- Rental income
- $46,720
- − Mortgage interest
- −$26,047
- − Property taxes
- −$4,259
- − Insurance
- −$2,325
- − Repairs & maintenance
- −$3,738
- − Management
- −$3,738
- − Depreciation
- −$13,527
- Taxable loss
- −$6,914
- Est. tax savings @ 24.0%
- +$1,659
- After-tax cash flow
- $2,722/yr
For passive investors: Depreciation is non-cash, so a rental often shows a tax loss while cash-flowing — sheltering income. Rental losses are passive: they offset passive income freely, and up to $25,000/yr can offset ordinary (W-2) income if you actively participate and your MAGI is under $100k (phasing out to $0 by $150k); unused losses carry forward. On sale, claimed depreciation is recaptured at up to 25%, and gains may owe capital-gains tax (a 1031 exchange can defer both). Figures are a year-1 estimate at your 24.0% rate — not tax advice; consult a CPA.
Schools (NCES district)
- District
- Twp Hsd 113
- NCES district ID
- 1719080
- Math proficiency
- 60% ▼ -6.00%
- Reading proficiency
- 63% ▼ -5.00%
- Median HH income
- $122,404
- Composite
- 59.23/100
- National rank
- #937
- State rank
- #19 of 620 in IL
Livability — Deerfield
- Score
- 84/100
- State rank
- #35
- US rank
- #705
Category grades
Schools grade is shown separately in the Schools card above.
Census & demographics
- Census place
- Deerfield, IL
- County
- Lake County · 591,991 people
- City population
- 28,096
- Metro
- Chicago-Naperville-Elgin, IL-IN-WI
- Population (ZIP)
- 28,096
- Household income
- $183,125
- Rent vs Own
- Severe rent burden
- 450.0
Population outlook (Lake County) Hauer SSP2
- Today (2025)
- 700,217 people
- By 2030
- 693,290 · -1.0%
- By 2040
- 673,588 · -3.8%
- By 2050
- 643,556 · -8.1%
- By 2075
- 562,792 · -19.6%
- By 2100
- 457,715 · -34.6%
Race, ethnicity, and origin ACS 2023
- Neighborhood character
- Predominantly White (84%)
- Race & ethnicity
- White 84% Asian 8% Hispanic / Latino 5% Two or more races 3% Black 1%
- Common ancestry
- Romanian 11% Scotch-Irish 10% Italian 4%
- Foreign-born
- 14% · China, South Korea, Canada
- Languages at home
- 82% English-only · Russian/Polish/Slavic 6% Other Indo-European 3% Spanish 3%
Political lean MEDSL · Lake
- 2024 margin
- Strong D (+20.8) · D 59.7% · R 38.9% · Other 1.4%
- 2008→2024 swing
- +1.1pp toward D · 2008: 19.6pp · 2024: 20.8pp
- All cycles
- 2024: D+20.8 2020: D+24.1 2016: D+20.3 2012: D+8.1 2008: D+19.6
Not yet ingested
- Civics
- —
Market trends
- HPI YoY
- ▼ -318.91%
- Current HPI
- 184.8993
- Rent YoY
- —
- Metro
- Chicago-Naperville-Elgin, IL-IN-WI
- State GDP YoY
- ▲ 1.59%
- F500 in state
- 60
Industry mix (Fortune 500 HQ in IL)
| Industry | F500 HQs | Revenue |
|---|---|---|
| Insurance | 4 | $201B |
|
||
| Consumer Goods | 4 | $87B |
|
||
| Industrial Machinery | 3 | $64B |
|
||
| Healthcare | 2 | $55B |
|
||
| Retail / Pharmacy | 1 | $148B |
|
||
| Agriculture / Food | 1 | $86B |
|
||
Price history
1 event — show timeline
- 2026-05-21 Listed $465,000 MRED as Distributed by MLS Grid
Property tax history
+1.7%/yrLatest (2024): $4,259 · -2.0% YoY. Source: county tax records.
Cash-flow waterfall
monthlySold comps — $/sqft
last 12 mo · ≤1 miLoading sold comps…