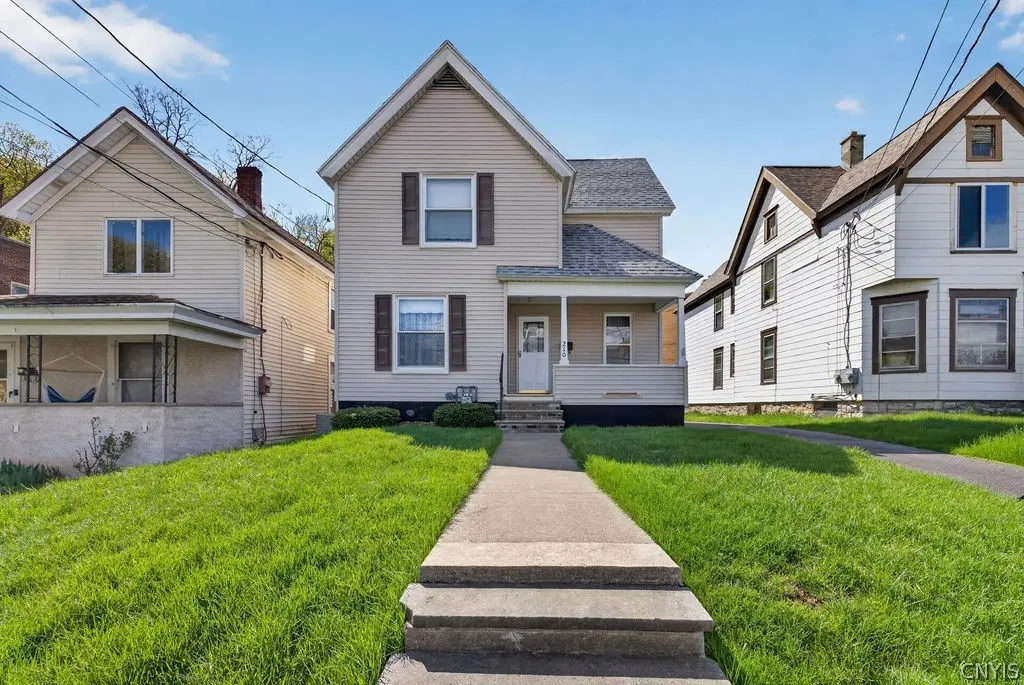
210 Freeman Ave · Solvay, NY
Flood risk 5/10 · Moderate
- FEMA flood zone
- X (unshaded)
- Chance of flooding over 30 yrs
- 0.47%
- Est. flood insurance / yr
- $473 – $860
Fire risk 1/10 · Minimal
- Est. fire insurance / yr
- $691 – $1,283
Heat risk 3/10 · Minor
- Hot days now (above 95°F)
- 7 days/yr
- Hot days in 30 yrs
- 16 days/yr
Wind risk 1/10 · Minimal
- Chance of severe wind over 30 yrs
- 0.0%
Air-quality risk 2/10 · Minimal
- Unhealthy air days now
- 0 days/yr
- Unhealthy air days in 30 yrs
- 1 days/yr
Risk factors via First Street. Map © Google.
Why this score? — see what drove the D grade
The composite is a weighted blend of 9 inputs, each scored 0–100. Each bar is that input's sub-score; the figure is the points it added to the 100-point composite (weight × sub-score).
- Cash flow +13.8/30.0
- ARV discount +7.4/15.0
- 1% rule +5.3/10.0
- DSCR +4.2/10.0
- Livability +3.6/5.0
- Schools +3.1/10.0
- Rent growth +2.5/5.0
- Condition / age +2.5/5.0
- Appreciation +0.0/10.0
$169,900
🖨 Deal sheet 📄 Offer letter ✓ Due diligence
Listing remarks
Showings start on Friday 4/24 at 2pm Welcome to a rare piece of local history in the heart of the Village of Solvay. This four-bedroom, one-and-a-half-bath Colonial has been cherished by the same family for over 90 years, radiating a sense of pride of ownership from the moment you step inside. The interior is a showcase of timeless craftsmanship, featuring gleaming hardwood floors and exquisite natural woodwork that preserve the home’s original character. While the vintage charm is undeniable, the property has been thoughtfully maintained with key mechanical updates, including a newer roof, replacement windows, a high-efficiency furnace, and a newer hot water tank for peace of mind.
Key facts
- Natural woodwork
- Newer roof
- Newer hot water tank
Tags
Neighborhood map
What this means for you Summary
Snapshot
- This is a 3-bed/1.5-bath single-family listed at $170k.
Deal economics
- At list price, monthly cash flow is $14 ($174/yr) — positive.
- The deal already cash-flows at list — no discount required.
- Meets the 1% rule at list price ($2k rent vs $170k).
- Recommended offer: $167k (1.5% below list) — sets the bar for market timing.
Location & tenants
- Location reads 72/100 on livability (#350 in NY) — a middle-class / working-renter tenant base. Strengths: housing A+, health & safety A+, cost of living A; Watch: employment D+, crime D, amenities F.
- Solvay Union Free School District (suburban): math 31% / reading 42% proficiency, ranked #550 of 590 in NY (top 93%) — families likely to look elsewhere, expect single-tenant / working-renter base with shorter leases.
- Market conditions: 59 active listings in the ZIP; 6 comparable units currently listed for rent nearby; rentals leasing fast (median 13d on market — plan ~1-2 weeks tenant-placement turnaround); 616 units permitted in Onondaga County in 2024 (256 in 5+ unit buildings).
- This rent runs 31% of the median local income ($68k/yr) — at the standard rent-burdened threshold; future hikes will face affordability resistance.
Forward outlook
- Local home prices are declining (-3.0%/yr); year-one equity from $1k of loan paydown is wiped out by about $5k of value loss. Plan a longer hold.
- Onondaga County population projected to shrink 9% by 2050 — rents likely to lag national; underwrite the cash flow, not the appreciation.
Negotiation context
- It's been on market 27 days — a 2% lower offer ($167k) is reasonable based on typical stale-listing flexibility.
Risks & watch-outs
- Watch-outs: property tax is 2.8% of price; built in 1905 — expect roof / HVAC / electrical / plumbing capex.
- Climate carrying-cost: moderate flood risk — expect insurance premiums to compound above CPI over the hold.
Questions for the listing agent
- Built in 1905 — when were the roof, HVAC, electrical panel, plumbing, and water heater last replaced?
- Property tax is high relative to price — has the assessment been appealed recently, and will the sale trigger a re-assessment?
- Is there a deadline driving the sale (1031 exchange, divorce, estate, relocation)? That informs how much negotiation room exists.
- Schools are B-rated — typically a magnet for longer-tenancy family renters. What's the average tenant stay here, and is there a school-zone premium baked into asking?
- Crime grade is D in this area — have there been break-ins, vandalism, or insurance claims at this property in the last 3 years? What carrier currently insures it and at what premium?
- The area grade is low — what's the realistic commute time and amenity access for the typical tenant pool here? Any planned neighborhood developments (good or bad) we should know about?
- What's the average days-on-market for RENTAL listings here right now (not sales)? A rising rental-DOM trend means longer vacancies and softer asking-rent achievability than the comps imply.
- What's the recent tenant-quality profile in this submarket — average credit score on applications, eviction rate, late-payment / NSF rate, and stable-employment percentage? A property-management company in the area should have these aggregated.
- How much new for-sale + rental construction is in the pipeline within 1–3 miles? Heavy new supply typically softens prices + rents 12–24 months out; constrained supply supports both.
Investment metrics
- 1% rule
- 1.03% ✓
- Cap rate
- 6.40%
- Cash-on-cash
- 0.37%
- DSCR
- 1.02
- GRM
- 8.1
CMA / ARV
- ARV (on-the-fly)
- $169,508
- Comps found
- 12
Show comp detail 12 sales within ~0.75 mi
| Address | Dist | Beds/Ba | Sqft | Sold | Price | $/sf | Match |
|---|---|---|---|---|---|---|---|
| 326 Essex St | 0.26mi | 3/1.5 | 1,360 (-0%) | 8mo | $235,000 | $173 | 80 |
| 503 Woods Rd | 0.13mi | 3/2.0 | 1,456 (+6%) | 9mo | $155,000 | $106 | 73 |
| 116 Gere Ave | 0.30mi | 3/1.0 | 1,300 (-5%) | 8mo | $90,000 | $69 | 69 |
| 107 Huntshill Rd | 0.20mi | 3/2.0 | 1,496 (+9%) | 8mo | $299,000 | $200 | 67 |
| 811 Avery Ave | 0.49mi | 4/2.0 (+1) | 1,344 (-2%) | 2mo | $155,000 | $115 | 66 |
| 216 Essex St | 0.36mi | 3/2.0 | 1,297 (-5%) | 9mo | $186,830 | $144 | 66 |
| 1011 Milton Ave | 0.48mi | 3/1.5 | 1,477 (+8%) | 9mo | $73,000 | $49 | 57 |
| 407 Chemung St | 0.24mi | 2/1.0 (-1) | 1,164 (-15%) | 3mo | $130,500 | $112 | 55 |
| 1907 W Genesee St | 0.70mi | 4/1.0 (+1) | 1,328 (-3%) | 4mo | $118,000 | $89 | 52 |
| 122 Century Dr | 0.74mi | 4/2.5 (+1) | 1,404 (+3%) | 3mo | $285,000 | $203 | 49 |
| 308 Lewis St | 0.54mi | 3/1.0 | 1,174 (-14%) | 5mo | $145,500 | $124 | 45 |
| 413 Herkimer St | 0.57mi | 4/2.5 (+1) | 1,566 (+15%) | 1mo | $260,000 | $166 | 39 |
Match score weights: distance 35% · size 25% · config 20% · recency 20%. Top-matched comps best support the ARV.
Projected returns pro-forma
-3.0% appreciation · 3.0% rent growth · sell at horizon
- IRR
- -15.6%
- Equity multiple
- 0.44×
- Total profit
- $-26,466
- Equity at exit
- $25,333
- IRR
- -7.0%
- Equity multiple
- 0.55×
- Total profit
- $-21,278
- Equity at exit
- $14,690
Cash invested: $47,572 (down + closing). Projections, not guarantees.
Landlord ↔ Tenant lean methodology
- Overall (STATE)
- 15 Strongly Tenant-Friendly
- State New York
- 15 Strongly Tenant-Friendly · D+10
- County
- — inherits STATE
- City
- — inherits STATE
ZIP-level market 13209
- Home prices YoY
- -7.7%
- Active inventory
- 59
- Price-to-rent
- 8.1×
Monthly cashflow live
- Estimated rent
- $1,744 high interval (Pro) →
- Mortgage (P&I)
- −$891
- Tax from tax record
- −$401 /mo · $4,817/yr
- Insurance
- −$71
- HOA
- −$0
- Vacancy / Maint / Mgmt
- −$366
- Net cashflow
- $14
Break-even live
UW: 25.0% down · 7.5% · 30yr · 1.5% tax · 5.0% vac · 8.0% maint · 8.0% mgmt
Financing live
Cash to close
- Down payment
- $42,475
- Closing costs
- $5,097
- Reserves months
- —
- Total cash needed
- —
Loan-product check · same deal, 3 products live
Conventional
25% down · 7.5% · 30yr
- Down + closing
- —
- Monthly P&I
- —
- Monthly cashflow
- —
- DSCR
- —
- Eligible?
- —
Personal DTI + credit; lowest rate.
DSCR
20% down · 8.5% · 30yr
- Down + closing
- —
- Monthly P&I
- —
- Monthly cashflow
- —
- DSCR
- —
- Eligible?
- —
No personal income docs; deal must DSCR.
Hard money
10% down · 12.0% · 12mo
- Down + closing
- —
- Monthly P&I
- —
- Monthly cashflow
- —
- DSCR
- —
- Eligible?
- —
Short-term bridge; refi at stabilization.
Rent comps 6 comps
| Address | Beds | Baths | Sqft | Rent | $/sqft | DOM | Units | Dist |
|---|---|---|---|---|---|---|---|---|
| 410 Chemung St Unit 1 Syracuse, NY | 3.0 | 1.0 | 1100 | $1,500 | $1.36 | 13d | 1 | 0.21mi |
| 306 Hall Ave Unit Left Side Solvay, NY | 3.0 | 1.5 | 1120 | $1,750 | $1.56 | 43d | 1 | 0.25mi |
| 121 W End Dr Syracuse, NY | 3.0 | 1.5 | 1082 | $1,500 | $1.39 | 13d | 1 | 0.28mi |
| 202 Cayuga St Unit 1 Syracuse, NY | 3.0 | 1.0 | 1036 | $1,750 | $1.69 | 13d | 1 | 0.81mi |
| 349 Bryant Ave Syracuse, NY | 3.0 | 1.5 | 1500 | $2,300 | $1.53 | 13d | 1 | 1.25mi |
| 121 Whittier Ave Syracuse, NY | 4.0 | 1.0 | 1400 | $600 | $0.43 | 43d | 1 | 1.43mi |
Listing history 3 events
-
2026-05-19status Pending
-
2026-04-27historical Active Under Contract
-
2026-04-22$169,900 Active
ⓘ Source: listings_history table (triggers on properties + properties_extension) + one-shot
backfill from property_details.listing_events for pre-trigger history.
Tax reassessment forecast NY · Partial reset (capped growth)
- Current annual tax
- $4,817 · $401/mo
- Projected year-2 tax
- $4,817 · $401/mo
- Expected delta
- $0/yr ($0/mo · 0.0%)
ⓘ Screening estimate from a state-policy table — verify with the county assessor before closing.
Climate risk First Street
- Flood 5/10 Major FEMA zone X (unshaded) · 47% chance over 30 yrs
- Wildfire 1/10 Low
- Heat 3/10 Moderate 7 d/yr ≥95°F today · 16 d/yr by 30 yrs out
- Wind 1/10 Low 0% chance of damaging wind over 30 yrs
- Air quality 2/10 Low 0 unhealthy d/yr today · 1 by 30 yrs out
Nearby sold comps map
Loading sold comps map…
Walkable amenities ~0.75 mi
Loading nearby amenities…
Taxation est. · year 1
- Rental income
- $20,927
- − Mortgage interest
- −$9,517
- − Property taxes
- −$4,817
- − Insurance
- −$850
- − Repairs & maintenance
- −$1,674
- − Management
- −$1,674
- − Depreciation
- −$4,943
- Taxable loss
- −$2,548
- Est. tax savings @ 24.0%
- +$611
- After-tax cash flow
- $785/yr
For passive investors: Depreciation is non-cash, so a rental often shows a tax loss while cash-flowing — sheltering income. Rental losses are passive: they offset passive income freely, and up to $25,000/yr can offset ordinary (W-2) income if you actively participate and your MAGI is under $100k (phasing out to $0 by $150k); unused losses carry forward. On sale, claimed depreciation is recaptured at up to 25%, and gains may owe capital-gains tax (a 1031 exchange can defer both). Figures are a year-1 estimate at your 24.0% rate — not tax advice; consult a CPA.
Schools (NCES district)
- District
- Solvay Union Free School District
- NCES district ID
- 3627150
- Math proficiency
- 31% ▼ -14.00%
- Reading proficiency
- 42% ▼ -4.00%
- Median HH income
- $47,163
- Composite
- 31.28/100
- National rank
- #6018
- State rank
- #550 of 590 in NY
Livability — Solvay
- Score
- 72/100
- State rank
- #350
- US rank
- #5913
Category grades
Schools grade is shown separately in the Schools card above.
Census & demographics
- Census place
- Solvay, NY
- County
- Onondaga County · 247,257 people
- Metro
- Syracuse, NY
- Population (ZIP)
- 12,714
- Household income
- $68,138
- Rent vs Own
- Severe rent burden
- 210.0
Population outlook (Onondaga County) Hauer SSP2
- Today (2025)
- 467,894 people
- By 2030
- 463,381 · -1.0%
- By 2040
- 447,697 · -4.3%
- By 2050
- 426,399 · -8.9%
- By 2075
- 373,661 · -20.1%
- By 2100
- 307,967 · -34.2%
Race, ethnicity, and origin ACS 2023
- Neighborhood character
- Predominantly White (86%)
- Race & ethnicity
- White 86% Two or more races 6% Hispanic / Latino 6% Black 3%
- Hispanic origin (detail)
- Mexican 1% Puerto Rican 4%
- Common ancestry
- Romanian 11% Subsaharan African 6% Lithuanian 2%
- Foreign-born
- 11% · Canada, China
- Languages at home
- 87% English-only · Russian/Polish/Slavic 5% Spanish 3% Arabic 2%
Political lean MEDSL · Onondaga
- 2024 margin
- D (+17.3) · D 58.6% · R 41.4%
- 2008→2024 swing
- -3.0pp toward R · 2008: 20.3pp · 2024: 17.3pp
- All cycles
- 2024: D+17.3 2020: D+20.6 2016: D+12.8 2012: D+21.1 2008: D+20.3
Not yet ingested
- Civics
- —
Market trends
- HPI YoY
- ▼ -27.23%
- Current HPI
- 326.7671
- Rent YoY
- —
- Metro
- Syracuse, NY
- State GDP YoY
- ▲ 2.60%
- F500 in state
- 92
Industry mix (Fortune 500 HQ in NY)
| Industry | F500 HQs | Revenue |
|---|---|---|
| Financial Services | 10 | $950B |
|
||
| Consumer Goods | 9 | $162B |
|
||
| Insurance | 4 | $225B |
|
||
| Telecommunications | 2 | $144B |
|
||
| Pharmaceuticals | 2 | $112B |
|
||
| Media / Entertainment | 2 | $69B |
|
||
Price history
3 events — show timeline
- 2026-05-19 Pending — CNYIS
- 2026-04-27 Contingent — CNYIS
- 2026-04-22 Listed $169,900 CNYIS
Property tax history
+11.2%/yrLatest (2025): $4,817 · +11.0% YoY. Source: county tax records.
Cash-flow waterfall
monthlySold comps — $/sqft
last 12 mo · ≤1 miLoading sold comps…