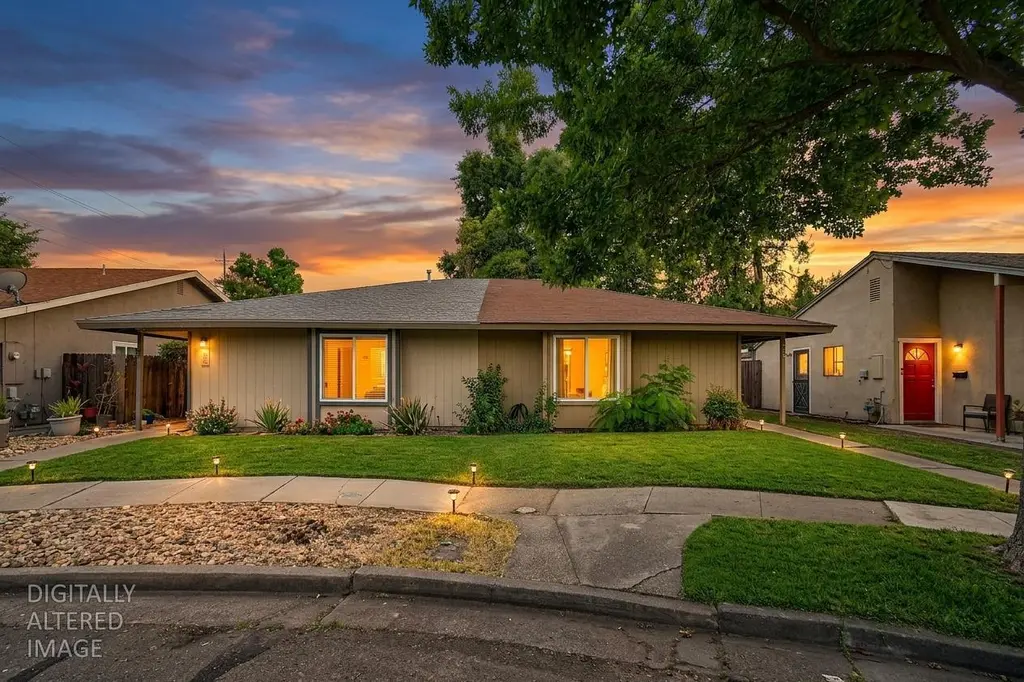
6829 Allegheny Ct · Stockton, CA
Flood risk 1/10 · Minimal
- FEMA flood zone
- X
- Chance of flooding over 30 yrs
- 0.0%
- Est. flood insurance / yr
- $507 – $1,088
Fire risk 1/10 · Minimal
- Est. fire insurance / yr
- $659 – $1,223
Heat risk 7/10 · Major
- Hot days now (above 103°F)
- 7 days/yr
- Hot days in 30 yrs
- 15 days/yr
Wind risk 1/10 · Minimal
- Chance of severe wind over 30 yrs
- —
Air-quality risk 10/10 · Severe
- Unhealthy air days now
- 22 days/yr
- Unhealthy air days in 30 yrs
- 24 days/yr
Risk factors via First Street. Map © Google.
Why this score? — see what drove the C- grade
The composite is a weighted blend of 9 inputs, each scored 0–100. Each bar is that input's sub-score; the figure is the points it added to the 100-point composite (weight × sub-score).
- ARV discount +14.4/15.0
- Appreciation +10.0/10.0
- Cash flow +9.4/30.0
- Rent growth +3.5/5.0
- Schools +3.0/10.0
- Livability +2.9/5.0
- DSCR +2.7/10.0
- Condition / age +2.5/5.0
- 1% rule +2.1/10.0
$269,999
🖨 Deal sheet (PDF) 📄 Offer letter ✓ Due diligence
Listing remarks
Opportunity awaits in Lincoln Village West! This 2-bedroom, 1-bath half-plex offers a functional layout, private backyard, covered patio, and a chance to create value through updates and improvements. Located within the desirable Lincoln Unified School District and close to parks, shopping, dining, and commuter routes. Whether you're a first-time buyer looking to build sweat equity or an investor searching for your next project, this property offers tremendous potential in a well-established neighborhood. Bring your vision and make it your own!
Key facts
- Close to parks
- Private backyard
- Covered patio
Tags
Property features AI
Finance
- HOA & community: Association membership (not mandatory); Quarterly HOA fee; HOA fee amount: $192 per quarter; Association provides additional community amenities
Exterior
- Parking: Alley access
- Utilities: Public water; Public sewer; Electric service: Other; Irrigation: Other
- Home design: Attached single-family residence; Built in 1973; Single-story
- Construction: Shingle roof
- Exterior features: Located on a cul-de-sac; No private pool or spa
Interior
- Kitchen: Breakfast area
- Bedrooms: 2 bedrooms (all on the main level)
- Flooring: Carpet; Simulated wood
- Bathrooms: 1 full bathroom with tub
- Heating & cooling: Central heating; Central cooling
- Interior features: Great room; Breakfast area; Dining/family combo; Dining/living combo
- Laundry & utility: Laundry closet
Neighborhood map
What this means for you Summary
Snapshot
- This is a 2-bed/1.0-bath single-family listed at $270k.
Deal economics
- At list price, monthly cash flow is $-191 ($-2k/yr) — negative.
- To cash-flow at today's rent, offer at most $236k (12.5% below list).
- To meet the 1% rule (rent ≥ 1% of price), the offer needs to be $192k (29.1% below list).
- Recommended offer: $192k (29.1% below list) — sets the bar for 1% rule.
- Cap rate 5.4% vs local median 3.6% in Stockton — top-decile yield for the area; either an underpriced asset or a hidden risk that comps aren't pricing in. Stress-test before assuming the spread holds.
Location & tenants
- Location reads 57/100 on livability (#734 in CA) — a working-class tenant base; expect higher turnover. Strengths: housing A+, health & safety A, amenities A-; Watch: employment C-, crime F, commute F.
- Lincoln Unified (urban): math 26% / reading 41% proficiency, ranked #284 of 517 in CA (top 55%) — families likely to look elsewhere, expect single-tenant / working-renter base with shorter leases.
- Zoned schools: Mable Barron (math 23% / reading 31%, grade F, #917 of 1,571 statewide, top 60%, 672 students, 57% FRL); Sierra Middle (math 25% / reading 48%, grade F, #175 of 498 statewide, top 36%, 572 students, 73% FRL); Lincoln High (math 35% / reading 64%, grade D, #352 of 1,170 statewide, top 31%, 2,936 students, 53% FRL).
- Market conditions: Rents rising fast (+4.2%/yr); 217 active listings in the ZIP; 35 comparable units currently listed for rent nearby; rentals leasing fast (median 5d on market — plan ~1-2 weeks tenant-placement turnaround); high-income renter base; 3,779 units permitted in San Joaquin County in 2024 (0 in 5+ unit buildings).
Forward outlook
- In year one you build about $29k of equity ($2k loan paydown + $27k appreciation (10.0% local appreciation)).
- San Joaquin County population projected at +17% by 2050 — long-run rental-demand tailwind backs the buy-and-hold thesis.
- By year 2, paydown + projected appreciation supports a ~$46k cash-out refi (75% LTV) — recoverable capital for the next deal without selling this one.
Negotiation context
- Only 7 days on market — expect competitive offers; lowballing is unlikely to land.
- Current owner paid $59k; list at $270k implies a 358% gain — meaningful room to come down on a strong offer.
Risks & watch-outs
- Climate carrying-cost: extreme-heat days projected 7→15/yr by 2055 (HVAC capex compounding) — expect insurance premiums to compound above CPI over the hold.
Questions for the listing agent
- What do current leases actually rent for vs. the listed asking? Can we see a recent rent roll and the last 12 months of T-12 income?
- Built in 1973 — when were the roof, HVAC, electrical panel, plumbing, and water heater last replaced?
- What does the HOA fee cover, when was the last increase, and are there any pending special assessments or reserve-fund shortfalls?
- Is there a deadline driving the sale (1031 exchange, divorce, estate, relocation)? That informs how much negotiation room exists.
- Schools are D-rated, which usually means shorter tenancies and higher turnover. Who's the typical renter profile here, and what's been the actual vacancy rate?
- Crime grade is F in this area — have there been break-ins, vandalism, or insurance claims at this property in the last 3 years? What carrier currently insures it and at what premium?
- What's the average days-on-market for RENTAL listings here right now (not sales)? A rising rental-DOM trend means longer vacancies and softer asking-rent achievability than the comps imply.
- What's the recent tenant-quality profile in this submarket — average credit score on applications, eviction rate, late-payment / NSF rate, and stable-employment percentage? A property-management company in the area should have these aggregated.
- How much new for-sale + rental construction is in the pipeline within 1–3 miles? Heavy new supply typically softens prices + rents 12–24 months out; constrained supply supports both.
Investment metrics
- 1% rule
- 0.71% ✗
- Cap rate
- 5.44%
- Cash-on-cash
- -3.03%
- DSCR
- 0.87
- GRM
- 11.7
CMA / ARV
- ARV (on-the-fly)
- $318,954
- Comps found
- 6
Show comp detail 6 sales within ~0.75 mi
| Address | Dist | Beds/Ba | Sqft | Sold | Price | $/sf | Match |
|---|---|---|---|---|---|---|---|
| 6885 Sumter Quay Cir | 0.20mi | 2/1.0 | 901 (0%) | 6mo | $319,000 | $354 | 86 |
| 6900 Allegheny Pl | 0.11mi | 2/1.0 | 903 (+0%) | 10mo | $319,900 | $354 | 86 |
| 6831 Butler Ct | 0.06mi | 2/1.0 | 901 (0%) | 22mo | $325,000 | $361 | 79 |
| 6832 Butler Ct | 0.03mi | 2/1.0 | 901 (0%) | 24mo | $315,000 | $350 | 79 |
| 3518 W Benjamin Holt Dr | 0.39mi | 2/1.0 | 902 (+0%) | 12mo | $300,000 | $333 | 71 |
| 6904 Allegheny Pl | 0.12mi | 3/1.0 (+1) | 999 (+11%) | 10mo | $325,000 | $325 | 63 |
Match score weights: distance 35% · size 25% · config 20% · recency 20%. Top-matched comps best support the ARV.
Projected returns pro-forma
10.0% appreciation · 4.16% rent growth · sell at horizon
- IRR
- 22.4%
- Equity multiple
- 2.81×
- Total profit
- $137,066
- Equity at exit
- $243,236
- IRR
- 20.3%
- Equity multiple
- 6.53×
- Total profit
- $417,882
- Equity at exit
- $524,549
Cash invested: $75,600 (down + closing). Projections, not guarantees.
Landlord ↔ Tenant lean methodology
- Overall (STATE)
- 18 Strongly Tenant-Friendly
- State California
- 18 Strongly Tenant-Friendly · D+13
- County
- — inherits STATE
- City
- — inherits STATE
ZIP-level market 95219
- Home prices YoY
- 6.6%
- Rents YoY
- 4.2%
- Active inventory
- 217
- Price-to-rent
- 11.7×
Monthly cashflow live
- Estimated rent
- $1,916 high interval (Pro) →
- Mortgage (P&I)
- −$1,416
- Tax from tax record
- −$112 /mo · $1,344/yr
- Insurance
- −$112
- HOA
- −$64
- Vacancy / Maint / Mgmt
- −$402
- Net cashflow
- $-191
Break-even live
Sensitivity live
| Price | -10% $-38 | -5% $-115 | +0% $-191 | +5% $-268 | +10% $-344 |
|---|---|---|---|---|---|
| Rent | -10% $-342 | -5% $-267 | +0% $-191 | +5% $-115 | +10% $-40 |
| Rate | -1.0pp $-55 | -0.5pp $-122 | base $-191 | +0.5pp $-261 | +1.0pp $-332 |
UW: 25.0% down · 7.5% · 30yr · 1.5% tax · 5.0% vac · 8.0% maint · 8.0% mgmt
Financing live
Cash to close
- Down payment
- $67,500
- Closing costs
- $8,100
- Reserves months
- —
- Total cash needed
- —
Loan-product check · same deal, 3 products live
Conventional
25% down · 7.5% · 30yr
- Down + closing
- —
- Monthly P&I
- —
- Monthly cashflow
- —
- DSCR
- —
- Eligible?
- —
Personal DTI + credit; lowest rate.
DSCR
20% down · 8.5% · 30yr
- Down + closing
- —
- Monthly P&I
- —
- Monthly cashflow
- —
- DSCR
- —
- Eligible?
- —
No personal income docs; deal must DSCR.
Hard money
10% down · 12.0% · 12mo
- Down + closing
- —
- Monthly P&I
- —
- Monthly cashflow
- —
- DSCR
- —
- Eligible?
- —
Short-term bridge; refi at stabilization.
Rent comps 35 comps
| Address | Beds | Baths | Sqft | Rent | $/sqft | DOM | Units | Dist |
|---|---|---|---|---|---|---|---|---|
| 3286 Blue Ridge Cir Stockton, CA | 2.0 | 1.0 | 975 | $1,950 | $2.00 | 25d | 1 | 0.06mi |
| 3286 Blue Ridge Cir Stockton, CA | 1.0 | 1.0 | 725 | $1,495 | $2.06 | 5d | 1 | 0.06mi |
| 3286 Blue Ridge Cir Stockton, CA | 1.0–2.0 | 1.0 | 850 | $1,950 | $2.29 | 12d | 2 | 0.06mi |
| 6851 Plymouth Rd Unit 3 Stockton, CA | 3.0 | 2.0 | 1100 | $2,350 | $2.14 | 45d | 1 | 0.15mi |
| 6851 Plymouth Rd Unit 2 Stockton, CA | 2.0 | 1.0 | 860 | $1,750 | $2.03 | 45d | 1 | 0.15mi |
| 6851 Plymouth Rd Unit 1 Stockton, CA | 1.0 | 1.0 | 680 | $1,450 | $2.13 | 45d | 1 | 0.15mi |
| 2903 Whittier Ct Stockton, CA | 3.0 | 2.0 | 1102 | $1,995 | $1.81 | 25d | 1 | 0.22mi |
| 6724 Plymouth Rd Stockton, CA | 1.0–2.0 | 1.0 | 660 | $1,850 | $2.80 | 5d | 2 | 0.27mi |
| 6724 Plymouth Rd Stockton, CA | 1.0 | 1.0 | 560 | $1,400 | $2.50 | 45d | 1 | 0.27mi |
| 3525 W Benjamin Holt Dr Stockton, CA | 1.0–2.0 | 1.0–1.5 | 710 | $2,015 | $2.84 | 4d | 11 | 0.27mi |
| 6724 Plymouth Rd #37 Stockton, CA | 2.0 | 1.0 | 760 | $1,850 | $2.43 | 25d | 1 | 0.29mi |
| 3335 Riverton Way Stockton, CA | 2.0 | 1.0 | 1064 | $2,402 | $2.26 | 21d | 1 | 0.30mi |
| 6408 Morgan Pl Stockton, CA | 1.0–2.0 | 1.0 | 615 | $1,960 | $3.19 | 4d | 4 | 0.47mi |
| 6353 Morgan Pl Stockton, CA | 2.0 | 1.0 | 875 | $1,975 | $2.26 | 45d | 1 | 0.48mi |
| 7355 Kelley Dr Stockton, CA | 2.0 | 1.0 | 890 | $1,800 | $2.02 | 5d | 1 | 0.50mi |
| 7356 Kelley Dr Stockton, CA | 2.0 | 2.0 | 1110 | $1,600 | $1.44 | 25d | 1 | 0.51mi |
| 2973 W Swain Rd Stockton, CA | 1.0–2.0 | 1.0 | 685 | $1,925 | $2.81 | 4d | 6 | 0.56mi |
| 3038 W Swain Rd Stockton, CA | 2.0 | 1.0 | 920 | $2,100 | $2.28 | 5d | 1 | 0.62mi |
| 3722 W Benjamin Holt Dr #13 Stockton, CA | 2.0 | 2.0 | 978 | $2,000 | $2.04 | 45d | 1 | 0.65mi |
| 7565 Shoreline Dr Stockton, CA | 1.0–2.0 | 1.0–2.0 | 847 | $2,255 | $2.66 | 3d | 4 | 0.71mi |
| 3790 W Benjamin Holt Dr #13 Stockton, CA | 2.0 | 2.0 | 979 | $1,850 | $1.89 | 25d | 1 | 0.75mi |
| 5858 Morgan Pl Stockton, CA | 2.0 | 1.0–2.0 | 884 | $1,872 | $2.12 | 4d | 7 | 0.79mi |
| 7901 Montgomery Ave Unit 009 Stockton, CA | 2.0 | 1.5 | 1050 | $2,100 | $2.00 | 4d | 1 | 0.89mi |
| 7901 Montgomery Ave Unit 010 Stockton, CA | 2.0 | 1.5 | 1050 | $2,075 | $1.98 | 4d | 1 | 0.89mi |
| 7921 Montgomery Ave Stockton, CA | 3.0 | 2.0 | 1125 | $1,695 | $1.51 | 45d | 1 | 0.92mi |
| 7912 Richland Way Stockton, CA | 2.0–3.0 | 1.0–2.0 | 997 | $2,079 | $2.08 | 0d | 7 | 0.92mi |
| 5834 Brush Creek Dr Stockton, CA | 3.0 | 2.0 | 1100 | $2,295 | $2.09 | 4d | 1 | 0.94mi |
| 8035 Mariners Dr Stockton, CA | 1.0–2.0 | 1.0–2.0 | 942 | $2,179 | $2.31 | 4d | 20 | 1.12mi |
| 8473 Kelley Dr Unit D Stockton, CA | 2.0 | 1.5 | 980 | $1,650 | $1.68 | 13d | 1 | 1.22mi |
| 5301 Feather River Dr Stockton, CA | 1.0–2.0 | 1.0–2.0 | 852 | $2,575 | $3.02 | 4d | 6 | 1.35mi |
| 3591 Quail Lakes Dr Stockton, CA | 2.0 | 2.0 | 930 | $1,595 | $1.72 | 5d | 1 | 1.36mi |
| 8531 Mariners Dr Stockton, CA | 2.0 | 1.0–1.5 | 946 | $2,210 | $2.34 | 0d | 4 | 1.40mi |
| 7734 Brentwood Dr Unit 11 Stockton, CA | 2.0 | 1.0 | 1000 | $1,550 | $1.55 | 25d | 1 | 1.40mi |
| 7718 Brentwood Dr Stockton, CA | 2.0 | 1.0 | 950 | $1,490 | $1.57 | 45d | 1 | 1.41mi |
| 7820 Brentwood Dr Stockton, CA | 1.0 | 1.0 | 600 | $1,375 | $2.29 | 4d | 1 | 1.43mi |
HOA detail
- Monthly dues
- $64 · $768/yr
Listing history 5 events
-
2026-06-10pricedays on market $269,999 Active 7 DOM
-
2026-06-09days on market $289,999 Active 6 DOM
-
2026-06-08days on market $289,999 Active 5 DOM
-
2026-06-07remarks 550-char remark
-
2026-06-07$289,999 Active 4 DOM
ⓘ Source: listings_history table (triggers on properties + properties_extension) + one-shot
backfill from property_details.listing_events for pre-trigger history.
Tax reassessment forecast CA · Resets to sale price
- Current annual tax
- $1,344 · $112/mo
- Projected year-2 tax
- $2,052 · $171/mo
- Expected delta
- +$708/yr (+$59/mo · 52.7%)
ⓘ Screening estimate from a state-policy table — verify with the county assessor before closing.
Climate risk First Street
- Flood 1/10 Low FEMA zone X · 0% chance over 30 yrs
- Wildfire 1/10 Low
- Heat 7/10 Severe 7 d/yr ≥103°F today · 15 d/yr by 30 yrs out
- Wind 1/10 Low
- Air quality 10/10 Extreme 22 unhealthy d/yr today · 24 by 30 yrs out
Nearby sold comps map
Loading sold comps map…
Walkable amenities ~0.75 mi
Loading nearby amenities…
Taxation est. · year 1
- Rental income
- $22,986
- − Mortgage interest
- −$15,124
- − Property taxes
- −$1,344
- − Insurance
- −$1,350
- − Repairs & maintenance
- −$1,839
- − Management
- −$1,839
- − HOA
- −$768
- − Depreciation
- −$7,855
- Taxable loss
- −$7,132
- Est. tax savings @ 24.0%
- +$1,712
- After-tax cash flow
- $-582/yr
For passive investors: Depreciation is non-cash, so a rental often shows a tax loss while cash-flowing — sheltering income. Rental losses are passive: they offset passive income freely, and up to $25,000/yr can offset ordinary (W-2) income if you actively participate and your MAGI is under $100k (phasing out to $0 by $150k); unused losses carry forward. On sale, claimed depreciation is recaptured at up to 25%, and gains may owe capital-gains tax (a 1031 exchange can defer both). Figures are a year-1 estimate at your 24.0% rate — not tax advice; consult a CPA.
Schools (NCES district)
- District
- Lincoln Unified
- NCES district ID
- 0621690
- Math proficiency
- 26% ▼ -11.00%
- Reading proficiency
- 41% ▼ -11.00%
- Median HH income
- $56,356
- Composite
- 29.66/100
- National rank
- #6465
- State rank
- #284 of 517 in CA
Livability — Stockton
- Score
- 57/100
- State rank
- #734
- US rank
- #21638
Category grades
Schools grade is shown separately in the Schools card above.
Census & demographics
- Census place
- Stockton, CA
- County
- San Joaquin County · 729,570 people
- City population
- 332,006
- Metro
- Stockton, CA
- Population (ZIP)
- 31,713
- Household income
- $112,268
- Rent vs Own
- Severe rent burden
- 825.0
Population outlook (San Joaquin County) Hauer SSP2
- Today (2025)
- 796,965 people
- By 2030
- 828,849 · +4.0%
- By 2040
- 885,611 · +11.1%
- By 2050
- 929,798 · +16.7%
- By 2075
- 994,578 · +24.8%
- By 2100
- 971,291 · +21.9%
Race, ethnicity, and origin ACS 2023
- Neighborhood character
- Highly diverse neighborhood (Simpson 0.75)
- Race & ethnicity
- White 33% Hispanic / Latino 30% Asian 21% Two or more races 18% Black 9%
- Hispanic origin (detail)
- Mexican 27%
- Common ancestry
- Slovak 2% Italian 2% Portuguese 1%
- Foreign-born
- 20% · Canada, China, Vietnam
- Languages at home
- 69% English-only · Spanish 14% Other Indo-European 4% Other Asian/Pacific 4%
Political lean MEDSL · San Joaquin
- 2024 margin
- Toss-up / Even · D 48.0% · R 48.9% · Other 3.0%
- 2008→2024 swing
- -11.6pp toward R · 2008: 10.7pp · 2024: -0.9pp
- All cycles
- 2024: R+0.9 2020: D+13.9 2016: D+12.9 2012: D+8.9 2008: D+10.7
Not yet ingested
- Civics
- —
Market trends
- HPI YoY
- ▲ 69.26%
- Current HPI
- 1122.61
- Rent YoY
- ▲ 4.16%
- Metro
- Stockton, CA
- State GDP YoY
- ▲ 3.21%
- F500 in state
- 116
Industry mix (Fortune 500 HQ in CA)
| Industry | F500 HQs | Revenue |
|---|---|---|
| Technology | 27 | $1,492B |
|
||
| Financial Services | 3 | $174B |
|
||
| Retail | 3 | $44B |
|
||
| Insurance | 3 | $26B |
|
||
| Media / Entertainment | 2 | $115B |
|
||
| Pharmaceuticals / Biotech | 2 | $62B |
|
||
Price history
+156.5% since first listed2 events — show timeline
- 1999-06-24 Sold (Public Records) $59,000 Public Records
- 1980-12-18 Sold (Public Records) $23,000 Public Records
Property tax history
+2.3%/yrLatest (2025): $1,344 · +2.5% YoY. Source: county tax records.
Cash-flow waterfall
monthlySold comps — $/sqft
last 12 mo · ≤1 miLoading sold comps…