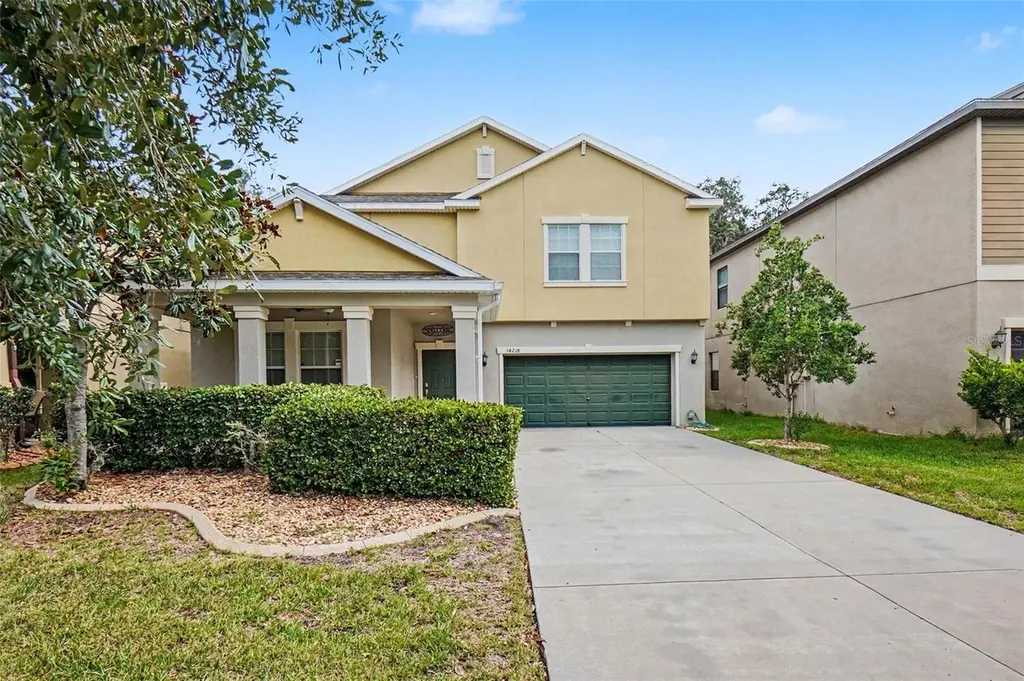
14218 Blue Dasher Dr · Fish Hawk, FL
Flood risk 1/10 · Minimal
- FEMA flood zone
- X (unshaded)
- Chance of flooding over 30 yrs
- 0.0%
- Est. flood insurance / yr
- $507 – $1,088
Fire risk 5/10 · Moderate
- Est. fire insurance / yr
- $947 – $1,759
Heat risk 10/10 · Severe
- Hot days now (above 109°F)
- 7 days/yr
- Hot days in 30 yrs
- 26 days/yr
Wind risk 9/10 · Severe
- Chance of severe wind over 30 yrs
- 99.0%
Air-quality risk 3/10 · Minor
- Unhealthy air days now
- 3 days/yr
- Unhealthy air days in 30 yrs
- 3 days/yr
Risk factors via First Street. Map © Google.
Why this score? — see what drove the D grade
The composite is a weighted blend of 9 inputs, each scored 0–100. Each bar is that input's sub-score; the figure is the points it added to the 100-point composite (weight × sub-score).
- Cash flow +12.1/30.0
- ARV discount +7.5/15.0
- Schools +4.2/10.0
- 1% rule +3.7/10.0
- Livability +3.7/5.0
- DSCR +3.6/10.0
- Rent growth +3.0/5.0
- Condition / age +2.5/5.0
- Appreciation +0.0/10.0
$460,000
🖨 Deal sheet (PDF) 📄 Offer letter ✓ Due diligence
Listing remarks MLS
Come check out our new exclusive gated community located in the Fish Hawk area! This 63 home community backs up to the Fish Hawk Preserve. Highly desired Fish Hawk Schools- Stowers Elementary, Barrington Middle, and Newsome High. No CDD Fees! Low HOA of $88 a month. HOA includes: Gated community, dog park, central park area, Fish Hawk Preserve Nature Trails, and common area maintenance. This 5 Bedroom, 3 full bath, 3 car garage, with huge game room, and flex room is on a premium conservation homesite backing up to the preserve! The future homeowner will never have a backyard neighbor because the Preserve is protected land! Everything's Included! This home includes:18X18 Ceramic tile all throughout the first floor(except the bedroom downstairs has carpet), Granite kitchen and bathroom countertops, beautiful 42" cabinets staggered with crown molding, Stainless Steel GE Appliances, washer, dryer, Fan package, Coach lights, Garage Door Opener, Pendant Lights, and much more! Super energy efficient! Awesome warranties!! Closing Cost Incentives! This community is selling very fast. You don't want to miss out on this gorgeous community!
Key facts
- Gated community
- Open concept living
- Private bedroom
Tags
Property features AI
Finance
- Other: Lease restrictions apply
- HOA & community: HOA managed by Excelsior Community Management LLC; Monthly HOA fee $135 (required; association approval required); Community features include deed restrictions, dog park, and sidewalks; Pets allowed
Exterior
- Parking: Attached garage; 3-car garage (tandem)
- Utilities: Public water; Public sewer; Public utilities
- Home design: Single-family residence; Two stories; Facing south
- Construction: Stucco construction; Shingle roof; Slab foundation; Built on a 0.16-acre lot
- Exterior features: Sliding doors; In-ground private pool; Paved road access
Interior
- Kitchen: Dishwasher; Microwave; Range; Refrigerator
- Bedrooms: 5 bedrooms
- Flooring: Tile flooring
- Bathrooms: 3 full bathrooms
- Heating & cooling: Central heating; Central air conditioning
- Interior features: Ceiling fans
- Laundry & utility: Laundry room with washer and electric dryer hookups; Upper-level laundry
Neighborhood map
What this means for you Summary
Snapshot
- This is a 5-bed/3.0-bath single-family listed at $460k.
Deal economics
- At list price, monthly cash flow is $-102 ($-1k/yr) — negative.
- To cash-flow at today's rent, offer at most $442k (3.9% below list).
- To meet the 1% rule (rent ≥ 1% of price), the offer needs to be $401k (12.8% below list).
- Recommended offer: $401k (12.8% below list) — sets the bar for 1% rule.
Location & tenants
- Location reads 73/100 on livability (#301 in FL) — a middle-class / working-renter tenant base. Strengths: crime A+, employment A+, housing A+; Watch: amenities F, commute F, cost of living F.
- Hillsborough (suburban): math 47% / reading 50% proficiency, ranked #41 of 73 in FL (top 56%) — families likely to look elsewhere, expect single-tenant / working-renter base with shorter leases.
- Zoned schools: Stowers Elementary School (math 81% / reading 82%, grade A+, #90 of 2,144 statewide, top 4%, 895 students, 14% FRL); Barrington Middle School (math 70% / reading 63%, grade A-, #84 of 571 statewide, top 16%, 1,434 students, 34% FRL); Newsome High School (math 64% / reading 77%, grade B+, #55 of 667 statewide, top 8%, 3,203 students, 18% FRL) — zoned schools average 22% FRL vs 52% district-wide (30 pts lower); this property's tenant base skews higher-income than the district average.
- Zoned-school proficiency averages 73% at this address vs 48% district-wide (+24 pts) — the actual schools serving this property are materially stronger than the Hillsborough average implies; a family-tenant draw the district grade alone would hide.
- Market conditions: Rents rising (+2.0%/yr); 231 active listings in the ZIP; 5 comparable units currently listed for rent nearby; rentals at typical pace (median 20d on market — plan ~3-4 weeks tenant-placement turnaround); solid renter incomes; 9,053 units permitted in Hillsborough County in 2024 (4,555 in 5+ unit buildings).
- At $4,012/mo this rent would consume 46% of the median local household income ($105k/yr) (locally 562% of renters already pay >50% of income on rent) — very limited rent-growth headroom before tenants either downsize or default.
Forward outlook
- Local home prices are declining (-3.0%/yr); year-one equity from $3k of loan paydown is wiped out by about $14k of value loss. Plan a longer hold.
- Hillsborough County population projected at +37% by 2050 — long-run rental-demand tailwind backs the buy-and-hold thesis.
Negotiation context
- Only 3 days on market — expect competitive offers; lowballing is unlikely to land.
- 2 sale attempts since 10y ago with the ask held roughly flat each time — persistent listings suggest the price (not the market) is what's stuck; bring a comps-based counter.
Risks & watch-outs
- Climate carrying-cost: severe wind risk, 99% chance of damaging wind over 30y; moderate wildfire risk; extreme-heat days projected 7→26/yr by 2055 (HVAC capex compounding) — expect insurance premiums to compound above CPI over the hold.
Questions for the listing agent
- What do current leases actually rent for vs. the listed asking? Can we see a recent rent roll and the last 12 months of T-12 income?
- What does the HOA fee cover, when was the last increase, and are there any pending special assessments or reserve-fund shortfalls?
- Is there a deadline driving the sale (1031 exchange, divorce, estate, relocation)? That informs how much negotiation room exists.
- Schools are A-rated — typically a magnet for longer-tenancy family renters. What's the average tenant stay here, and is there a school-zone premium baked into asking?
- The area grade is low — what's the realistic commute time and amenity access for the typical tenant pool here? Any planned neighborhood developments (good or bad) we should know about?
- What's the average days-on-market for RENTAL listings here right now (not sales)? A rising rental-DOM trend means longer vacancies and softer asking-rent achievability than the comps imply.
- What's the recent tenant-quality profile in this submarket — average credit score on applications, eviction rate, late-payment / NSF rate, and stable-employment percentage? A property-management company in the area should have these aggregated.
- How much new for-sale + rental construction is in the pipeline within 1–3 miles? Heavy new supply typically softens prices + rents 12–24 months out; constrained supply supports both.
Investment metrics
- 1% rule
- 0.87% ✗
- Cap rate
- 6.03%
- Cash-on-cash
- -0.95%
- DSCR
- 0.96
- GRM
- 9.6
CMA / ARV
No comps found within radius.
Projected returns pro-forma
-3.0% appreciation · 2.0% rent growth · sell at horizon
- IRR
- -19.0%
- Equity multiple
- 0.34×
- Total profit
- $-84,935
- Equity at exit
- $68,587
- IRR
- -13.7%
- Equity multiple
- 0.24×
- Total profit
- $-97,946
- Equity at exit
- $39,772
Cash invested: $128,800 (down + closing). Projections, not guarantees.
Landlord ↔ Tenant lean methodology
- Overall (STATE)
- 87 Strongly Landlord-Friendly
- State Florida
- 87 Strongly Landlord-Friendly · R+3
- County
- — inherits STATE
- City
- — inherits STATE
ZIP-level market 33569
- Home prices YoY
- -16.7%
- Rents YoY
- 2.0%
- Active inventory
- 231
- Price-to-rent
- 9.6×
Monthly cashflow live
- Estimated rent
- $4,012 high interval (Pro) →
- Mortgage (P&I)
- −$2,412
- Tax from tax record
- −$532 /mo · $6,390/yr
- Insurance
- −$192
- HOA
- −$135
- Vacancy / Maint / Mgmt
- −$842
- Net cashflow
- $-102
Break-even live
Sensitivity live
| Price | -10% $158 | -5% $28 | +0% $-102 | +5% $-233 | +10% $-363 |
|---|---|---|---|---|---|
| Rent | -10% $-419 | -5% $-261 | +0% $-102 | +5% $56 | +10% $215 |
| Rate | -1.0pp $129 | -0.5pp $15 | base $-102 | +0.5pp $-222 | +1.0pp $-343 |
UW: 25.0% down · 7.5% · 30yr · 1.5% tax · 5.0% vac · 8.0% maint · 8.0% mgmt
Financing live
Cash to close
- Down payment
- $115,000
- Closing costs
- $13,800
- Reserves months
- —
- Total cash needed
- —
Loan-product check · same deal, 3 products live
Conventional
25% down · 7.5% · 30yr
- Down + closing
- —
- Monthly P&I
- —
- Monthly cashflow
- —
- DSCR
- —
- Eligible?
- —
Personal DTI + credit; lowest rate.
DSCR
20% down · 8.5% · 30yr
- Down + closing
- —
- Monthly P&I
- —
- Monthly cashflow
- —
- DSCR
- —
- Eligible?
- —
No personal income docs; deal must DSCR.
Hard money
10% down · 12.0% · 12mo
- Down + closing
- —
- Monthly P&I
- —
- Monthly cashflow
- —
- DSCR
- —
- Eligible?
- —
Short-term bridge; refi at stabilization.
Rent comps 5 comps
| Address | Beds | Baths | Sqft | Rent | $/sqft | DOM | Units | Dist |
|---|---|---|---|---|---|---|---|---|
| 12114 Creek Edge Dr Riverview, FL | 4.0 | 4.0 | 3278 | $4,800 | $1.46 | 19d | 1 | 0.55mi |
| 14242 Natures Reserve Dr Lithia, FL | 4.0 | 3.5 | 2635 | $3,295 | $1.25 | 19d | 1 | 1.01mi |
| 11212 Hawks Fern Dr Riverview, FL | 5.0 | 4.0 | 3567 | $3,995 | $1.12 | 16d | 1 | 1.13mi |
| 14649 Brumby Ridge Ave Lithia, FL | 5.0 | 3.0 | 2471 | $3,000 | $1.21 | 22d | 1 | 1.30mi |
| 14322 Parkside Ridge Way Lithia, FL | 5.0 | 3.0 | 2779 | $3,400 | $1.22 | 19d | 1 | 1.30mi |
HOA detail
- Monthly dues
- $135 · $1,620/yr
- Likely covers
- security
Listing history 3 events
-
2026-06-15days on market $460,000 Active 3 DOM
-
2026-06-13remarks 693-char remark
-
2026-06-13$460,000 Active 1 DOM
ⓘ Source: listings_history table (triggers on properties + properties_extension) + one-shot
backfill from property_details.listing_events for pre-trigger history.
Tax reassessment forecast FL · Resets to sale price
- Current annual tax
- $6,390 · $532/mo
- Projected year-2 tax
- $6,390 · $532/mo
- Expected delta
- $0/yr ($0/mo · 0.0%)
ⓘ Screening estimate from a state-policy table — verify with the county assessor before closing.
Climate risk First Street
- Flood 1/10 Low FEMA zone X (unshaded) · 0% chance over 30 yrs
- Wildfire 5/10 Major
- Heat 10/10 Extreme 7 d/yr ≥109°F today · 26 d/yr by 30 yrs out
- Wind 9/10 Extreme 99% chance of damaging wind over 30 yrs
- Air quality 3/10 Moderate 3 unhealthy d/yr today · 3 by 30 yrs out
Nearby sold comps map
Loading sold comps map…
Walkable amenities ~0.75 mi
Loading nearby amenities…
Taxation est. · year 1
- Rental income
- $48,138
- − Mortgage interest
- −$25,767
- − Property taxes
- −$6,390
- − Insurance
- −$2,300
- − Repairs & maintenance
- −$3,851
- − Management
- −$3,851
- − HOA
- −$1,620
- − Depreciation
- −$13,382
- Taxable loss
- −$9,022
- Est. tax savings @ 24.0%
- +$2,165
- After-tax cash flow
- $938/yr
For passive investors: Depreciation is non-cash, so a rental often shows a tax loss while cash-flowing — sheltering income. Rental losses are passive: they offset passive income freely, and up to $25,000/yr can offset ordinary (W-2) income if you actively participate and your MAGI is under $100k (phasing out to $0 by $150k); unused losses carry forward. On sale, claimed depreciation is recaptured at up to 25%, and gains may owe capital-gains tax (a 1031 exchange can defer both). Figures are a year-1 estimate at your 24.0% rate — not tax advice; consult a CPA.
Schools (NCES district)
- District
- Hillsborough
- NCES district ID
- 1200870
- Math proficiency
- 47% ▼ -8.00%
- Reading proficiency
- 50% ▼ -4.00%
- Median HH income
- $50,622
- Composite
- 41.6/100
- National rank
- #3435
- State rank
- #41 of 73 in FL
Livability — Fish Hawk
- Score
- 73/100
- State rank
- #301
- US rank
- #5133
Category grades
Schools grade is shown separately in the Schools card above.
Census & demographics
- Census place
- Fish Hawk, FL
- County
- Hillsborough County · 1,540,968 people
- Metro
- Tampa-St. Petersburg-Clearwater, FL
- Population (ZIP)
- 27,867
- Household income
- $105,275
- Rent vs Own
- Severe rent burden
- 562.0
Population outlook (Hillsborough County) Hauer SSP2
- Today (2025)
- 1,607,022 people
- By 2030
- 1,733,968 · +7.9%
- By 2040
- 1,979,565 · +23.2%
- By 2050
- 2,203,427 · +37.1%
- By 2075
- 2,667,893 · +66.0%
- By 2100
- 2,891,558 · +79.9%
Race, ethnicity, and origin ACS 2023
- Neighborhood character
- Diverse neighborhood (Simpson 0.60)
- Race & ethnicity
- White 58% Hispanic / Latino 21% Black 12% Two or more races 11% Asian 5%
- Hispanic origin (detail)
- Mexican 3% Puerto Rican 5% Cuban 5% Dominican 3%
- Common ancestry
- Romanian 2% Iranian 1% Lithuanian 1%
- Foreign-born
- 15% · Canada, Jamaica
- Languages at home
- 78% English-only · Spanish 14% Other Indo-European 3% Other Asian/Pacific 1%
Political lean MEDSL · Hillsborough
- 2024 margin
- Toss-up / Even · D 47.8% · R 50.9% · Other 1.3%
- 2008→2024 swing
- -10.2pp toward R · 2008: 7.1pp · 2024: -3.1pp
- All cycles
- 2024: R+3.1 2020: D+6.9 2016: D+6.8 2012: D+6.7 2008: D+7.1
Not yet ingested
- Civics
- —
Market trends
- HPI YoY
- ▼ -59.47%
- Current HPI
- 296.9169
- Rent YoY
- ▲ 2.00%
- Metro
- Tampa-St. Petersburg-Clearwater, FL
- State GDP YoY
- ▲ 3.28%
- F500 in state
- 36
Industry mix (Fortune 500 HQ in FL)
| Industry | F500 HQs | Revenue |
|---|---|---|
| Industrial Technology | 2 | $29B |
|
||
| Insurance | 2 | $17B |
|
||
| Retail | 1 | $60B |
|
||
| Technology Distribution | 1 | $58B |
|
||
| Homebuilding | 1 | $35B |
|
||
| Technology Manufacturing | 1 | $35B |
|
||
Price history
+46.2% since first listed6 events — show timeline
- 2026-06-12 Listed $460,000 Stellar MLS as Distributed by MLS Grid
- 2026-04-13 Sold (Public Records) $460,000 Public Records
- 2016-06-10 Sold (MLS) $309,690 Stellar MLS as Distributed by MLS Grid
- 2016-05-18 Pending — Stellar MLS as Distributed by MLS Grid
- 2016-03-11 Price Changed $309,690 Stellar MLS as Distributed by MLS Grid
- 2016-03-07 Listed $314,690 Stellar MLS as Distributed by MLS Grid
Property tax history
+19.2%/yrLatest (2025): $6,390 · +8.2% YoY. Source: county tax records.
Cash-flow waterfall
monthlySold comps — $/sqft
last 12 mo · ≤1 miLoading sold comps…