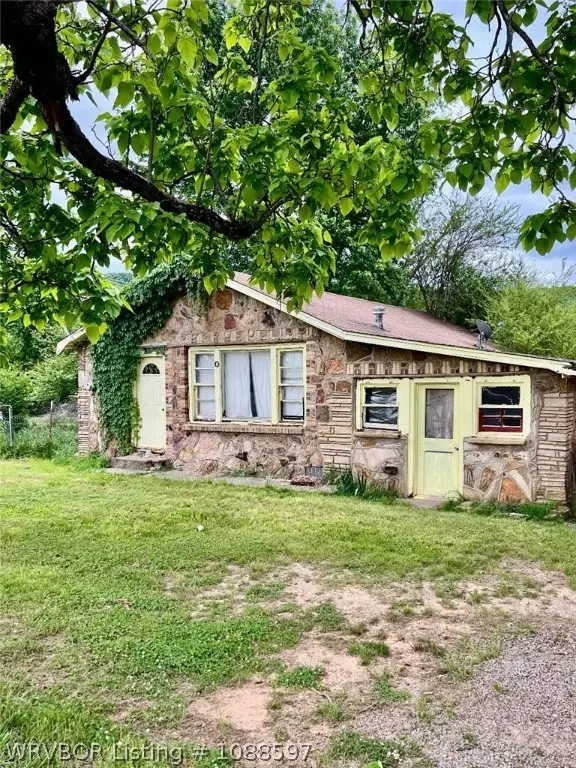
1200 N 2nd St · Ozark, AR
Flood risk No data
- FEMA flood zone
- —
- Chance of flooding over 30 yrs
- —
- Est. flood insurance / yr
- —
Fire risk No data
- Est. fire insurance / yr
- —
Heat risk No data
- Hot days now (above threshold)
- —
- Hot days in 30 yrs
- —
Wind risk No data
- Chance of severe wind over 30 yrs
- —
Air-quality risk No data
- Unhealthy air days now
- —
- Unhealthy air days in 30 yrs
- —
Risk factors via First Street. Map © Google.
Why this score? — see what drove the B- grade
The composite is a weighted blend of 9 inputs, each scored 0–100. Each bar is that input's sub-score; the figure is the points it added to the 100-point composite (weight × sub-score).
- Cash flow +30.0/30.0
- 1% rule +10.0/10.0
- DSCR +10.0/10.0
- ARV discount +7.5/15.0
- Schools +3.2/10.0
- Livability +3.0/5.0
- Rent growth +2.5/5.0
- Condition / age +1.0/5.0
- Appreciation +0.0/10.0
$39,000
🖨 Deal sheet (PDF) 📄 Offer letter ✓ Due diligence
Listing remarks
Tender loving care and repair is what this historic gem needs. If you are looking for a 2 bedroom 1 bath home with character and the opportunity for sweat equity then look no further. Laundry room and bonus room. Quick access to I-40 for that daily commute. Extra parcel behind the home will convey with easement. Great opportunity to build. Please call agent for more information about condition.
Key facts
- Historic gem
- Laundry room
- Bonus room
Tags
Property features AI
Exterior
- Utilities: Electricity available
- Home design: Single-family residence; Multi/split levels; Fixer condition
- Construction: Stone and frame construction; Block foundation; Asphalt shingle roof
- Exterior features: Back yard fence; No patio or porch; City lot; Level lot; Lot dimensions approximately 100 x 70
Interior
- Flooring: Wood
- Bathrooms: 1 full bathroom
- Heating & cooling: No heating; No cooling
- Interior features: Storage; Wood flooring; Fireplace in the family room (1)
- Laundry & utility: Electric dryer hookup
Neighborhood map
What this means for you Summary
Snapshot
- This is a 2-bed/1.0-bath single-family listed at $39k. Condition is rated poor.
Deal economics
- At list price, monthly cash flow is $481 ($6k/yr) — positive.
- The deal already cash-flows at list — no discount required.
- Meets the 1% rule at list price ($924 rent vs $39k).
- Recommended offer: $38k (3.0% below list) — sets the bar for market timing.
- Cap rate 21.1% vs local median 3.1% in Ozark — top-decile yield for the area; either an underpriced asset or a hidden risk that comps aren't pricing in. Stress-test before assuming the spread holds.
Location & tenants
- Location reads 60/100 on livability (#258 in AR) — a middle-class / working-renter tenant base. Strengths: cost of living A+, housing A; Watch: crime F, amenities F, commute F.
- Ozark School District (town): math 41% / reading 38% proficiency, ranked #80 of 238 in AR (top 34%) — families likely to look elsewhere, expect single-tenant / working-renter base with shorter leases.
- Zoned schools: Ozark Upper Elementary School (math 40% / reading 31%, grade F, #250 of 454 statewide, top 55%, 267 students, 57% FRL); Ozark Middle School (math 57% / reading 41%, grade C-, #37 of 201 statewide, top 18%, 234 students, 56% FRL); Ozark High School (math 22% / reading 39%, grade F, #134 of 292 statewide, top 47%, 700 students, 46% FRL) — zoned schools at 53% FRL track the district average.
- Market conditions: 82 active listings in the ZIP; 23 units permitted in Franklin County in 2024 (0 in 5+ unit buildings).
Forward outlook
- Local home prices are declining (-3.0%/yr); year-one equity from $270 of loan paydown is wiped out by about $1k of value loss. Plan a longer hold.
- Franklin County population projected at -16% by 2050 — secular population decline; favor cash flow + early exit over multi-decade hold.
- At projected returns (-3.0% appreciation + 3.0% rent growth), your $11k cash investment doubles in ~3 years — after that, you're playing with house money.
Negotiation context
- It's been on market 58 days — a 3% lower offer ($38k) is reasonable based on typical stale-listing flexibility.
Risks & watch-outs
- Watch-outs: built in 1951 — expect roof / HVAC / electrical / plumbing capex.
Questions for the listing agent
- It's been on market 58 days. Have you received any prior offers? Is the seller open to a 3% concession, seller financing, or rate buy-down credit?
- Have any recent inspections been done? Can we get a copy of the seller's disclosures and any deferred-maintenance estimates?
- Built in 1951 — when were the roof, HVAC, electrical panel, plumbing, and water heater last replaced?
- Is there a deadline driving the sale (1031 exchange, divorce, estate, relocation)? That informs how much negotiation room exists.
- Schools are D-rated, which usually means shorter tenancies and higher turnover. Who's the typical renter profile here, and what's been the actual vacancy rate?
- Crime grade is F in this area — have there been break-ins, vandalism, or insurance claims at this property in the last 3 years? What carrier currently insures it and at what premium?
- What's the average days-on-market for RENTAL listings here right now (not sales)? A rising rental-DOM trend means longer vacancies and softer asking-rent achievability than the comps imply.
- What's the recent tenant-quality profile in this submarket — average credit score on applications, eviction rate, late-payment / NSF rate, and stable-employment percentage? A property-management company in the area should have these aggregated.
- How much new for-sale + rental construction is in the pipeline within 1–3 miles? Heavy new supply typically softens prices + rents 12–24 months out; constrained supply supports both.
Investment metrics
- 1% rule
- 2.37% ✓
- Cap rate
- 21.09%
- Cash-on-cash
- 52.84%
- DSCR
- 3.35
- GRM
- 3.5
CMA / ARV
- ARV (median comp)
- $122,083
- List price
- $39,000
- Delta
- -68.05%
- Verdict
- UNDERPRICED
- Comps
- 20 within 1.0 mi
Show comp detail 2 sales within ~0.75 mi
| Address | Dist | Beds/Ba | Sqft | Sold | Price | $/sf | Match |
|---|---|---|---|---|---|---|---|
| 609 5th St | 0.61mi | 1/1.0 (-1) | 955 (-5%) | 21mo | $66,000 | $69 | 40 |
| 409 Nickell St | 0.65mi | 1/1.0 (-1) | 1,092 (+8%) | 22mo | $102,000 | $93 | 33 |
Match score weights: distance 35% · size 25% · config 20% · recency 20%. Top-matched comps best support the ARV.
Projected returns pro-forma
-3.0% appreciation · 3.0% rent growth · sell at horizon
- IRR
- 50.9%
- Equity multiple
- 3.23×
- Total profit
- $24,305
- Equity at exit
- $5,815
- IRR
- 56.2%
- Equity multiple
- 6.55×
- Total profit
- $60,603
- Equity at exit
- $3,372
Cash invested: $10,920 (down + closing). Projections, not guarantees.
Landlord ↔ Tenant lean methodology
- Overall (STATE)
- 92 Strongly Landlord-Friendly
- State Arkansas
- 92 Strongly Landlord-Friendly · R+14
- County
- — inherits STATE
- City
- — inherits STATE
ZIP-level market 72949
- Home prices YoY
- -14.4%
- Active inventory
- 82
- Price-to-rent
- 3.5×
Monthly cashflow live
- Estimated rent
- $924 medium interval (Pro) →
- Mortgage (P&I)
- −$205
- Tax from tax record
- −$28 /mo · $341/yr
- Insurance
- −$16
- HOA
- −$0
- Vacancy / Maint / Mgmt
- −$194
- Net cashflow
- $481
Break-even live
Sensitivity live
| Price | -10% $503 | -5% $492 | +0% $481 | +5% $470 | +10% $459 |
|---|---|---|---|---|---|
| Rent | -10% $408 | -5% $444 | +0% $481 | +5% $517 | +10% $554 |
| Rate | -1.0pp $500 | -0.5pp $491 | base $481 | +0.5pp $471 | +1.0pp $460 |
UW: 25.0% down · 7.5% · 30yr · 1.5% tax · 5.0% vac · 8.0% maint · 8.0% mgmt
Financing live
Cash to close
- Down payment
- $9,750
- Closing costs
- $1,170
- Reserves months
- —
- Total cash needed
- —
Loan-product check · same deal, 3 products live
Conventional
25% down · 7.5% · 30yr
- Down + closing
- —
- Monthly P&I
- —
- Monthly cashflow
- —
- DSCR
- —
- Eligible?
- —
Personal DTI + credit; lowest rate.
DSCR
20% down · 8.5% · 30yr
- Down + closing
- —
- Monthly P&I
- —
- Monthly cashflow
- —
- DSCR
- —
- Eligible?
- —
No personal income docs; deal must DSCR.
Hard money
10% down · 12.0% · 12mo
- Down + closing
- —
- Monthly P&I
- —
- Monthly cashflow
- —
- DSCR
- —
- Eligible?
- —
Short-term bridge; refi at stabilization.
Listing history 18 events
-
2026-06-21days on market $39,000 Active 58 DOM
-
2026-06-18days on market $39,000 Active 55 DOM
-
2026-06-17days on market $39,000 Active 54 DOM
-
2026-06-16days on market $39,000 Active 53 DOM
-
2026-06-15days on market $39,000 Active 52 DOM
-
2026-06-14days on market $39,000 Active 50 DOM
-
2026-06-10days on market $39,000 Active 47 DOM
-
2026-06-09days on market $39,000 Active 46 DOM
-
2026-06-08days on market $39,000 Active 45 DOM
-
2026-06-07days on market $39,000 Active 44 DOM
-
2026-06-05days on market $39,000 Active 41 DOM
-
2026-06-03days on market $39,000 Active 40 DOM
-
2026-06-02days on market $39,000 Active 39 DOM
-
2026-06-01days on market $39,000 Active 38 DOM
-
2026-05-31days on market $39,000 Active 37 DOM
-
2026-05-31days on market $39,000 Active 36 DOM
-
2026-05-06price $39,000 397-char remark
-
2026-04-24$45,000 Active 397-char remark
ⓘ Source: listings_history table (triggers on properties + properties_extension) + one-shot
backfill from property_details.listing_events for pre-trigger history.
Tax reassessment forecast AR · Resets to sale price
- Current annual tax
- $341 · $28/mo
- Projected year-2 tax
- $341 · $28/mo
- Expected delta
- $0/yr ($0/mo · 0.0%)
ⓘ Screening estimate from a state-policy table — verify with the county assessor before closing.
Nearby sold comps map
Loading sold comps map…
Walkable amenities ~0.75 mi
Loading nearby amenities…
Taxation est. · year 1
- Rental income
- $11,089
- − Mortgage interest
- −$2,185
- − Property taxes
- −$341
- − Insurance
- −$195
- − Repairs & maintenance
- −$887
- − Management
- −$887
- − Depreciation
- −$1,135
- Taxable income
- $5,459
- Est. tax owed @ 24.0%
- −$1,310
- After-tax cash flow
- $4,460/yr
For passive investors: Depreciation is non-cash, so a rental often shows a tax loss while cash-flowing — sheltering income. Rental losses are passive: they offset passive income freely, and up to $25,000/yr can offset ordinary (W-2) income if you actively participate and your MAGI is under $100k (phasing out to $0 by $150k); unused losses carry forward. On sale, claimed depreciation is recaptured at up to 25%, and gains may owe capital-gains tax (a 1031 exchange can defer both). Figures are a year-1 estimate at your 24.0% rate — not tax advice; consult a CPA.
Condition & rehab AI · 11 photos
This property requires extensive renovation and repairs, including kitchen and bathroom updates, exterior repairs, and HVAC system replacement. The property has significant potential for increased value with these improvements.
Repairs flagged
- Major kitchen cabinets — severely damaged
- Major kitchen countertops — severely worn
- Major kitchen appliances — outdated and non-functional
- Major bathroom walls — damaged and peeling
- Major bathroom fixtures — missing
- Major exterior siding — damaged
- Major exterior windows — damaged frames
- Major HVAC system — visible damage
- Major foundation — visible structural damage
Value-add opportunities
- Resale kitchen renovation — modern kitchen will attract buyers
- Resale bathroom renovation — modern bathroom will attract buyers
- Both exterior landscaping — improved curb appeal and increased property value
- Both HVAC system replacement — modern HVAC system will improve comfort and energy efficiency
Renovation cost estimate screening
| Repair item | Severity | Est. cost |
|---|---|---|
| kitchen cabinets · severely damaged | Major | $15,000–50,000 |
| kitchen countertops · severely worn | Major | $15,000–50,000 |
| kitchen appliances · outdated and non-functional | Major | $15,000–50,000 |
| bathroom walls · damaged and peeling | Major | $15,000–50,000 |
| bathroom fixtures · missing | Major | $15,000–50,000 |
| exterior siding · damaged | Major | $15,000–50,000 |
| exterior windows · damaged frames | Major | $15,000–50,000 |
| HVAC system · visible damage | Major | $15,000–50,000 |
| foundation · visible structural damage | Major | $15,000–50,000 |
| Total estimated repair cost · 9 items | $135,000–450,000 |
Value-add ROI direction
- Resale kitchen renovation — modern kitchen will attract buyers ↑
- Resale bathroom renovation — modern bathroom will attract buyers ↑
- Both exterior landscaping — improved curb appeal and increased property value ↑
- Both HVAC system replacement — modern HVAC system will improve comfort and energy efficiency ↑
ⓘ Cost ranges are severity-bucket heuristics (US national rule-of-thumb). Get contractor quotes + a written scope before underwriting a rehab budget.
Schools (NCES district)
- District
- Ozark School District
- NCES district ID
- 0511010
- Math proficiency
- 41% ▼ -9.00%
- Reading proficiency
- 38% ▼ -8.00%
- Median HH income
- $33,306
- Composite
- 32.5/100
- National rank
- #5703
- State rank
- #80 of 238 in AR
Livability — Ozark
- Score
- 60/100
- State rank
- #258
- US rank
- #18601
Category grades
Schools grade is shown separately in the Schools card above.
Census & demographics
- Census place
- Ozark, AR
- Population (ZIP)
- 9,474
Population outlook (Franklin County) Hauer SSP2
- Today (2025)
- 16,946 people
- By 2030
- 16,403 · -3.2%
- By 2040
- 15,303 · -9.7%
- By 2050
- 14,243 · -16.0%
- By 2075
- 12,136 · -28.4%
- By 2100
- 10,443 · -38.4%
Race, ethnicity, and origin ACS 2023
- Neighborhood character
- Predominantly White (87%)
- Race & ethnicity
- White 87% Two or more races 11% Hispanic / Latino 3%
- Common ancestry
- Lithuanian 1% Serbian 1% Portuguese 1%
- Foreign-born
- 0%
- Languages at home
- 98% English-only · Other Indo-European 1% Spanish 1% German/W. Germanic 1%
Political lean MEDSL · Franklin
- 2024 margin
- Solid R (+62.4) · D 17.7% · R 80.1% · Other 2.2%
- 2008→2024 swing
- -23.1pp toward R · 2008: -39.3pp · 2024: -62.4pp
- All cycles
- 2024: R+62.4 2020: R+61.4 2016: R+54.6 2012: R+44.4 2008: R+39.3
Not yet ingested
- Civics
- —
Market trends
- HPI YoY
- ▼ -30.41%
- Current HPI
- 180.3194
- Rent YoY
- —
- Metro
- —
- State GDP YoY
- ▲ 3.80%
- F500 in state
- 10
Industry mix (Fortune 500 HQ in AR)
| Industry | F500 HQs | Revenue |
|---|---|---|
| Retail | 1 | $681B |
|
||
| Food / Agriculture | 1 | $53B |
|
||
| Retail / Energy | 1 | $22B |
|
||
| Transportation / Logistics | 1 | $12B |
|
||
| Energy | 1 | $4B |
|
||
Price history
-13.3% since first listed2 events — show timeline
- 2026-05-06 Price Changed $39,000 WRVBOR
- 2026-04-24 Listed $45,000 WRVBOR
Property tax history
+0.1%/yrLatest (2025): $341 · +0.0% YoY. Source: county tax records.
Cash-flow waterfall
monthlySold comps — $/sqft
last 12 mo · ≤1 miLoading sold comps…