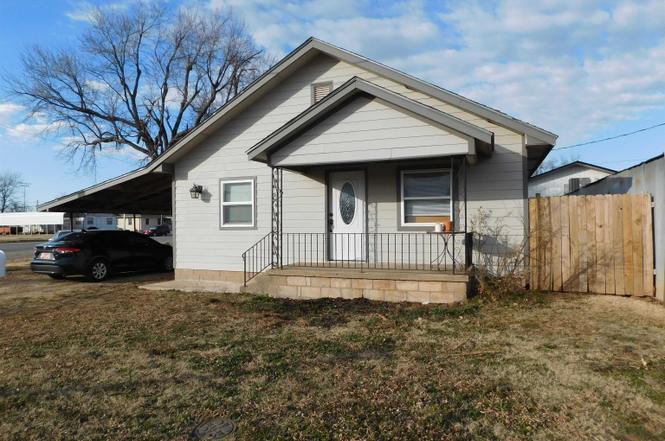
104 E Garber Rd · Garber, OK
Flood risk 1/10 · Minimal
- FEMA flood zone
- X (unshaded)
- Chance of flooding over 30 yrs
- 0.0%
- Est. flood insurance / yr
- $507 – $1,088
Fire risk 1/10 · Minimal
- Est. fire insurance / yr
- $2,463 – $4,575
Heat risk 5/10 · Moderate
- Hot days now (above 108°F)
- 7 days/yr
- Hot days in 30 yrs
- 17 days/yr
Wind risk 2/10 · Minimal
- Chance of severe wind over 30 yrs
- 2.0%
Air-quality risk 2/10 · Minimal
- Unhealthy air days now
- 1 days/yr
- Unhealthy air days in 30 yrs
- 1 days/yr
Risk factors via First Street. Map © Google.
Why this score? — see what drove the C+ grade
The composite is a weighted blend of 9 inputs, each scored 0–100. Each bar is that input's sub-score; the figure is the points it added to the 100-point composite (weight × sub-score).
- Cash flow +21.0/30.0
- Appreciation +10.0/10.0
- ARV discount +7.5/15.0
- DSCR +6.7/10.0
- 1% rule +4.3/10.0
- Livability +3.2/5.0
- Schools +2.8/10.0
- Rent growth +2.5/5.0
- Condition / age +2.5/5.0
$106,000
🖨 Deal sheet 📄 Offer letter ✓ Due diligence
Listing remarks MLS
From top to bottom, this house has been completely remodeled. Sits just across from Garber schools on a big corner lot. From the granite countertops and new cabinets to the windows and updated exterior, this house is ready for move-in day.
Key facts
- Open floor plan
- Vinyl flooring
- Abundance of storage
Tags
Property features AI
Exterior
- Parking: Detached garage with 1 garage space
- Utilities: Public water; Public sewer
- Home design: Single-family residence; Single-story
- Construction: Wood siding
- Exterior features: Wood fencing; Composition roof; Lot approximately 50 x 75; Residential zoning
Interior
- Kitchen: Disposal; Refrigerator
- Flooring: Ceramic tile; Laminate; Tile
- Bathrooms: 2 full bathrooms
- Heating & cooling: Central heating (natural gas); Central air; Ceiling fans
- Interior features: Storm windows; Window coverings; Disposal; Refrigerator
Neighborhood map
What this means for you Summary
Snapshot
- This is a 2-bed/1.0-bath single-family listed at $106k.
Deal economics
- At list price, monthly cash flow is $150 ($2k/yr) — positive.
- The deal already cash-flows at list — no discount required.
- To meet the 1% rule (rent ≥ 1% of price), the offer needs to be $98k (7.4% below list).
- Recommended offer: $93k (12.0% below list) — sets the bar for market timing.
Location & tenants
- Location reads 64/100 on livability (#187 in OK) — a middle-class / working-renter tenant base. Strengths: cost of living A+, housing A+; Watch: schools D, amenities F, commute F.
- Garber (rural): math 33% / reading 30% proficiency, ranked #51 of 270 in OK (top 19%) — families likely to look elsewhere, expect single-tenant / working-renter base with shorter leases.
- Market conditions: 7 active listings in the ZIP; 19 units permitted in Garfield County in 2024 (0 in 5+ unit buildings).
Forward outlook
- In year one you build about $11k of equity ($733 loan paydown + $11k appreciation (10.0% local appreciation)).
- Garfield County population projected at +27% by 2050 — long-run rental-demand tailwind backs the buy-and-hold thesis.
- At projected returns (10.0% appreciation + 3.0% rent growth), your $30k cash investment doubles in ~3 years — after that, you're playing with house money.
- By year 4, paydown + projected appreciation supports a ~$40k cash-out refi (75% LTV) — recoverable capital for the next deal without selling this one.
Negotiation context
- It's been on market 151 days — a 12% lower offer ($93k) is reasonable based on typical stale-listing flexibility.
- 2 sale attempts since 5y ago; this cycle's ask has dropped $9k (8%) from the opening price — seller is motivated, your offer sets the floor, not the list.
Risks & watch-outs
- Watch-outs: built in 1924 — expect roof / HVAC / electrical / plumbing capex.
- Climate carrying-cost: extreme-heat days projected 7→17/yr by 2055 (HVAC capex compounding) — expect insurance premiums to compound above CPI over the hold.
Questions for the listing agent
- It's been on market 151 days. Have you received any prior offers? Is the seller open to a 12% concession, seller financing, or rate buy-down credit?
- Built in 1924 — when were the roof, HVAC, electrical panel, plumbing, and water heater last replaced?
- Why hasn't it sold? Are there any deal-killer items the seller is aware of (foundation, flood, title, zoning, code violations)?
- Is there a deadline driving the sale (1031 exchange, divorce, estate, relocation)? That informs how much negotiation room exists.
- Schools are D-rated, which usually means shorter tenancies and higher turnover. Who's the typical renter profile here, and what's been the actual vacancy rate?
- What's the average days-on-market for RENTAL listings here right now (not sales)? A rising rental-DOM trend means longer vacancies and softer asking-rent achievability than the comps imply.
- What's the recent tenant-quality profile in this submarket — average credit score on applications, eviction rate, late-payment / NSF rate, and stable-employment percentage? A property-management company in the area should have these aggregated.
- How much new for-sale + rental construction is in the pipeline within 1–3 miles? Heavy new supply typically softens prices + rents 12–24 months out; constrained supply supports both.
Investment metrics
- 1% rule
- 0.93% ✗
- Cap rate
- 7.99%
- Cash-on-cash
- 6.06%
- DSCR
- 1.27
- GRM
- 9.0
CMA / ARV
- ARV (on-the-fly)
- $66,360
- Comps found
- 4
Show comp detail 4 sales within ~0.75 mi
| Address | Dist | Beds/Ba | Sqft | Sold | Price | $/sf | Match |
|---|---|---|---|---|---|---|---|
| 122 E Choctaw St | 0.11mi | 2/1.0 | 956 (-14%) | 1mo | $74,500 | $78 | 71 |
| 519 W Cherokee | 0.40mi | 2/1.0 | 1,092 (-1%) | 11mo | $65,000 | $60 | 70 |
| 118 W Ponca St | 0.19mi | 3/1.0 (+1) | 1,232 (+11%) | 3mo | $41,900 | $34 | 64 |
| 421 W Ponca St | 0.33mi | 2/1.0 | 1,222 (+10%) | 22mo | $25,000 | $20 | 49 |
Match score weights: distance 35% · size 25% · config 20% · recency 20%. Top-matched comps best support the ARV.
Projected returns pro-forma
10.0% appreciation · 3.0% rent growth · sell at horizon
- IRR
- 28.7%
- Equity multiple
- 3.27×
- Total profit
- $67,228
- Equity at exit
- $95,493
- IRR
- 24.9%
- Equity multiple
- 7.41×
- Total profit
- $190,366
- Equity at exit
- $205,935
Cash invested: $29,680 (down + closing). Projections, not guarantees.
Landlord ↔ Tenant lean methodology
- Overall (STATE)
- 83 Strongly Landlord-Friendly
- State Oklahoma
- 83 Strongly Landlord-Friendly · R+20
- County
- — inherits STATE
- City
- — inherits STATE
ZIP-level market 73738
- Home prices YoY
- 6.0%
- Active inventory
- 7
- Price-to-rent
- 9.0×
Monthly cashflow live
- Estimated rent
- $982 medium interval (Pro) →
- Mortgage (P&I)
- −$556
- Tax from tax record
- −$26 /mo · $310/yr
- Insurance
- −$44
- HOA
- −$0
- Vacancy / Maint / Mgmt
- −$206
- Net cashflow
- $150
Break-even live
UW: 25.0% down · 7.5% · 30yr · 1.5% tax · 5.0% vac · 8.0% maint · 8.0% mgmt
Financing live
Cash to close
- Down payment
- $26,500
- Closing costs
- $3,180
- Reserves months
- —
- Total cash needed
- —
Loan-product check · same deal, 3 products live
Conventional
25% down · 7.5% · 30yr
- Down + closing
- —
- Monthly P&I
- —
- Monthly cashflow
- —
- DSCR
- —
- Eligible?
- —
Personal DTI + credit; lowest rate.
DSCR
20% down · 8.5% · 30yr
- Down + closing
- —
- Monthly P&I
- —
- Monthly cashflow
- —
- DSCR
- —
- Eligible?
- —
No personal income docs; deal must DSCR.
Hard money
10% down · 12.0% · 12mo
- Down + closing
- —
- Monthly P&I
- —
- Monthly cashflow
- —
- DSCR
- —
- Eligible?
- —
Short-term bridge; refi at stabilization.
Listing history 21 events
-
2026-06-19days on market $106,000 Active 151 DOM
-
2026-06-18days on market $106,000 Active 150 DOM
-
2026-06-17days on market $106,000 Active 149 DOM
-
2026-06-16days on market $106,000 Active 148 DOM
-
2026-06-15days on market $106,000 Active 147 DOM
-
2026-06-14days on market $106,000 Active 145 DOM
-
2026-06-12days on market $106,000 Active 144 DOM
-
2026-06-09days on market $106,000 Active 141 DOM
-
2026-06-08days on market $106,000 Active 140 DOM
-
2026-06-07days on market $106,000 Active 139 DOM
-
2026-06-05days on market $106,000 Active 136 DOM
-
2026-06-03days on market $106,000 Active 135 DOM
-
2026-06-02days on market $106,000 Active 134 DOM
-
2026-06-01days on market $106,000 Active 133 DOM
-
2026-05-31days on market $106,000 Active 132 DOM
-
2026-05-30days on market $106,000 Active 131 DOM
-
2026-03-27price $106,000
-
2026-03-12price $113,250
-
2026-01-20$115,000 Active
-
2021-11-12soldstatus $93,000 239-char remark
Show marketing remark (239 chars)
From top to bottom, this house has been completely remodeled. Sits just across from Garber schools on a big corner lot. From the granite countertops and new cabinets to the windows and updated exterior, this house is ready for move-in day.
-
2021-08-19$92,900 239-char remark
Show marketing remark (239 chars)
From top to bottom, this house has been completely remodeled. Sits just across from Garber schools on a big corner lot. From the granite countertops and new cabinets to the windows and updated exterior, this house is ready for move-in day.
ⓘ Source: listings_history table (triggers on properties + properties_extension) + one-shot
backfill from property_details.listing_events for pre-trigger history.
Tax reassessment forecast OK · Resets to sale price
- Current annual tax
- $310 · $26/mo
- Projected year-2 tax
- $954 · $79/mo
- Expected delta
- +$644/yr (+$54/mo · 207.7%)
ⓘ Screening estimate from a state-policy table — verify with the county assessor before closing.
Climate risk First Street
- Flood 1/10 Low FEMA zone X (unshaded) · 0% chance over 30 yrs
- Wildfire 1/10 Low
- Heat 5/10 Major 7 d/yr ≥108°F today · 17 d/yr by 30 yrs out
- Wind 2/10 Low 2% chance of damaging wind over 30 yrs
- Air quality 2/10 Low 1 unhealthy d/yr today · 1 by 30 yrs out
Nearby sold comps map
Loading sold comps map…
Walkable amenities ~0.75 mi
Loading nearby amenities…
Taxation est. · year 1
- Rental income
- $11,784
- − Mortgage interest
- −$5,938
- − Property taxes
- −$310
- − Insurance
- −$530
- − Repairs & maintenance
- −$943
- − Management
- −$943
- − Depreciation
- −$3,084
- Taxable income
- $37
- Est. tax owed @ 24.0%
- −$9
- After-tax cash flow
- $1,790/yr
For passive investors: Depreciation is non-cash, so a rental often shows a tax loss while cash-flowing — sheltering income. Rental losses are passive: they offset passive income freely, and up to $25,000/yr can offset ordinary (W-2) income if you actively participate and your MAGI is under $100k (phasing out to $0 by $150k); unused losses carry forward. On sale, claimed depreciation is recaptured at up to 25%, and gains may owe capital-gains tax (a 1031 exchange can defer both). Figures are a year-1 estimate at your 24.0% rate — not tax advice; consult a CPA.
Schools (NCES district)
- District
- Garber
- NCES district ID
- 4012420
- Math proficiency
- 33% ▼ -7.00%
- Reading proficiency
- 30% ▼ -10.00%
- Median HH income
- $50,538
- Composite
- 27.52/100
- National rank
- #6953
- State rank
- #51 of 270 in OK
Livability — Garber
- Score
- 64/100
- State rank
- #187
- US rank
- #14751
Category grades
Schools grade is shown separately in the Schools card above.
Census & demographics
- Census place
- Garber, OK
- Population (ZIP)
- 931
Population outlook (Garfield County) Hauer SSP2
- Today (2025)
- 69,026 people
- By 2030
- 72,171 · +4.6%
- By 2040
- 79,366 · +15.0%
- By 2050
- 87,847 · +27.3%
- By 2075
- 112,714 · +63.3%
- By 2100
- 135,682 · +96.6%
Race, ethnicity, and origin ACS 2023
- Neighborhood character
- Predominantly White (81%)
- Race & ethnicity
- White 81% Two or more races 15% Hispanic / Latino 3% Black 2%
- Common ancestry
- Slovak 9% Italian 5% Lithuanian 4%
- Foreign-born
- 1% · Canada
- Languages at home
- 98% English-only · Spanish 1% Russian/Polish/Slavic 1% French/Haitian/Cajun 1%
Political lean MEDSL · Garfield
- 2024 margin
- Solid R (+53.8) · D 22.2% · R 76.0% · Other 1.8%
- 2008→2024 swing
- -2.8pp toward R · 2008: -51.0pp · 2024: -53.8pp
- All cycles
- 2024: R+53.8 2020: R+53.7 2016: R+53.5 2012: R+52.5 2008: R+51.0
Not yet ingested
- Civics
- —
Market trends
- HPI YoY
- ▲ 12.24%
- Current HPI
- 215.474
- Rent YoY
- —
- Metro
- —
- State GDP YoY
- ▲ 1.55%
- F500 in state
- 6
Industry mix (Fortune 500 HQ in OK)
| Industry | F500 HQs | Revenue |
|---|---|---|
| Energy | 3 | $48B |
|
||
Price history
+14.1% since first listed5 events — show timeline
- 2026-03-27 Price Changed $106,000 NWOAR
- 2026-03-12 Price Changed $113,250 NWOAR
- 2026-01-20 Listed $115,000 NWOAR
- 2021-11-12 Sold (MLS) $93,000 NWOAR
- 2021-08-19 Listed $92,900 NWOAR
Property tax history
+4.8%/yrLatest (2025): $310 · +2.0% YoY. Source: county tax records.
Cash-flow waterfall
monthlySold comps — $/sqft
last 12 mo · ≤1 miLoading sold comps…