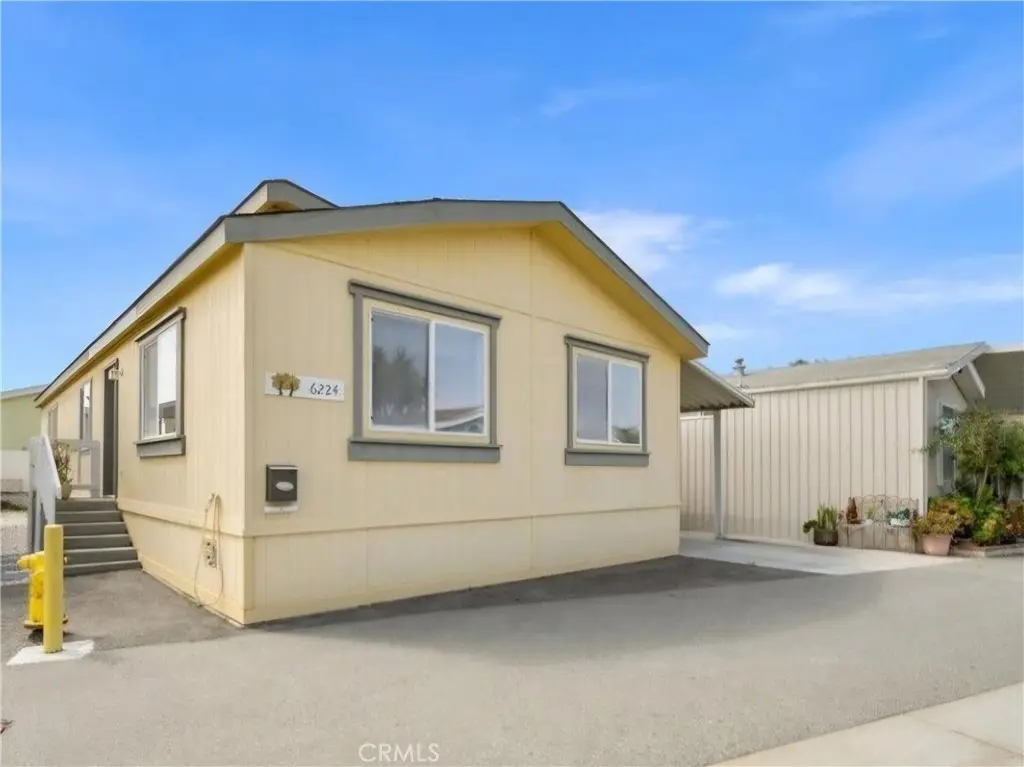
6224 Beachcomber Dr · Long Beach, CA
Flood risk 9/10 · Severe
- FEMA flood zone
- X
- Chance of flooding over 30 yrs
- 0.99%
- Est. flood insurance / yr
- $507 – $1,088
Fire risk 1/10 · Minimal
- Est. fire insurance / yr
- $659 – $1,223
Heat risk 4/10 · Minor
- Hot days now (above 86°F)
- 7 days/yr
- Hot days in 30 yrs
- 20 days/yr
Wind risk 1/10 · Minimal
- Chance of severe wind over 30 yrs
- —
Air-quality risk 5/10 · Moderate
- Unhealthy air days now
- 7 days/yr
- Unhealthy air days in 30 yrs
- 9 days/yr
Risk factors via First Street. Map © Google.
Why this score? — see what drove the B+ grade
The composite is a weighted blend of 9 inputs, each scored 0–100. Each bar is that input's sub-score; the figure is the points it added to the 100-point composite (weight × sub-score).
- Cash flow +30.0/30.0
- ARV discount +15.0/15.0
- 1% rule +10.0/10.0
- DSCR +10.0/10.0
- Condition / age +3.8/5.0
- Schools +3.7/10.0
- Livability +3.4/5.0
- Rent growth +2.9/5.0
- Appreciation +0.0/10.0
$199,000
🖨 Deal sheet (PDF) 📄 Offer letter ✓ Due diligence
Listing remarks MLS
Live like you are on vacation in this waterfront community. This is senior living at its finest. Incredible location with state-of-the-art amenities, this home has it all! The spacious living room offers an abundance of natural light and boasts a nice fireplace. Both bedrooms have en-suite bathrooms and large closets. Private laundry room conveniently located off the carport and opens to one of the bathrooms. Large and open kitchen with tons of counter space, a pantry and an eat in breakfast counter that flows into the dining room. Relax in the bright and airy Arizona room. New vinyl gate around the back of the property for additional privacy. The shed provides extra storage. Ideally located within the community, close to the fitness center, newly remodeled clubhouse, pool, resident library, firepit, walking trails and more. Enjoy walking along the Los Cerritos Channel with views of the Marina. Close to the coastal wetlands, golf course, beach, tons of shopping and restaurants and more. 24-hour guard gated security and easy access from either PCH or nearby freeways. This is one you won't want to miss!
Key facts
- Gated community
- Covered carport
- Spa
Tags
Property features AI
Finance
- Other: Total units on property: 1; Living area source: assessor's data; Parcel number recorded; Subdivision: Belmont Shore
- Financial info: Land lease: $1,650 (land lease)
- HOA & community: Senior community; Community dog park; Association amenities include pool and spa
Exterior
- Parking: Covered carport; One carport space (one parking space total); Has parking
- Security: Gated community with attendant and guard; Resident manager; Smoke detectors; Carbon monoxide detectors
- Utilities: Natural gas connected; Sewer connected (public sewer; soils analysis septic noted); Electricity connected (standard electric); Water connected (district/public); Cable available
- Home design: One story; Entry at level 1; Pier jack foundation
- Construction: Wood construction; Other roof type; Year built source: builder
- Exterior features: Manufactured house; Association in-ground heated spa (community); Association in-ground heated pool (community); Fenced yard in good condition with security fencing; 0–1 unit/acre lot feature; No shared/common walls
Interior
- Kitchen: Built-in range; Gas range and gas oven; Dishwasher
- Bedrooms: Primary bedroom; All bedrooms on main level
- Flooring: Carpet; Laminate
- Bathrooms: One full bathroom; One 3/4 bathroom; Two main-level bathrooms
- Heating & cooling: Central furnace; Cooling: see remarks
- Interior features: Ceramic counters; High ceilings (9 feet+); Ceiling fan; Cathedral/vaulted ceilings; Sliding glass doors; Panel doors; Blinds; Window screens; Turnkey condition; Low pile carpeting (accessibility feature)
- Laundry & utility: Inside laundry; Washer included; Dryer included; Washer hookup; Gas dryer hookup
Neighborhood map
What this means for you Summary
Snapshot
- This is a 3-bed/2.0-bath manufactured listed at $199k. Condition is rated good.
Deal economics
- At list price, monthly cash flow is $2k ($20k/yr) — positive.
- The deal already cash-flows at list — no discount required.
- Meets the 1% rule at list price ($4k rent vs $199k).
- Cap rate 16.8% vs local median 1.9% in Long Beach — top-decile yield for the area; either an underpriced asset or a hidden risk that comps aren't pricing in. Stress-test before assuming the spread holds.
Location & tenants
- Location reads 67/100 on livability (#319 in CA) — a middle-class / working-renter tenant base. Strengths: amenities A+, commute A+, employment B+; Watch: health & safety C-, crime F, cost of living F.
- Long Beach Unified (urban): math 34% / reading 50% proficiency, ranked #216 of 517 in CA (top 42%) — families likely to look elsewhere, expect single-tenant / working-renter base with shorter leases.
- Market conditions: Rents rising (+1.7%/yr); 135 active listings in the ZIP; 29 comparable units currently listed for rent nearby; rentals at typical pace (median 16d on market — plan ~3-4 weeks tenant-placement turnaround); high-income renter base; 19,697 units permitted in Los Angeles County in 2024 (9,426 in 5+ unit buildings).
- This rent runs 41% of the median local income ($115k/yr) — at the standard rent-burdened threshold; future hikes will face affordability resistance.
Forward outlook
- Local home prices are declining (-3.0%/yr); year-one equity from $1k of loan paydown is wiped out by about $6k of value loss. Plan a longer hold.
- Los Angeles County population projected at +9% by 2050 — modest demand growth; plan on rents tracking national, not racing it.
- At projected returns (-3.0% appreciation + 1.7% rent growth), your $56k cash investment doubles in ~4 years — after that, you're playing with house money.
Negotiation context
- Only 9 days on market — expect competitive offers; lowballing is unlikely to land.
- 4 sale attempts since 4y ago with the ask held roughly flat each time — persistent listings suggest the price (not the market) is what's stuck; bring a comps-based counter.
Risks & watch-outs
- Watch-outs: flood insurance adds $66/mo.
- Climate carrying-cost: severe flood risk — expect insurance premiums to compound above CPI over the hold.
Questions for the listing agent
- What's the actual annual flood-insurance premium (NFIP or private), and is the property in a SFHA with mandatory coverage?
- Is there a deadline driving the sale (1031 exchange, divorce, estate, relocation)? That informs how much negotiation room exists.
- Crime grade is F in this area — have there been break-ins, vandalism, or insurance claims at this property in the last 3 years? What carrier currently insures it and at what premium?
- What's the average days-on-market for RENTAL listings here right now (not sales)? A rising rental-DOM trend means longer vacancies and softer asking-rent achievability than the comps imply.
- What's the recent tenant-quality profile in this submarket — average credit score on applications, eviction rate, late-payment / NSF rate, and stable-employment percentage? A property-management company in the area should have these aggregated.
- How much new for-sale + rental construction is in the pipeline within 1–3 miles? Heavy new supply typically softens prices + rents 12–24 months out; constrained supply supports both.
Investment metrics
- 1% rule
- 1.98% ✓
- Cap rate
- 16.77%
- Cash-on-cash
- 37.40%
- DSCR
- 2.66
- GRM
- 4.2
CMA / ARV
- ARV (on-the-fly)
- $250,488
- Comps found
- 12
Show comp detail 12 sales within ~0.75 mi
| Address | Dist | Beds/Ba | Sqft | Sold | Price | $/sf | Match |
|---|---|---|---|---|---|---|---|
| 304 N Jade Cove Dr #64 | 0.04mi | 3/2.0 | 1,392 (+9%) | 0mo | $252,500 | $181 | 83 |
| 6217 E Golden Sands #336 | 0.03mi | 2/2.0 (-1) | 1,200 (-6%) | 6mo | $160,000 | $133 | 78 |
| 6254 Beachcomber | 0.17mi | 2/2.0 (-1) | 1,267 (-1%) | 9mo | $244,900 | $193 | 78 |
| 6255 E Marina View Dr #148 | 0.14mi | 2/2.0 (-1) | 1,248 (-2%) | 8mo | $328,000 | $263 | 78 |
| 6275 E Emerald Cove Dr #283 | 0.19mi | 3/2.0 | 1,344 (+5%) | 8mo | $325,000 | $242 | 76 |
| 6231 Emerald Cv | 0.05mi | 2/2.0 (-1) | 1,200 (-6%) | 12mo | $245,000 | $204 | 72 |
| 6219 E Sea Breeze Dr #10 | 0.09mi | 2/2.0 (-1) | 1,200 (-6%) | 11mo | $150,000 | $125 | 71 |
| 302 Sandpiper #283 | 0.07mi | 2/2.0 (-1) | 1,140 (-11%) | 5mo | $135,000 | $118 | 70 |
| 6296 E Marina View Dr | 0.28mi | 2/2.0 (-1) | 1,344 (+5%) | 4mo | $325,000 | $242 | 70 |
| 6223 E Sea Breeze Dr #12 | 0.10mi | 2/2.0 (-1) | 1,400 (+10%) | 11mo | $175,000 | $125 | 65 |
| 6245 E Marina View Dr #240 | 0.11mi | 2/2.0 (-1) | 1,100 (-14%) | 9mo | $350,000 | $318 | 59 |
| 6267 Driftwood Dr #310 | 0.21mi | 2/2.0 (-1) | 1,120 (-12%) | 11mo | $219,000 | $196 | 56 |
Match score weights: distance 35% · size 25% · config 20% · recency 20%. Top-matched comps best support the ARV.
Projected returns pro-forma
-3.0% appreciation · 1.68% rent growth · sell at horizon
- IRR
- 30.2%
- Equity multiple
- 2.24×
- Total profit
- $69,065
- Equity at exit
- $29,672
- IRR
- 36.7%
- Equity multiple
- 4.17×
- Total profit
- $176,888
- Equity at exit
- $17,206
Cash invested: $55,720 (down + closing). Projections, not guarantees.
Landlord ↔ Tenant lean methodology
- Overall (STATE)
- 18 Strongly Tenant-Friendly
- State California
- 18 Strongly Tenant-Friendly · D+13
- County
- — inherits STATE
- City
- — inherits STATE
ZIP-level market 90803
- Rents YoY
- 1.7%
- Active inventory
- 135
- Price-to-rent
- 4.2×
Monthly cashflow live
- Estimated rent
- $3,939 high interval (Pro) →
- Mortgage (P&I)
- −$1,044
- Tax est. 1.5%
- −$249 /mo · $2,985/yr
- Insurance
- −$83
- Flood insurance flood zone
- −$66 /mo · $798/yr
- HOA
- −$0
- Vacancy / Maint / Mgmt
- −$827
- Net cashflow
- $1,670
Break-even live
Sensitivity live
| Price | -10% $1,808 | -5% $1,739 | +0% $1,670 | +5% $1,601 | +10% $1,533 |
|---|---|---|---|---|---|
| Rent | -10% $1,359 | -5% $1,515 | +0% $1,670 | +5% $1,826 | +10% $1,981 |
| Rate | -1.0pp $1,770 | -0.5pp $1,721 | base $1,670 | +0.5pp $1,619 | +1.0pp $1,566 |
UW: 25.0% down · 7.5% · 30yr · 1.5% tax · 5.0% vac · 8.0% maint · 8.0% mgmt
Financing live
Cash to close
- Down payment
- $49,750
- Closing costs
- $5,970
- Reserves months
- —
- Total cash needed
- —
Loan-product check · same deal, 3 products live
Conventional
25% down · 7.5% · 30yr
- Down + closing
- —
- Monthly P&I
- —
- Monthly cashflow
- —
- DSCR
- —
- Eligible?
- —
Personal DTI + credit; lowest rate.
DSCR
20% down · 8.5% · 30yr
- Down + closing
- —
- Monthly P&I
- —
- Monthly cashflow
- —
- DSCR
- —
- Eligible?
- —
No personal income docs; deal must DSCR.
Hard money
10% down · 12.0% · 12mo
- Down + closing
- —
- Monthly P&I
- —
- Monthly cashflow
- —
- DSCR
- —
- Eligible?
- —
Short-term bridge; refi at stabilization.
Rent comps 29 comps
| Address | Beds | Baths | Sqft | Rent | $/sqft | DOM | Units | Dist |
|---|---|---|---|---|---|---|---|---|
| 5980 Bixby Village Dr Long Beach, CA | 1.0–2.0 | 1.0–2.0 | 749 | $3,607 | $4.82 | 2d | 20 | 0.35mi |
| 6300 E Colorado St Unit A Long Beach, CA | 2.0 | 2.0 | 924 | $4,000 | $4.33 | 44d | 1 | 0.45mi |
| 451 Medford Ct #102 Long Beach, CA | 3.0 | 3.0 | 1806 | $5,400 | $2.99 | 11d | 1 | 0.46mi |
| 5926 Bixby Village Dr Long Beach, CA | 1.0–2.0 | 1.0–2.0 | 875 | $3,846 | $4.40 | 3d | 17 | 0.49mi |
| 7217 Marina Pacifica Dr S Long Beach, CA | 2.0 | 3.0 | 1500 | $5,100 | $3.40 | 44d | 1 | 0.55mi |
| 576 N Bellflower Blvd Long Beach, CA | 1.0–2.0 | 1.0–2.0 | 860 | $3,195 | $3.71 | 11d | 1 | 0.58mi |
| 6268 Riviera Cir Long Beach, CA | 3.0 | 2.0 | 1845 | $4,400 | $2.38 | 19d | 1 | 0.58mi |
| 777 N Bellflower Blvd Unit 118 Long Beach, CA | 2.0 | 2.0 | 890 | $2,300 | $2.58 | 44d | 1 | 0.83mi |
| 777 N Bellflower Blvd Long Beach, CA | 1.0–2.0 | 1.0–2.0 | 752 | $2,300 | $3.06 | 17d | 2 | 0.83mi |
| 5585 E Pacific Coast Hwy Long Beach, CA | 1.0–2.0 | 1.0–2.0 | 756 | $2,850 | $3.77 | 25d | 2 | 0.87mi |
| 5585 E Pacific Coast Hwy Long Beach, CA | 2.0 | 2.0 | 913 | $2,850 | $3.12 | 6d | 1 | 0.87mi |
| 1025 Palo Verde Ave Long Beach, CA | 1.0–2.0 | 1.0–2.5 | 1326 | $4,808 | $3.62 | 0d | 3 | 1.00mi |
| 270 La Verne Ave Unit A Long Beach, CA | 3.0 | 1.0 | 1150 | $3,200 | $2.78 | 44d | 1 | 1.06mi |
| 5343 E The Toledo Unit 5345 Long Beach, CA | 3.0 | 1.0 | 1300 | $3,495 | $2.69 | 20d | 1 | 1.09mi |
| 5400 E The Toledo #410 Long Beach, CA | 2.0 | 2.0 | 1118 | $4,200 | $3.76 | 44d | 1 | 1.13mi |
| 333 1st St Seal Beach, CA | 2.0 | 1.0–2.0 | 717 | $3,710 | $5.17 | 0d | 1 | 1.26mi |
| 7084 Island Village Dr Long Beach, CA | 3.0 | 2.0 | 1227 | $4,263 | $3.47 | 19d | 1 | 1.26mi |
| 7148 Island Village Dr Long Beach, CA | 4.0 | 3.0 | 1810 | $5,000 | $2.76 | 4d | 1 | 1.31mi |
| 5401 E Anaheim Rd Unit 205 Long Beach, CA | 2.0 | 2.0 | 875 | $2,795 | $3.19 | 44d | 1 | 1.34mi |
| 5401 E Anaheim Rd Unit 211 Long Beach, CA | 2.0 | 2.0 | 875 | $2,895 | $3.31 | 20d | 1 | 1.34mi |
| 45 65th Pl Long Beach, CA | 3.0 | 2.0 | 1100 | $4,800 | $4.36 | 0d | 1 | 1.40mi |
| 6817 E Bacarro St Long Beach, CA | 3.0 | 2.0 | 1234 | $5,000 | $4.05 | 11d | 1 | 1.42mi |
| 6713 E Ocean Blvd Long Beach, CA | 3.0 | 3.0 | 1500 | $6,495 | $4.33 | 16d | 1 | 1.43mi |
| 6117 E Seaside Walk Long Beach, CA | 2.0 | 2.0 | 1240 | $6,500 | $5.24 | 0d | 1 | 1.43mi |
| 6229 E Seaside Walk Apt A Long Beach, CA | 3.0 | 2.0 | 1400 | $4,695 | $3.35 | 44d | 1 | 1.44mi |
| 6821 E Ocean Blvd Long Beach, CA | 3.0 | 4.0 | 1766 | $6,250 | $3.54 | 0d | 1 | 1.45mi |
| 5286 E Las Lomas St Unit 5286 Las Lomas Long Beach, CA | 2.0 | 1.0 | 1140 | $2,895 | $2.54 | 44d | 1 | 1.47mi |
| 6481 E El Roble St Unit 6481 A Long Beach, CA | 4.0 | 4.0 | 998 | $5,195 | $5.21 | 0d | 1 | 1.48mi |
| 510 Roycroft Ave Long Beach, CA | 3.0 | 1.0 | 1050 | $2,795 | $2.66 | 13d | 1 | 1.50mi |
Listing history 8 events
-
2026-06-18days on market $199,000 Active 9 DOM
-
2026-06-17days on market $199,000 Active 8 DOM
-
2026-06-16days on market $199,000 Active 7 DOM
-
2026-06-15days on market $199,000 Active 6 DOM
-
2026-06-13days on market $199,000 Active 4 DOM
-
2026-06-13days on market $199,000 Active 3 DOM
-
2026-06-10remarks 494-char remark
-
2026-06-10$199,000 Active 1 DOM
ⓘ Source: listings_history table (triggers on properties + properties_extension) + one-shot
backfill from property_details.listing_events for pre-trigger history.
Climate risk First Street
- Flood 9/10 Extreme FEMA zone X · 99% chance over 30 yrs
- Wildfire 1/10 Low
- Heat 4/10 Moderate 7 d/yr ≥86°F today · 20 d/yr by 30 yrs out
- Wind 1/10 Low
- Air quality 5/10 Major 7 unhealthy d/yr today · 9 by 30 yrs out
Nearby sold comps map
Loading sold comps map…
Walkable amenities ~0.75 mi
Loading nearby amenities…
Taxation est. · year 1
- Rental income
- $47,269
- − Mortgage interest
- −$11,147
- − Property taxes
- −$2,985
- − Insurance
- −$1,792
- − Repairs & maintenance
- −$3,782
- − Management
- −$3,782
- − Depreciation
- −$5,789
- Taxable income
- $17,992
- Est. tax owed @ 24.0%
- −$4,318
- After-tax cash flow
- $15,724/yr
For passive investors: Depreciation is non-cash, so a rental often shows a tax loss while cash-flowing — sheltering income. Rental losses are passive: they offset passive income freely, and up to $25,000/yr can offset ordinary (W-2) income if you actively participate and your MAGI is under $100k (phasing out to $0 by $150k); unused losses carry forward. On sale, claimed depreciation is recaptured at up to 25%, and gains may owe capital-gains tax (a 1031 exchange can defer both). Figures are a year-1 estimate at your 24.0% rate — not tax advice; consult a CPA.
Condition & rehab AI · 12 photos
This move-in ready manufactured home in a gated community offers a good condition with minor cosmetic updates to enhance its resale and rental value.
Value-add opportunities
- Resale update kitchen appliances — modern appliances enhance appeal
- Resale update flooring — new flooring would enhance appeal
- Resale update exterior paint — new paint would enhance curb appeal
- Both landscaping — improved landscaping would enhance curb appeal and rental value
Renovation cost estimate screening
Value-add ROI direction
- Resale update kitchen appliances — modern appliances enhance appeal ↑
- Resale update flooring — new flooring would enhance appeal ↑
- Resale update exterior paint — new paint would enhance curb appeal ↑
- Both landscaping — improved landscaping would enhance curb appeal and rental value ↑
ⓘ Cost ranges are severity-bucket heuristics (US national rule-of-thumb). Get contractor quotes + a written scope before underwriting a rehab budget.
Schools (NCES district)
- District
- Long Beach Unified
- NCES district ID
- 0622500
- Math proficiency
- 34% ▼ -11.00%
- Reading proficiency
- 50% ▼ -4.00%
- Median HH income
- $56,092
- Composite
- 36.67/100
- National rank
- #4607
- State rank
- #216 of 517 in CA
Livability — Long Beach
- Score
- 67/100
- State rank
- #319
- US rank
- #10758
Category grades
Schools grade is shown separately in the Schools card above.
Census & demographics
- Census place
- Long Beach, CA
- County
- Los Angeles County · 9,444,647 people
- City population
- 466,088
- Metro
- Los Angeles-Long Beach-Anaheim, CA
- Population (ZIP)
- 31,526
- Household income
- $114,656
- Rent vs Own
- Severe rent burden
- 1537.0
Population outlook (Los Angeles County) Hauer SSP2
- Today (2025)
- 10,940,515 people
- By 2030
- 11,256,481 · +2.9%
- By 2040
- 11,729,929 · +7.2%
- By 2050
- 11,948,407 · +9.2%
- By 2075
- 11,818,114 · +8.0%
- By 2100
- 10,842,928 · -0.9%
Race, ethnicity, and origin ACS 2023
- Neighborhood character
- Majority White (65%)
- Race & ethnicity
- White 65% Hispanic / Latino 19% Two or more races 10% Asian 6% Black 3% Native American 1% Pacific Islander 1%
- Hispanic origin (detail)
- Mexican 12%
- Common ancestry
- Italian 3% Romanian 3% Lithuanian 2%
- Foreign-born
- 14% · Canada, China, Jamaica
- Languages at home
- 84% English-only · Spanish 9% Other Asian/Pacific 2% Tagalog/Filipino 1%
Political lean MEDSL · Los Angeles
- 2024 margin
- Solid D (+32.9) · D 64.8% · R 31.9% · Other 3.3%
- 2008→2024 swing
- -7.4pp toward R · 2008: 40.4pp · 2024: 32.9pp
- All cycles
- 2024: D+32.9 2020: D+44.2 2016: D+48.0 2012: D+40.0 2008: D+40.4
Not yet ingested
- Civics
- —
Market trends
- HPI YoY
- ▼ -634.69%
- Current HPI
- 377.3105
- Rent YoY
- ▲ 1.68%
- Metro
- Los Angeles-Long Beach-Anaheim, CA
- State GDP YoY
- ▲ 3.21%
- F500 in state
- 116
Industry mix (Fortune 500 HQ in CA)
| Industry | F500 HQs | Revenue |
|---|---|---|
| Technology | 27 | $1,492B |
|
||
| Financial Services | 3 | $174B |
|
||
| Retail | 3 | $44B |
|
||
| Insurance | 3 | $26B |
|
||
| Media / Entertainment | 2 | $115B |
|
||
| Pharmaceuticals / Biotech | 2 | $62B |
|
||
Price history
+9.0% since first listed7 events — show timeline
- 2026-06-09 Listed $199,000 CRMLS
- 2022-09-15 Sold (MLS) $182,500 CRMLS
- 2022-08-18 Listing Removed — CRMLS
- 2022-08-17 Listed — CRMLS
- 2022-08-17 Listed $182,500 CRMLS
- 2022-08-17 Contingent — CRMLS
- 2022-08-11 Listed $182,500 CRMLS
Cash-flow waterfall
monthlySold comps — $/sqft
last 12 mo · ≤1 miLoading sold comps…