 Multi-family
1482 18th Ave · San Francisco, CA
Flood risk 1/10 · Minimal
- FEMA flood zone
- X (unshaded)
- Chance of flooding over 30 yrs
- 0.0%
- Est. flood insurance / yr
- $507 – $1,088
Fire risk 1/10 · Minimal
- Est. fire insurance / yr
- $659 – $1,223
Heat risk 1/10 · Minimal
- Hot days now (above 74°F)
- 7 days/yr
- Hot days in 30 yrs
- 16 days/yr
Wind risk 1/10 · Minimal
- Chance of severe wind over 30 yrs
- —
Air-quality risk 7/10 · Major
- Unhealthy air days now
- 13 days/yr
- Unhealthy air days in 30 yrs
- 13 days/yr
Risk factors via First Street. Map © Google.
Why this score? — see what drove the D grade
The composite is a weighted blend of 9 inputs, each scored 0–100. Each bar is that input's sub-score; the figure is the points it added to the 100-point composite (weight × sub-score).
- ARV discount +13.1/15.0
- Cash flow +8.0/30.0
- Schools +5.0/10.0
- Rent growth +4.9/5.0
- Livability +3.8/5.0
- 1% rule +2.5/10.0
- Condition / age +2.5/5.0
- DSCR +2.1/10.0
- Appreciation +0.0/10.0
$1,109,000
🖨 Deal sheet (PDF) 📄 Offer letter ✓ Due diligence
Multi-family units
County records classify this as Multi-Family (2-4 Unit). Listing-text estimate: 1 unit. estimate disagrees with records
Listing remarks MLS
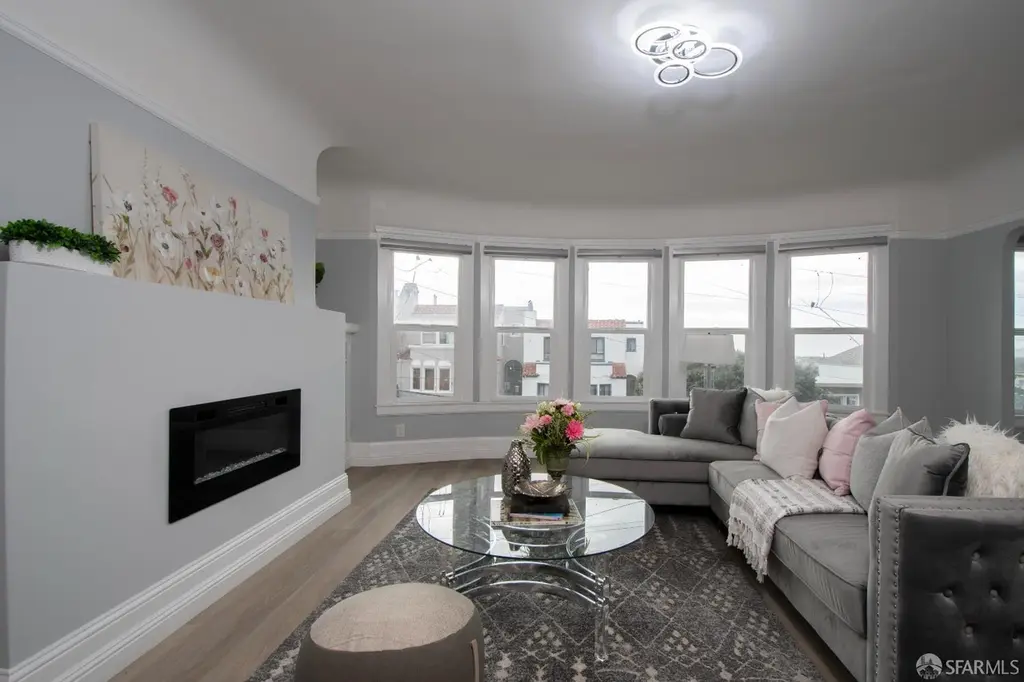
Newly renovated and ideally located in the heart of the Inner Sunset, this top - floor TIC offers ocean views and Golden Gate views with exceptional convenience just two short blocks from the vibrant shops and eateries along Irving Street. Commuting is effortless with the N ‑ Judah MUNI line and 19th Avenue transit options only a block away. Golden Gate Park and its world ‑ class destinations including the Botanical Garden, Academy of Sciences, de Young Museum, and Stow Lake are all within easy reach, making this an unbeatable location for nature lovers, culture seekers, and urban explorers alike. This upper TIC features an almost identical, well ‑ designed layout highlighted by a spacious west ‑ facing living room with a fireplace, a formal dining room, a large kitchen with a breakfast nook and laundry area, two generous bedrooms, and a tastefully updated bathroom. The ground level retains its original expansive garage, offering individual tandem parking for one or more cars along with abundant storage. Each TIC enjoys direct access to the rear yard, enhancing everyday convenience and outdoor enjoyment.
Key facts
- Golden gate park
- N judah muni line
- Newly renovated
Tags
Neighborhood map
What this means for you Summary
Snapshot
- This is a 2-bed/1.0-bath multifamily listed at $1.11M.
Deal economics
- At list price, monthly cash flow is $-1k ($-13k/yr) — negative.
- To cash-flow at today's rent, offer at most $947k (14.6% below list).
- To meet the 1% rule (rent ≥ 1% of price), the offer needs to be $829k (25.3% below list).
- Recommended offer: $829k (25.3% below list) — sets the bar for 1% rule.
- Cap rate 5.1% vs local median 2.1% in San Francisco — top-decile yield for the area; either an underpriced asset or a hidden risk that comps aren't pricing in. Stress-test before assuming the spread holds.
Location & tenants
- Location reads 76/100 on livability (#90 in CA, #3,143 nationally) — a middle-class / working-renter tenant base. Strengths: amenities A+, commute A+, employment A+; Watch: crime F, cost of living F.
- San Francisco Unified (urban): math 50% / reading 56% proficiency, ranked #322 of 1,400 in CA (top 23%) — acceptable for families but not a draw, mixed tenant base, ~2y average lease.
- Market conditions: Rents rising fast (+9.7%/yr); 63 active listings in the ZIP; 22 comparable units currently listed for rent nearby; rentals at typical pace (median 24d on market — plan ~3-4 weeks tenant-placement turnaround); high-income renter base; 750 units permitted in San Francisco County in 2024 (688 in 5+ unit buildings).
- At $8,287/mo this rent would consume 68% of the median local household income ($146k/yr) (locally 2227% of renters already pay >50% of income on rent) — very limited rent-growth headroom before tenants either downsize or default.
Forward outlook
- Local home prices are declining (-3.0%/yr); year-one equity from $8k of loan paydown is wiped out by about $33k of value loss. Plan a longer hold.
- San Francisco County population projected at +39% by 2050 — long-run rental-demand tailwind backs the buy-and-hold thesis.
Negotiation context
- It's been on market 79 days — a 6% lower offer ($1.04M) is reasonable based on typical stale-listing flexibility.
- 3 sale attempts since 9y ago with the ask held roughly flat each time — persistent listings suggest the price (not the market) is what's stuck; bring a comps-based counter.
Risks & watch-outs
- Watch-outs: built in 1926 — expect roof / HVAC / electrical / plumbing capex.
Questions for the listing agent
- What do current leases actually rent for vs. the listed asking? Can we see a recent rent roll and the last 12 months of T-12 income?
- It's been on market 79 days. Have you received any prior offers? Is the seller open to a 25% concession, seller financing, or rate buy-down credit?
- Built in 1926 — when were the roof, HVAC, electrical panel, plumbing, and water heater last replaced?
- Why hasn't it sold? Are there any deal-killer items the seller is aware of (foundation, flood, title, zoning, code violations)?
- Is there a deadline driving the sale (1031 exchange, divorce, estate, relocation)? That informs how much negotiation room exists.
- Schools are B-rated — typically a magnet for longer-tenancy family renters. What's the average tenant stay here, and is there a school-zone premium baked into asking?
- Crime grade is F in this area — have there been break-ins, vandalism, or insurance claims at this property in the last 3 years? What carrier currently insures it and at what premium?
- The area grade is low — what's the realistic commute time and amenity access for the typical tenant pool here? Any planned neighborhood developments (good or bad) we should know about?
- What's the average days-on-market for RENTAL listings here right now (not sales)? A rising rental-DOM trend means longer vacancies and softer asking-rent achievability than the comps imply.
- What's the recent tenant-quality profile in this submarket — average credit score on applications, eviction rate, late-payment / NSF rate, and stable-employment percentage? A property-management company in the area should have these aggregated.
- How much new apartment / multifamily construction is in the pipeline within 1–3 miles? Heavy new supply (>2% of stock underway) typically softens rents 12–24 months out; light construction supports rent growth.
Investment metrics
- 1% rule
- 0.75% ✗
- Cap rate
- 5.08%
- Cash-on-cash
- -4.32%
- DSCR
- 0.81
- GRM
- 11.2
CMA / ARV
- ARV (median comp)
- $1,267,494
- List price
- $1,109,000
- Delta
- -12.50%
- Verdict
- UNDERPRICED
- Comps
- 7 within 1.0 mi
Show comp detail 2 sales within ~0.75 mi
| Address | Dist | Beds/Ba | Sqft | Sold | Price | $/sf | Match |
|---|---|---|---|---|---|---|---|
| 1400-1402 17th Ave | 0.11mi | 2/2.0 | 1,479 (-2%) | 21mo | $1,130,000 | $764 | 69 |
| 1883 16th Ave | 0.52mi | 2/2.0 | 1,518 (+0%) | 3mo | $1,450,000 | $955 | 68 |
Match score weights: distance 35% · size 25% · config 20% · recency 20%. Top-matched comps best support the ARV.
Projected returns pro-forma
-3.0% appreciation · 8.0% rent growth · sell at horizon
- IRR
- -18.2%
- Equity multiple
- 0.33×
- Total profit
- $-206,948
- Equity at exit
- $165,356
- IRR
- -2.8%
- Equity multiple
- 0.77×
- Total profit
- $-72,004
- Equity at exit
- $95,886
Cash invested: $310,520 (down + closing). Projections, not guarantees.
Landlord ↔ Tenant lean methodology
- Overall (CITY)
- 0 Strongly Tenant-Friendly
- State California
- 18 Strongly Tenant-Friendly · D+13
- County
- — inherits STATE
- City San Francisco
- 0 Strongly Tenant-Friendly · D+57
ZIP-level market 94122
- Rents YoY
- 9.7%
- Active inventory
- 63
- Price-to-rent
- 22.3×
Monthly cashflow live
- Estimated rent
- $8,287 high interval (Pro) →
- Mortgage (P&I)
- −$5,816
- Tax est. 1.5%
- −$1,386 /mo · $16,635/yr
- Insurance
- −$462
- HOA
- −$0
- Vacancy / Maint / Mgmt
- −$1,740
- Net cashflow
- $-1,117
Break-even live
Sensitivity live
| Price | -10% $-351 | -5% $-734 | +0% $-1,117 | +5% $-1,501 | +10% $-1,884 |
|---|---|---|---|---|---|
| Rent | -10% $-1,772 | -5% $-1,445 | +0% $-1,117 | +5% $-790 | +10% $-463 |
| Rate | -1.0pp $-559 | -0.5pp $-835 | base $-1,117 | +0.5pp $-1,405 | +1.0pp $-1,697 |
2-unit breakdown (identical units grouped — click to expand)
| Units | Beds | Baths | Est. rent |
|---|---|---|---|
| 2× units | 2 | 1 | $8,286 |
| #1 | 2 | 1 | $4,143 |
| #2 | 2 | 1 | $4,143 |
| Total (2 units) | $8,287 | ||
UW: 25.0% down · 7.5% · 30yr · 1.5% tax · 5.0% vac · 8.0% maint · 8.0% mgmt
Financing live
Cash to close
- Down payment
- $277,250
- Closing costs
- $33,270
- Reserves months
- —
- Total cash needed
- —
Loan-product check · same deal, 3 products live
Conventional
25% down · 7.5% · 30yr
- Down + closing
- —
- Monthly P&I
- —
- Monthly cashflow
- —
- DSCR
- —
- Eligible?
- —
Personal DTI + credit; lowest rate.
DSCR
20% down · 8.5% · 30yr
- Down + closing
- —
- Monthly P&I
- —
- Monthly cashflow
- —
- DSCR
- —
- Eligible?
- —
No personal income docs; deal must DSCR.
Hard money
10% down · 12.0% · 12mo
- Down + closing
- —
- Monthly P&I
- —
- Monthly cashflow
- —
- DSCR
- —
- Eligible?
- —
Short-term bridge; refi at stabilization.
Rent comps 22 comps
| Address | Beds | Baths | Sqft | Rent | $/sqft | DOM | Units | Dist |
|---|---|---|---|---|---|---|---|---|
| 1327-1329 Judah St Unit 1327 San Francisco, CA | 2.0 | 1.0 | 1100 | $5,500 | $5.00 | 44d | 1 | 0.10mi |
| 2017 Judah St San Francisco, CA | 2.0 | 1.0 | 1050 | $4,500 | $4.29 | 17d | 1 | 0.44mi |
| 1580-1582 28th Ave Unit 1580 San Francisco, CA | 2.0 | 1.0 | 1250 | $3,900 | $3.12 | 24d | 1 | 0.58mi |
| 1450 Pacheco St San Francisco, CA | 2.0 | 1.0 | 1100 | $3,980 | $3.62 | 20d | 1 | 0.64mi |
| 2525 Judah St Unit 201 San Francisco, CA | 2.0 | 1.5 | 1150 | $5,175 | $4.50 | 44d | 1 | 0.73mi |
| 1323 6th Ave Unit 1325 San Francisco, CA | 2.0 | 1.0 | 1500 | $6,150 | $4.10 | 44d | 1 | 0.74mi |
| 1801 29th Ave San Francisco, CA | 3.0 | 2.0 | 1800 | $5,800 | $3.22 | 24d | 1 | 0.76mi |
| 62 Cragmont Ave San Francisco, CA | 3.0 | 2.0 | 1734 | $7,100 | $4.09 | 44d | 1 | 0.83mi |
| 2043 10th Ave San Francisco, CA | 3.0 | 2.0 | 1300 | $6,750 | $5.19 | 8d | 1 | 0.85mi |
| 833 24th Ave #831 San Francisco, CA | 3.0 | 1.5 | 1500 | $6,295 | $4.20 | 44d | 1 | 1.04mi |
| 13 Warren Dr San Francisco, CA | 3.0 | 3.0 | 1900 | $8,750 | $4.61 | 44d | 1 | 1.13mi |
| 1608 Balboa St San Francisco, CA | 3.0 | 2.0 | 1323 | $7,500 | $5.67 | 2d | 1 | 1.16mi |
| 1608 Balboa St San Francisco, CA | 3.0 | 2.0 | 1323 | $7,500 | $5.67 | 5d | 1 | 1.16mi |
| 1401 39th Ave San Francisco, CA | 3.0 | 2.0 | 1300 | $7,000 | $5.38 | 17d | 1 | 1.24mi |
| 623 8th Ave Unit 623 San Francisco, CA | 3.0 | 1.5 | 1660 | $6,295 | $3.79 | 5d | 1 | 1.26mi |
| 1931 Santiago St Unit A San Francisco, CA | 2.0 | 1.0 | 1216 | $4,500 | $3.70 | 17d | 1 | 1.28mi |
| 1265 Stanyan St San Francisco, CA | 3.0 | 2.0 | 2005 | $13,900 | $6.93 | 8d | 1 | 1.31mi |
| 2401 32nd Ave San Francisco, CA | 3.0 | 1.0 | 1400 | $7,000 | $5.00 | 19d | 1 | 1.44mi |
| 1232 Vicente St Unit 1232 San Francisco, CA | 2.0 | 2.0 | 1200 | $4,495 | $3.75 | 44d | 1 | 1.45mi |
| 1578 43rd Ave Unit B San Francisco, CA | 2.0 | 2.0 | 1250 | $3,300 | $2.64 | 44d | 1 | 1.45mi |
| 61 Marview Way San Francisco, CA | 3.0 | 2.0 | 1581 | $8,450 | $5.34 | 24d | 1 | 1.47mi |
| 61 Marview Way San Francisco, CA | 3.0 | 2.0 | 1581 | $8,200 | $5.19 | 8d | 1 | 1.47mi |
Listing history 7 events
-
2026-05-14status Pending 1147-char remark
Show marketing remark (1147 chars)
Newly renovated and ideally located in the heart of the Inner Sunset, this top - floor TIC offers ocean views and Golden Gate views with exceptional convenience just two short blocks from the vibrant shops and eateries along Irving Street. Commuting is effortless with the N ‑ Judah MUNI line and 19th Avenue transit options only a block away. Golden Gate Park and its world ‑ class destinations including the Botanical Garden, Academy of Sciences, de Young Museum, and Stow Lake are all within easy reach, making this an unbeatable location for nature lovers, culture seekers, and urban explorers alike. This upper TIC features an almost identical, well ‑ designed layout highlighted by a spacious west ‑ facing living room with a fireplace, a formal dining room, a large kitchen with a breakfast nook and laundry area, two generous bedrooms, and a tastefully updated bathroom. The ground level retains its original expansive garage, offering individual tandem parking for one or more cars along with abundant storage. Each TIC enjoys direct access to the rear yard, enhancing everyday convenience and outdoor enjoyment.
-
2026-02-24$1,109,000 Active 1147-char remark
Show marketing remark (1147 chars)
Newly renovated and ideally located in the heart of the Inner Sunset, this top - floor TIC offers ocean views and Golden Gate views with exceptional convenience just two short blocks from the vibrant shops and eateries along Irving Street. Commuting is effortless with the N ‑ Judah MUNI line and 19th Avenue transit options only a block away. Golden Gate Park and its world ‑ class destinations including the Botanical Garden, Academy of Sciences, de Young Museum, and Stow Lake are all within easy reach, making this an unbeatable location for nature lovers, culture seekers, and urban explorers alike. This upper TIC features an almost identical, well ‑ designed layout highlighted by a spacious west ‑ facing living room with a fireplace, a formal dining room, a large kitchen with a breakfast nook and laundry area, two generous bedrooms, and a tastefully updated bathroom. The ground level retains its original expansive garage, offering individual tandem parking for one or more cars along with abundant storage. Each TIC enjoys direct access to the rear yard, enhancing everyday convenience and outdoor enjoyment.
-
2024-06-01historical
-
2024-02-15$2,195,000 Active
-
2017-10-05soldstatus $1,780,000 Closed
-
2017-09-22status Pending
-
2017-09-06$1,590,000 Active
ⓘ Source: listings_history table (triggers on properties + properties_extension) + one-shot
backfill from property_details.listing_events for pre-trigger history.
Climate risk First Street
- Flood 1/10 Low FEMA zone X (unshaded) · 0% chance over 30 yrs
- Wildfire 1/10 Low
- Heat 1/10 Low 7 d/yr ≥74°F today · 16 d/yr by 30 yrs out
- Wind 1/10 Low
- Air quality 7/10 Severe 13 unhealthy d/yr today · 13 by 30 yrs out
Nearby sold comps map
Loading sold comps map…
Walkable amenities ~0.75 mi
Loading nearby amenities…
Taxation est. · year 1
- Rental income
- $99,444
- − Mortgage interest
- −$62,121
- − Property taxes
- −$16,635
- − Insurance
- −$5,545
- − Repairs & maintenance
- −$7,956
- − Management
- −$7,956
- − Depreciation
- −$32,262
- Taxable loss
- −$33,030
- Est. tax savings @ 24.0%
- +$7,927
- After-tax cash flow
- $-5,481/yr
For passive investors: Depreciation is non-cash, so a rental often shows a tax loss while cash-flowing — sheltering income. Rental losses are passive: they offset passive income freely, and up to $25,000/yr can offset ordinary (W-2) income if you actively participate and your MAGI is under $100k (phasing out to $0 by $150k); unused losses carry forward. On sale, claimed depreciation is recaptured at up to 25%, and gains may owe capital-gains tax (a 1031 exchange can defer both). Figures are a year-1 estimate at your 24.0% rate — not tax advice; consult a CPA.
Schools (NCES district)
- District
- San Francisco Unified
- NCES district ID
- 0634410
- Math proficiency
- 50% ▬ 0.00%
- Reading proficiency
- 56% ▲ 1.00%
- Median HH income
- $81,249
- Composite
- 50.14/100
- National rank
- #4088
- State rank
- #322 of 1400 in CA
Livability — San Francisco
- Score
- 76/100
- State rank
- #90
- US rank
- #3143
Category grades
Schools grade is shown separately in the Schools card above.
Census & demographics
- Census place
- San Francisco, CA
- County
- San Francisco County · 827,552 people
- City population
- 827,552
- Metro
- San Francisco-Oakland-Berkeley, CA
- Population (ZIP)
- 55,819
- Household income
- $146,250
- Rent vs Own
- Severe rent burden
- 2227.0
Population outlook (San Francisco County) Hauer SSP2
- Today (2025)
- 1,030,936 people
- By 2030
- 1,110,409 · +7.7%
- By 2040
- 1,270,010 · +23.2%
- By 2050
- 1,435,001 · +39.2%
- By 2075
- 1,779,074 · +72.6%
- By 2100
- 1,966,767 · +90.8%
Race, ethnicity, and origin ACS 2023
- Neighborhood character
- Diverse neighborhood (Simpson 0.66)
- Race & ethnicity
- Asian 44% White 36% Hispanic / Latino 11% Two or more races 11% Black 2%
- Hispanic origin (detail)
- Mexican 4%
- Common ancestry
- Italian 2% Scotch-Irish 2% Lithuanian 2%
- Foreign-born
- 36% · China, Canada, Vietnam
- Languages at home
- 54% English-only · Chinese 26% Spanish 7% Other Indo-European 3%
Political lean MEDSL · San Francisco
- 2024 margin
- Solid D (+64.8) · D 80.3% · R 15.5% · Other 4.1%
- 2008→2024 swing
- -5.7pp toward R · 2008: 70.5pp · 2024: 64.8pp
- All cycles
- 2024: D+64.8 2020: D+72.5 2016: D+76.1 2012: D+70.2 2008: D+70.5
Not yet ingested
- Civics
- —
Market trends
- HPI YoY
- ▼ -946.32%
- Current HPI
- 314.9762
- Rent YoY
- ▲ 9.73%
- Metro
- San Francisco-Oakland-Berkeley, CA
- State GDP YoY
- ▲ 3.21%
- F500 in state
- 116
Industry mix (Fortune 500 HQ in CA)
| Industry | F500 HQs | Revenue |
|---|---|---|
| Technology | 27 | $1,492B |
|
||
| Financial Services | 3 | $174B |
|
||
| Retail | 3 | $44B |
|
||
| Insurance | 3 | $26B |
|
||
| Media / Entertainment | 2 | $115B |
|
||
| Pharmaceuticals / Biotech | 2 | $62B |
|
||
Price history
-30.3% since first listed7 events — show timeline
- 2026-05-14 Pending — San Francisco MLS
- 2026-02-24 Listed $1,109,000 San Francisco MLS
- 2024-06-01 Delisted — San Francisco MLS
- 2024-02-15 Listed $2,195,000 San Francisco MLS
- 2017-10-05 Sold (MLS) $1,780,000 San Francisco MLS
- 2017-09-22 Pending — San Francisco MLS
- 2017-09-06 Listed $1,590,000 San Francisco MLS
Cash-flow waterfall
monthlySold comps — $/sqft
last 12 mo · ≤1 miLoading sold comps…