 20-Plex
7410 Lindencrest St · Houston, TX
Flood risk 3/10 · Minor
- FEMA flood zone
- X (unshaded)
- Chance of flooding over 30 yrs
- 0.2%
- Est. flood insurance / yr
- $507 – $1,088
Fire risk 1/10 · Minimal
- Est. fire insurance / yr
- $1,222 – $2,270
Heat risk 9/10 · Severe
- Hot days now (above 109°F)
- 7 days/yr
- Hot days in 30 yrs
- 24 days/yr
Wind risk 9/10 · Severe
- Chance of severe wind over 30 yrs
- 99.0%
Air-quality risk 2/10 · Minimal
- Unhealthy air days now
- 2 days/yr
- Unhealthy air days in 30 yrs
- 2 days/yr
Risk factors via First Street. Map © Google.
Why this score? — see what drove the D+ grade
The composite is a weighted blend of 9 inputs, each scored 0–100. Each bar is that input's sub-score; the figure is the points it added to the 100-point composite (weight × sub-score).
- Cash flow +20.4/30.0
- ARV discount +7.5/15.0
- DSCR +6.5/10.0
- 1% rule +5.4/10.0
- Livability +3.7/5.0
- Schools +2.7/10.0
- Rent growth +2.4/5.0
- Condition / age +1.0/5.0
- Appreciation +0.0/10.0
$1,900,000
🖨 Deal sheet 📄 Offer letter ✓ Due diligence
Multi-family units
County records classify this as Multi-Family (5+ Unit). Listing-text estimate: 20 units. confirmed
5+ unit building — per-unit beds/baths from public records are typically unavailable; the breakdown below (if shown) is an estimate from the listing text.
Listing remarks
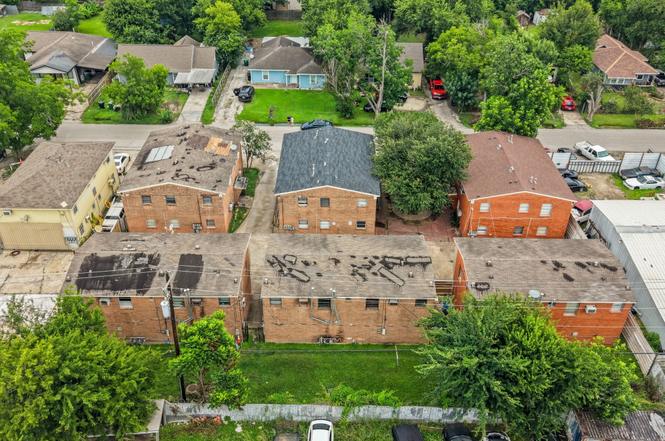
Exceptional investment opportunity in a prime Houston location featuring a well-maintained 20-unit multi-family apartment complex. Composed of multiple solid brick structures, this property offers a fantastic unit mix designed to maximize rental income and maintain high occupancy. The spacious interior layouts offer an efficient flow, bright living areas, comfortable bedrooms with ample closet space, and clean, practical finishes. Situated on an expansive 22,500 square foot lot, the exterior features manicured lawn space, clean concrete walkways, a tidy perimeter fence, and dedicated parking spaces for tenants. Strategically positioned with convenient, quick access to major Houston thorough
Key facts
- Ample closet space
- Bright living areas
- Manicured lawn space
Tags
Property features AI
Finance
- Other: Seller disclosure available
- Financial info: Annual tax amount reported
Exterior
- Home design: Residential Income property; Originally built in 1956
- Construction: Built in 1956; Composition roof
- Exterior features: Composition roof; Lot about 22,500 square feet
Interior
- Heating & cooling: Central heating; Electric heating; Gas heating; Central air conditioning; Electric cooling; Window units
- Interior features: Residential income property with 20 total units; Building area approximately 13,000
Neighborhood map
What this means for you Summary
Snapshot
- This is a 20 × 2-bed/?-bath units multifamily listed at $1.90M. Condition is rated poor.
Deal economics
- At list price, monthly cash flow is $2k ($30k/yr) — positive. Per door: $123/mo.
- The deal already cash-flows at list — no discount required.
- Meets the 1% rule at list price ($20k rent vs $1.90M).
- Cap rate 7.8% vs local median 3.2% in Houston — top-decile yield for the area; either an underpriced asset or a hidden risk that comps aren't pricing in. Stress-test before assuming the spread holds.
Location & tenants
- Location reads 74/100 on livability (#184 in TX, #4,771 nationally) — a middle-class / working-renter tenant base. Strengths: amenities A+, cost of living A+, housing A+; Watch: crime F.
- Houston ISD (urban): math 27% / reading 35% proficiency, ranked #593 of 826 in TX (top 72%) — families likely to look elsewhere, expect single-tenant / working-renter base with shorter leases; 71% free/reduced lunch — lower-income household profile, screen leases tightly.
- Zoned schools: Garden Villas El (math 22% / reading 27%, grade F, #3,052 of 4,322 statewide, top 74%, 370 students, 91% FRL); Hartman Middle (math 15% / reading 23%, grade F, #1,466 of 1,662 statewide, top 89%, 904 students, 96% FRL); Sterling H S (math 16% / reading 27%, grade F, #1,377 of 1,632 statewide, top 85%, 1,421 students, 92% FRL) — zoned schools average 93% FRL vs 71% district-wide (22 pts higher); higher-poverty schools than district average — tighter screening recommended.
- Market conditions: Rents soft (-0.3%/yr); 48 active listings in the ZIP; 29,883 units permitted in Harris County in 2024 (8,621 in 5+ unit buildings).
- At $19,734/mo this rent would consume 525% of the median local household income ($45k/yr) (locally 1546% of renters already pay >50% of income on rent) — very limited rent-growth headroom before tenants either downsize or default.
Forward outlook
- Local home prices are declining (-3.0%/yr); year-one equity from $13k of loan paydown is wiped out by about $57k of value loss. Plan a longer hold.
- Harris County population projected at +47% by 2050 — long-run rental-demand tailwind backs the buy-and-hold thesis.
Negotiation context
- Only 1 days on market — expect competitive offers; lowballing is unlikely to land.
Risks & watch-outs
- Watch-outs: built in 1956 — expect roof / HVAC / electrical / plumbing capex.
- Climate carrying-cost: severe wind risk, 99% chance of damaging wind over 30y; extreme-heat days projected 7→24/yr by 2055 (HVAC capex compounding) — expect insurance premiums to compound above CPI over the hold.
Questions for the listing agent
- Can we see the unit-by-unit rent roll, current vacancy, and any below-market leases? What's the average tenancy length?
- What capital expenditures (roof, boiler, parking lot, exteriors) have been made in the last 5 years, and what's planned in the next 2?
- Have any recent inspections been done? Can we get a copy of the seller's disclosures and any deferred-maintenance estimates?
- Built in 1956 — when were the roof, HVAC, electrical panel, plumbing, and water heater last replaced?
- Is there a deadline driving the sale (1031 exchange, divorce, estate, relocation)? That informs how much negotiation room exists.
- Schools are D-rated, which usually means shorter tenancies and higher turnover. Who's the typical renter profile here, and what's been the actual vacancy rate?
- Crime grade is F in this area — have there been break-ins, vandalism, or insurance claims at this property in the last 3 years? What carrier currently insures it and at what premium?
- The area grade is low — what's the realistic commute time and amenity access for the typical tenant pool here? Any planned neighborhood developments (good or bad) we should know about?
- What's the average days-on-market for RENTAL listings here right now (not sales)? A rising rental-DOM trend means longer vacancies and softer asking-rent achievability than the comps imply.
- What's the recent tenant-quality profile in this submarket — average credit score on applications, eviction rate, late-payment / NSF rate, and stable-employment percentage? A property-management company in the area should have these aggregated.
- How much new apartment / multifamily construction is in the pipeline within 1–3 miles? Heavy new supply (>2% of stock underway) typically softens rents 12–24 months out; light construction supports rent growth.
Investment metrics
- 1% rule
- 1.04% ✓
- Cap rate
- 7.85%
- Cash-on-cash
- 5.55%
- DSCR
- 1.25
- GRM
- 8.0
CMA / ARV
No comps found within radius.
Projected returns pro-forma
-3.0% appreciation · 0.0% rent growth · sell at horizon
- IRR
- -11.1%
- Equity multiple
- 0.61×
- Total profit
- $-208,777
- Equity at exit
- $283,296
- IRR
- -6.9%
- Equity multiple
- 0.62×
- Total profit
- $-202,391
- Equity at exit
- $164,277
Cash invested: $532,000 (down + closing). Projections, not guarantees.
Landlord ↔ Tenant lean methodology
- Overall (STATE)
- 87 Strongly Landlord-Friendly
- State Texas
- 87 Strongly Landlord-Friendly · R+5
- County
- — inherits STATE
- City
- — inherits STATE
ZIP-level market 77061
- Home prices YoY
- -19.7%
- Rents YoY
- -0.3%
- Active inventory
- 48
- Price-to-rent
- 160.5×
Monthly cashflow live
- Estimated rent
- $19,734 high interval (Pro) →
- Mortgage (P&I)
- −$9,964
- Tax est. 1.5%
- −$2,375 /mo · $28,500/yr
- Insurance
- −$792
- HOA
- −$0
- Vacancy / Maint / Mgmt
- −$4,144
- Net cashflow
- $2,459
Break-even live
20-unit breakdown (identical units grouped — click to expand)
| Units | Beds | Baths | Est. rent |
|---|---|---|---|
| 20× units | 2 | — | $19,740 |
| #1 | 2 | — | $987 |
| #2 | 2 | — | $987 |
| #3 | 2 | — | $987 |
| #4 | 2 | — | $987 |
| #5 | 2 | — | $987 |
| #6 | 2 | — | $987 |
| #7 | 2 | — | $987 |
| #8 | 2 | — | $987 |
| #9 | 2 | — | $987 |
| #10 | 2 | — | $987 |
| #11 | 2 | — | $987 |
| #12 | 2 | — | $987 |
| #13 | 2 | — | $987 |
| #14 | 2 | — | $987 |
| #15 | 2 | — | $987 |
| #16 | 2 | — | $987 |
| #17 | 2 | — | $987 |
| #18 | 2 | — | $987 |
| #19 | 2 | — | $987 |
| #20 | 2 | — | $987 |
| Total (20 units) | $19,734 | ||
UW: 25.0% down · 7.5% · 30yr · 1.5% tax · 5.0% vac · 8.0% maint · 8.0% mgmt
Financing live
Cash to close
- Down payment
- $475,000
- Closing costs
- $57,000
- Reserves months
- —
- Total cash needed
- —
Loan-product check · same deal, 3 products live
Conventional
25% down · 7.5% · 30yr
- Down + closing
- —
- Monthly P&I
- —
- Monthly cashflow
- —
- DSCR
- —
- Eligible?
- —
Personal DTI + credit; lowest rate.
DSCR
20% down · 8.5% · 30yr
- Down + closing
- —
- Monthly P&I
- —
- Monthly cashflow
- —
- DSCR
- —
- Eligible?
- —
No personal income docs; deal must DSCR.
Hard money
10% down · 12.0% · 12mo
- Down + closing
- —
- Monthly P&I
- —
- Monthly cashflow
- —
- DSCR
- —
- Eligible?
- —
Short-term bridge; refi at stabilization.
Listing history 2 events
-
2026-06-18remarks 699-char remark
-
2026-06-18$1,900,000 Active 1 DOM
ⓘ Source: listings_history table (triggers on properties + properties_extension) + one-shot
backfill from property_details.listing_events for pre-trigger history.
Climate risk First Street
- Flood 3/10 Moderate FEMA zone X (unshaded) · 20% chance over 30 yrs
- Wildfire 1/10 Low
- Heat 9/10 Extreme 7 d/yr ≥109°F today · 24 d/yr by 30 yrs out
- Wind 9/10 Extreme 99% chance of damaging wind over 30 yrs
- Air quality 2/10 Low 2 unhealthy d/yr today · 2 by 30 yrs out
Nearby sold comps map
Loading sold comps map…
Walkable amenities ~0.75 mi
Loading nearby amenities…
Taxation est. · year 1
- Rental income
- $236,808
- − Mortgage interest
- −$106,430
- − Property taxes
- −$28,500
- − Insurance
- −$9,500
- − Repairs & maintenance
- −$18,945
- − Management
- −$18,945
- − Depreciation
- −$55,273
- Taxable loss
- −$784
- Est. tax savings @ 24.0%
- +$188
- After-tax cash flow
- $29,701/yr
For passive investors: Depreciation is non-cash, so a rental often shows a tax loss while cash-flowing — sheltering income. Rental losses are passive: they offset passive income freely, and up to $25,000/yr can offset ordinary (W-2) income if you actively participate and your MAGI is under $100k (phasing out to $0 by $150k); unused losses carry forward. On sale, claimed depreciation is recaptured at up to 25%, and gains may owe capital-gains tax (a 1031 exchange can defer both). Figures are a year-1 estimate at your 24.0% rate — not tax advice; consult a CPA.
Condition & rehab AI · 12 photos
This multi-family property requires extensive repairs and updates to bring it up to modern standards, significantly impacting its resale and rental value.
Repairs flagged
- Major roof — Significant damage and missing shingles
- Major exterior — Exposed brick, peeling paint
- Major flooring — Worn-out carpet
- Major interior walls — Painted walls with visible wear
- Major bathrooms — Basic fixtures, no updates
- Major systems — No visible HVAC or mechanical systems
Value-add opportunities
- Both roof replacement — Critical safety and aesthetic issue
- Both exterior renovation — Improves curb appeal and value
- Both flooring replacement — Enhances living experience and value
- Both interior wall paint — Freshens up the space and adds value
- Both bathroom updates — Modernizes the space and adds value
- Both HVAC installation — Improves comfort and energy efficiency
Renovation cost estimate screening
| Repair item | Severity | Est. cost |
|---|---|---|
| roof · Significant damage and missing shingles | Major | $15,000–50,000 |
| exterior · Exposed brick, peeling paint | Major | $15,000–50,000 |
| flooring · Worn-out carpet | Major | $15,000–50,000 |
| interior walls · Painted walls with visible wear | Major | $15,000–50,000 |
| bathrooms · Basic fixtures, no updates | Major | $15,000–50,000 |
| systems · No visible HVAC or mechanical systems | Major | $15,000–50,000 |
| Total estimated repair cost · 6 items | $90,000–300,000 |
Value-add ROI direction
- Both roof replacement — Critical safety and aesthetic issue ↑
- Both exterior renovation — Improves curb appeal and value ↑
- Both flooring replacement — Enhances living experience and value ↑
- Both interior wall paint — Freshens up the space and adds value ↑
- Both bathroom updates — Modernizes the space and adds value ↑
- Both HVAC installation — Improves comfort and energy efficiency ↑
ⓘ Cost ranges are severity-bucket heuristics (US national rule-of-thumb). Get contractor quotes + a written scope before underwriting a rehab budget.
Schools (NCES district)
- District
- Houston ISD
- NCES district ID
- 4823640
- Math proficiency
- 27% ▼ -18.00%
- Reading proficiency
- 35% ▼ -6.00%
- Median HH income
- $46,054
- Composite
- 26.63/100
- National rank
- #7173
- State rank
- #593 of 826 in TX
Livability — Houston
- Score
- 74/100
- State rank
- #184
- US rank
- #4771
Category grades
Schools grade is shown separately in the Schools card above.
Census & demographics
- Census place
- Houston, TX
- County
- Harris County · 4,702,590 people
- City population
- 3,226,434
- Metro
- Houston-The Woodlands-Sugar Land, TX
- Population (ZIP)
- 24,004
- Household income
- $45,115
- Rent vs Own
- Severe rent burden
- 1546.0
Population outlook (Harris County) Hauer SSP2
- Today (2025)
- 5,571,493 people
- By 2030
- 6,089,821 · +9.3%
- By 2040
- 7,142,806 · +28.2%
- By 2050
- 8,185,864 · +46.9%
- By 2075
- 10,574,329 · +89.8%
- By 2100
- 12,109,958 · +117.4%
Race, ethnicity, and origin ACS 2023
- Neighborhood character
- Majority Hispanic (64%)
- Race & ethnicity
- Hispanic / Latino 64% Black 21% Two or more races 20% White 7% Asian 6% Native American 3%
- Hispanic origin (detail)
- Mexican 42% Puerto Rican 2% Cuban 2%
- Common ancestry
- Italian 1% Lithuanian 1%
- Foreign-born
- 37% · Canada, Vietnam
- Languages at home
- 35% English-only · Spanish 58% Vietnamese 6% French/Haitian/Cajun 1%
Political lean MEDSL · Harris
- 2024 margin
- Lean D (+5.5) · D 52.0% · R 46.4% · Other 1.6%
- 2008→2024 swing
- +3.9pp toward D · 2008: 1.6pp · 2024: 5.5pp
- All cycles
- 2024: D+5.5 2020: D+13.3 2016: D+12.4 2012: D+0.1 2008: D+1.6
Not yet ingested
- Civics
- —
Market trends
- HPI YoY
- ▼ -74.75%
- Current HPI
- 303.8705
- Rent YoY
- ▼ -0.30%
- Metro
- Houston-The Woodlands-Sugar Land, TX
- State GDP YoY
- ▲ 3.95%
- F500 in state
- 110
Industry mix (Fortune 500 HQ in TX)
| Industry | F500 HQs | Revenue |
|---|---|---|
| Energy | 16 | $1,198B |
|
||
| Technology | 5 | $198B |
|
||
| Engineering / Construction | 4 | $72B |
|
||
| Energy Services | 3 | $60B |
|
||
| Utilities | 3 | $41B |
|
||
| Healthcare | 2 | $330B |
|
||
Price history
+0.0% since first listed2 events — show timeline
- 2026-06-18 Listed $1,900,000 HARMLS
- 2026-06-18 Coming Soon $1,900,000 HARMLS
Cash-flow waterfall
monthlySold comps — $/sqft
last 12 mo · ≤1 miLoading sold comps…