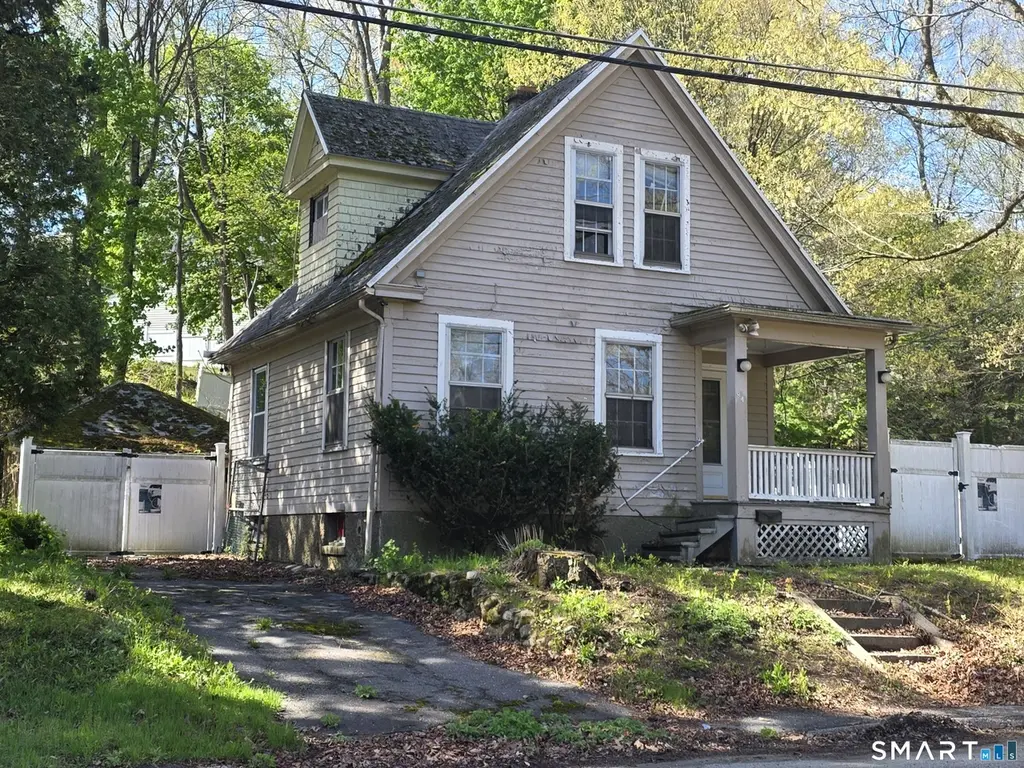
84 Nottingham Ter · Waterbury, CT
Flood risk 3/10 · Minor
- FEMA flood zone
- X (unshaded)
- Chance of flooding over 30 yrs
- 0.2%
- Est. flood insurance / yr
- $473 – $860
Fire risk 1/10 · Minimal
- Est. fire insurance / yr
- $829 – $1,539
Heat risk 5/10 · Moderate
- Hot days now (above 96°F)
- 7 days/yr
- Hot days in 30 yrs
- 16 days/yr
Wind risk 6/10 · Moderate
- Chance of severe wind over 30 yrs
- 27.0%
Air-quality risk 3/10 · Minor
- Unhealthy air days now
- 2 days/yr
- Unhealthy air days in 30 yrs
- 3 days/yr
Risk factors via First Street. Map © Google.
Why this score? — see what drove the C- grade
The composite is a weighted blend of 9 inputs, each scored 0–100. Each bar is that input's sub-score; the figure is the points it added to the 100-point composite (weight × sub-score).
- ARV discount +15.0/15.0
- Cash flow +12.8/30.0
- 1% rule +5.1/10.0
- Rent growth +4.5/5.0
- Livability +4.0/5.0
- DSCR +3.8/10.0
- Condition / age +2.5/5.0
- Appreciation +1.5/10.0
- Schools +1.5/10.0
$159,900
🖨 Deal sheet (PDF) 📄 Offer letter ✓ Due diligence
Listing remarks MLS
The Stainless Stell Ref Isn't The One Staying There Will Be A White Ref Replacing The Current One Starter Home W/ 2 Car Detached Garage. Why Pay Rent When You Can Own For Less And Have A Tax Credit
Key facts
- 6,534 sq ft lot
- 2 garage spots
- Built 1918
Property features AI
Exterior
- Parking: Detached 2-car garage
- Utilities: Public water connected; Public sewer connected; Natural gas available
- Home design: Single-family home
- Construction: Frame construction; Stone foundation; Built (year not provided)
- Exterior features: Lightly wooded, treed, level lot; Vinyl siding; Asphalt shingle roof
Interior
- Bedrooms: 2 bedrooms
- Bathrooms: 1 full bathroom
- Heating & cooling: Baseboard heating; Hot water: natural gas with 30-gallon tank
- Interior features: Full basement
Neighborhood map
What this means for you Summary
Snapshot
- This is a 2-bed/1.0-bath single-family listed at $160k.
Deal economics
- At list price, monthly cash flow is $-13 ($-160/yr) — negative.
- To cash-flow at today's rent, offer at most $158k (1.5% below list).
- Meets the 1% rule at list price ($2k rent vs $160k).
- Recommended offer: $158k (1.5% below list) — sets the bar for cash-flow.
- Cap rate 6.2% vs local median 3.5% in Waterbury — top-decile yield for the area; either an underpriced asset or a hidden risk that comps aren't pricing in. Stress-test before assuming the spread holds.
Location & tenants
- Location reads 79/100 on livability (#32 in CT, #2,205 nationally) — a middle-class / working-renter tenant base. Strengths: commute A+, cost of living A+, housing A+; Watch: schools D+, crime D, employment D.
- Waterbury School District (suburban): math 12% / reading 23% proficiency, ranked #148 of 153 in CT (top 97%) — low school quality limits family demand, transient renter base, plan for 1-2y turnover; 73% free/reduced lunch — lower-income household profile, screen leases tightly.
- Market conditions: Rents rising fast (+8.0%/yr); 103 active listings in the ZIP; 21 comparable units currently listed for rent nearby; rentals at typical pace (median 25d on market — plan ~3-4 weeks tenant-placement turnaround); 502 units permitted in Naugatuck Valley Planning Region in 2024 (171 in 5+ unit buildings).
- This rent runs 40% of the median local income ($49k/yr) — at the standard rent-burdened threshold; future hikes will face affordability resistance.
Forward outlook
- Local home prices are declining (-3.0%/yr); year-one equity from $1k of loan paydown is wiped out by about $5k of value loss. Plan a longer hold.
Negotiation context
- Only 5 days on market — expect competitive offers; lowballing is unlikely to land.
- 4 sale attempts since 22y ago with the ask held roughly flat each time — persistent listings suggest the price (not the market) is what's stuck; bring a comps-based counter.
Risks & watch-outs
- Watch-outs: property tax is 2.9% of price; built in 1918 — expect roof / HVAC / electrical / plumbing capex.
- Climate carrying-cost: major wind risk, 27% chance of damaging wind over 30y; extreme-heat days projected 7→16/yr by 2055 (HVAC capex compounding) — expect insurance premiums to compound above CPI over the hold.
Questions for the listing agent
- What do current leases actually rent for vs. the listed asking? Can we see a recent rent roll and the last 12 months of T-12 income?
- Built in 1918 — when were the roof, HVAC, electrical panel, plumbing, and water heater last replaced?
- Property tax is high relative to price — has the assessment been appealed recently, and will the sale trigger a re-assessment?
- Is there a deadline driving the sale (1031 exchange, divorce, estate, relocation)? That informs how much negotiation room exists.
- Schools are D-rated, which usually means shorter tenancies and higher turnover. Who's the typical renter profile here, and what's been the actual vacancy rate?
- Crime grade is D in this area — have there been break-ins, vandalism, or insurance claims at this property in the last 3 years? What carrier currently insures it and at what premium?
- What's the average days-on-market for RENTAL listings here right now (not sales)? A rising rental-DOM trend means longer vacancies and softer asking-rent achievability than the comps imply.
- What's the recent tenant-quality profile in this submarket — average credit score on applications, eviction rate, late-payment / NSF rate, and stable-employment percentage? A property-management company in the area should have these aggregated.
- How much new for-sale + rental construction is in the pipeline within 1–3 miles? Heavy new supply typically softens prices + rents 12–24 months out; constrained supply supports both.
Investment metrics
- 1% rule
- 1.01% ✓
- Cap rate
- 6.19%
- Cash-on-cash
- -0.36%
- DSCR
- 0.98
- GRM
- 8.2
CMA / ARV
- ARV (median comp)
- $270,750
- List price
- $159,900
- Delta
- -40.94%
- Verdict
- UNDERPRICED
- Comps
- 20 within 1.0 mi
Show comp detail 4 sales within ~0.75 mi
| Address | Dist | Beds/Ba | Sqft | Sold | Price | $/sf | Match |
|---|---|---|---|---|---|---|---|
| 84 Nottingham Ter | 0.00mi | 2/1.0 | 840 (0%) | 0mo | $167,000 | $199 | 100 |
| 590 Columbia Blvd Ext | 0.27mi | 3/2.0 (+1) | 962 (+14%) | 3mo | $281,000 | $292 | 52 |
| 2308 N main St | 0.60mi | 3/1.0 (+1) | 860 (+2%) | 13mo | $165,000 | $192 | 52 |
| 3 Herkimer St | 0.43mi | 2/2.0 | 960 (+14%) | 3mo | $335,000 | $349 | 50 |
Match score weights: distance 35% · size 25% · config 20% · recency 20%. Top-matched comps best support the ARV.
Projected returns pro-forma
-3.0% appreciation · 8.0% rent growth · sell at horizon
- IRR
- -10.5%
- Equity multiple
- 0.60×
- Total profit
- $-18,044
- Equity at exit
- $23,842
- IRR
- 5.5%
- Equity multiple
- 1.51×
- Total profit
- $22,791
- Equity at exit
- $13,825
Cash invested: $44,772 (down + closing). Projections, not guarantees.
Landlord ↔ Tenant lean methodology
- Overall (STATE)
- 27 Tenant-Leaning
- State Connecticut
- 27 Tenant-Leaning · D+7
- County
- — inherits STATE
- City
- — inherits STATE
ZIP-level market 06704
- Home prices YoY
- -2.0%
- Rents YoY
- 8.0%
- Active inventory
- 103
- Price-to-rent
- 8.2×
Monthly cashflow live
- Estimated rent
- $1,622 high interval (Pro) →
- Mortgage (P&I)
- −$839
- Tax from tax record
- −$390 /mo · $4,677/yr
- Insurance
- −$67
- HOA
- −$0
- Vacancy / Maint / Mgmt
- −$341
- Net cashflow
- $-13
Break-even live
Sensitivity live
| Price | -10% $77 | -5% $32 | +0% $-13 | +5% $-59 | +10% $-104 |
|---|---|---|---|---|---|
| Rent | -10% $-141 | -5% $-77 | +0% $-13 | +5% $51 | +10% $115 |
| Rate | -1.0pp $67 | -0.5pp $27 | base $-13 | +0.5pp $-55 | +1.0pp $-97 |
UW: 25.0% down · 7.5% · 30yr · 1.5% tax · 5.0% vac · 8.0% maint · 8.0% mgmt
Financing live
Cash to close
- Down payment
- $39,975
- Closing costs
- $4,797
- Reserves months
- —
- Total cash needed
- —
Loan-product check · same deal, 3 products live
Conventional
25% down · 7.5% · 30yr
- Down + closing
- —
- Monthly P&I
- —
- Monthly cashflow
- —
- DSCR
- —
- Eligible?
- —
Personal DTI + credit; lowest rate.
DSCR
20% down · 8.5% · 30yr
- Down + closing
- —
- Monthly P&I
- —
- Monthly cashflow
- —
- DSCR
- —
- Eligible?
- —
No personal income docs; deal must DSCR.
Hard money
10% down · 12.0% · 12mo
- Down + closing
- —
- Monthly P&I
- —
- Monthly cashflow
- —
- DSCR
- —
- Eligible?
- —
Short-term bridge; refi at stabilization.
Rent comps 21 comps
| Address | Beds | Baths | Sqft | Rent | $/sqft | DOM | Units | Dist |
|---|---|---|---|---|---|---|---|---|
| 446 Perkins Ave Unit 8H Waterbury, CT | 2.0 | 1.5 | 1035 | $1,950 | $1.88 | 3d | 1 | 0.13mi |
| 16 Byron St Waterbury, CT | 2.0 | 1.0 | 1000 | $1,550 | $1.55 | 12d | 1 | 0.30mi |
| 12 Harvard St Waterbury, CT | 2.0 | 1.0 | 1000 | $1,700 | $1.70 | 3d | 1 | 0.47mi |
| 185 Monmouth Ave Waterbury, CT | 2.0 | 1.0 | 900 | $1,500 | $1.67 | 3d | 1 | 0.84mi |
| 25 Lisa Ct #11 Waterbury, CT | 1.0 | 1.0 | 730 | $1,500 | $2.05 | 3d | 1 | 0.99mi |
| 200 Hill St Unit 1R Waterbury, CT | 2.0 | 1.0 | 800 | $1,550 | $1.94 | 44d | 1 | 1.16mi |
| 33 Pilgrim Ave Waterbury, CT | 2.0 | 1.0 | 744 | $1,300 | $1.75 | 24d | 1 | 1.16mi |
| 364 Colonial Ave Unit 7B Waterbury, CT | 1.0 | 1.0 | 540 | $1,200 | $2.22 | 24d | 1 | 1.20mi |
| 62 Brookfield Rd Waterbury, CT | 3.0 | 1.0 | 978 | $2,200 | $2.25 | 2d | 1 | 1.20mi |
| 315 Bishop St Waterbury, CT | 1.0 | 1.0 | 700 | $1,100 | $1.57 | 44d | 1 | 1.23mi |
| 54 Buckridge Rd Waterbury, CT | 2.0 | 1.5 | 1100 | $1,600 | $1.45 | 20d | 1 | 1.28mi |
| 233 Cooke St Unit 3 Waterbury, CT | 3.0 | 1.0 | 1000 | $2,000 | $2.00 | 24d | 1 | 1.36mi |
| 417 N Walnut St Unit 2 Waterbury, CT | 3.0 | 1.0 | 950 | $1,600 | $1.68 | 15d | 1 | 1.38mi |
| 232 Waterville St #2 Waterbury, CT | 2.0 | 1.0 | 987 | $1,395 | $1.41 | 44d | 1 | 1.41mi |
| 247 Willow St Waterbury, CT | 2.0 | 1.0 | 1100 | $1,300 | $1.18 | 24d | 1 | 1.42mi |
| 247 Willow St Waterbury, CT | 2.0 | 1.0 | 1100 | $1,300 | $1.18 | 15d | 1 | 1.42mi |
| 219 Woodlawn Ter Unit 3rd floor Waterbury, CT | 3.0 | 1.0 | 1076 | $1,500 | $1.39 | 44d | 1 | 1.43mi |
| 27 Beacon St Unit 3 Waterbury, CT | 2.0 | 1.0 | 1000 | $1,395 | $1.40 | 44d | 1 | 1.43mi |
| 184 Buckingham St Unit 3 Waterbury, CT | 2.0 | 1.0 | 1000 | $1,600 | $1.60 | 24d | 1 | 1.46mi |
| 150 Chestnut Ave Unit 3 Waterbury, CT | 2.0 | 1.0 | 1000 | $1,250 | $1.25 | 4d | 1 | 1.47mi |
| 22 Wyman St Unit S2 Waterbury, CT | 2.0 | 1.0 | 1100 | $1,500 | $1.36 | 44d | 1 | 1.49mi |
Listing history 11 events
-
2026-05-12status Under Contract 725-char remark
-
2026-05-07$159,900 Active 725-char remark
-
2009-06-12soldstatus $89,900 218-char remark
Show marketing remark (218 chars)
The Stainless Stell Ref Isn't The One Staying There Will Be A White Ref Replacing The Current One Starter Home W/ 2 Car Detached Garage. Why Pay Rent When You Can Own For Less And Have A Tax Credit
-
2009-06-12soldstatus $89,900
Show marketing remark (218 chars)
The Stainless Stell Ref Isn't The One Staying There Will Be A White Ref Replacing The Current One Starter Home W/ 2 Car Detached Garage. Why Pay Rent When You Can Own For Less And Have A Tax Credit
-
2009-03-03$89,900 218-char remark
Show marketing remark (218 chars)
The Stainless Stell Ref Isn't The One Staying There Will Be A White Ref Replacing The Current One Starter Home W/ 2 Car Detached Garage. Why Pay Rent When You Can Own For Less And Have A Tax Credit
-
2009-02-18historical
-
2008-08-18$100,000
-
2004-05-14soldstatus $63,000
-
2004-05-14soldstatus $63,000
-
2004-03-25$55,200
-
1999-01-15soldstatus $65,900
ⓘ Source: listings_history table (triggers on properties + properties_extension) + one-shot
backfill from property_details.listing_events for pre-trigger history.
Tax reassessment forecast CT · Partial reset (capped growth)
- Current annual tax
- $4,677 · $390/mo
- Projected year-2 tax
- $4,677 · $390/mo
- Expected delta
- $0/yr ($0/mo · 0.0%)
ⓘ Screening estimate from a state-policy table — verify with the county assessor before closing.
Climate risk First Street
- Flood 3/10 Moderate FEMA zone X (unshaded) · 20% chance over 30 yrs
- Wildfire 1/10 Low
- Heat 5/10 Major 7 d/yr ≥96°F today · 16 d/yr by 30 yrs out
- Wind 6/10 Major 27% chance of damaging wind over 30 yrs
- Air quality 3/10 Moderate 2 unhealthy d/yr today · 3 by 30 yrs out
Nearby sold comps map
Loading sold comps map…
Walkable amenities ~0.75 mi
Loading nearby amenities…
Taxation est. · year 1
- Rental income
- $19,467
- − Mortgage interest
- −$8,957
- − Property taxes
- −$4,677
- − Insurance
- −$800
- − Repairs & maintenance
- −$1,557
- − Management
- −$1,557
- − Depreciation
- −$4,652
- Taxable loss
- −$2,732
- Est. tax savings @ 24.0%
- +$656
- After-tax cash flow
- $496/yr
For passive investors: Depreciation is non-cash, so a rental often shows a tax loss while cash-flowing — sheltering income. Rental losses are passive: they offset passive income freely, and up to $25,000/yr can offset ordinary (W-2) income if you actively participate and your MAGI is under $100k (phasing out to $0 by $150k); unused losses carry forward. On sale, claimed depreciation is recaptured at up to 25%, and gains may owe capital-gains tax (a 1031 exchange can defer both). Figures are a year-1 estimate at your 24.0% rate — not tax advice; consult a CPA.
Schools (NCES district)
- District
- Waterbury School District
- NCES district ID
- 0904830
- Math proficiency
- 12% ▼ -7.00%
- Reading proficiency
- 23% ▼ -8.00%
- Median HH income
- $40,040
- Composite
- 14.85/100
- National rank
- #9380
- State rank
- #148 of 153 in CT
Livability — Waterbury
- Score
- 79/100
- State rank
- #32
- US rank
- #2205
Category grades
Schools grade is shown separately in the Schools card above.
Census & demographics
- Census place
- Waterbury, CT
- County
- New Haven County · 688,236 people
- City population
- 115,012
- Metro
- New Haven-Milford, CT
- Population (ZIP)
- 31,713
- Household income
- $48,718
- Rent vs Own
- Severe rent burden
- 1981.0
Population outlook (Naugatuck Valley County) Hauer SSP2
- By 2040
- 496,846
Race, ethnicity, and origin ACS 2023
- Neighborhood character
- Diverse neighborhood (Simpson 0.66)
- Race & ethnicity
- Hispanic / Latino 48% Black 28% Two or more races 20% White 18% Asian 2%
- Hispanic origin (detail)
- Mexican 2% Puerto Rican 30% Dominican 8%
- Common ancestry
- Romanian 2% Lithuanian 1% Russian 1%
- Foreign-born
- 16% · Canada, South Korea
- Languages at home
- 56% English-only · Spanish 38% Other Indo-European 3% French/Haitian/Cajun 1%
Political lean MEDSL · Naugatuck Valley
- 2024 margin
- Lean R (+7.4) · D 45.6% · R 53.0% · Other 1.4%
- All cycles
- 2024: R+7.4
Not yet ingested
- Civics
- —
Market trends
- HPI YoY
- ▼ -7.05%
- Current HPI
- 340.0917
- Rent YoY
- ▲ 8.02%
- Metro
- New Haven-Milford, CT
- State GDP YoY
- ▲ 1.06%
- F500 in state
- 38
Industry mix (Fortune 500 HQ in CT)
| Industry | F500 HQs | Revenue |
|---|---|---|
| Industrial Machinery | 4 | $38B |
|
||
| Insurance | 3 | $71B |
|
||
| Financial Services | 2 | $25B |
|
||
| Transportation / Logistics | 2 | $18B |
|
||
| Healthcare | 1 | $247B |
|
||
| Telecommunications | 1 | $55B |
|
||
Price history
+153.4% since first listed12 events — show timeline
- 2026-06-05 Sold (MLS) $167,000 Smart MLS
- 2026-05-12 Pending — Smart MLS
- 2026-05-07 Listed $159,900 Smart MLS
- 2009-06-12 Sold (Public Records) $89,900 Public Records
- 2009-06-12 Sold (MLS) $89,900 Smart MLS
- 2009-03-03 Listed $89,900 Smart MLS
- 2009-02-18 Listing Removed — Smart MLS
- 2008-08-18 Listed $100,000 Smart MLS
- 2004-05-14 Sold (Public Records) $63,000 Public Records
- 2004-05-14 Sold (MLS) $63,000 Smart MLS
- 2004-03-25 Listed $55,200 Smart MLS
- 1999-01-15 Sold (Public Records) $65,900 Public Records
Property tax history
+2.9%/yrLatest (2023): $4,677 · +41.6% YoY. Source: county tax records.
Cash-flow waterfall
monthlySold comps — $/sqft
last 12 mo · ≤1 miLoading sold comps…