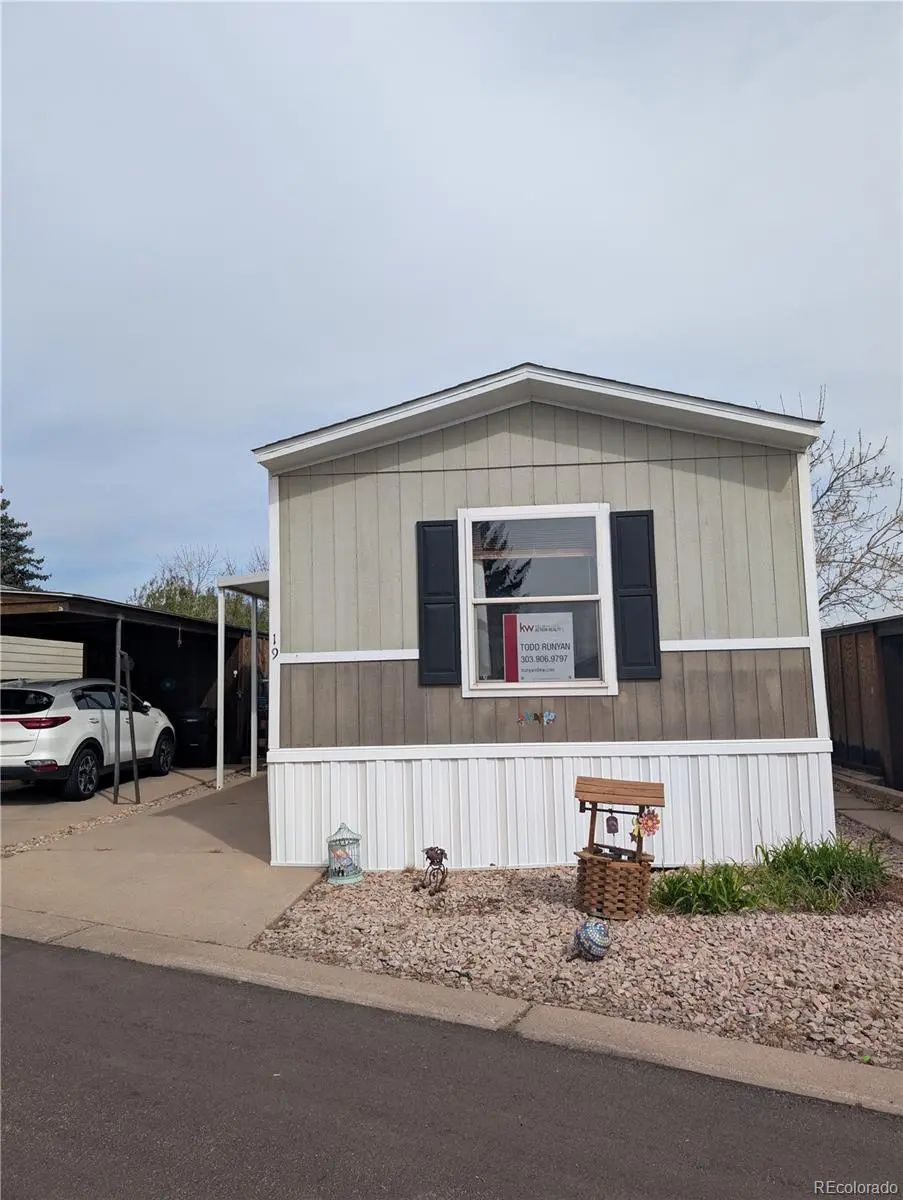
19 Danny St · Castle Rock, CO
Flood risk 1/10 · Minimal
- FEMA flood zone
- X (unshaded)
- Chance of flooding over 30 yrs
- 0.0%
- Est. flood insurance / yr
- $507 – $1,088
Fire risk 7/10 · Major
- Est. fire insurance / yr
- $939 – $1,743
Heat risk 3/10 · Minor
- Hot days now (above 89°F)
- 9 days/yr
- Hot days in 30 yrs
- 24 days/yr
Wind risk 2/10 · Minimal
- Chance of severe wind over 30 yrs
- —
Air-quality risk 1/10 · Minimal
- Unhealthy air days now
- 0 days/yr
- Unhealthy air days in 30 yrs
- 0 days/yr
Risk factors via First Street. Map © Google.
Why this score? — see what drove the C+ grade
The composite is a weighted blend of 9 inputs, each scored 0–100. Each bar is that input's sub-score; the figure is the points it added to the 100-point composite (weight × sub-score).
- Cash flow +30.0/30.0
- 1% rule +10.0/10.0
- DSCR +10.0/10.0
- Schools +5.1/10.0
- Livability +3.9/5.0
- Rent growth +2.6/5.0
- Condition / age +2.5/5.0
- ARV discount +0.0/15.0
- Appreciation +0.0/10.0
$115,000
🖨 Deal sheet 📄 Offer letter ✓ Due diligence
Listing remarks
Welcome to affordable living in Castle Park Mobile Home Park—one of the few established manufactured home communities right in the heart of Castle Rock! This well-maintained 3-bedroom, 2-bath home offers a rare opportunity to own in a highly desirable area at a fraction of the typical cost. Inside, you’ll find a comfortable, open-concept layout designed for easy living. The spacious kitchen connects seamlessly to the main living area, creating a welcoming space for both relaxing and entertaining. The primary suite features a private bath, while two additional bedrooms provide flexibility for guests, a home office, or additional living space. Living in Castle Park means enjoying
Key facts
- Private bath
- Spacious kitchen
- Off-street parking
Tags
Property features AI
Finance
- Other: Property is on leased land in a manufactured home park
- HOA & community: Land lease in effect (monthly land lease); Land lease amount $1,100 per month; Land lease expires December 31, 2026; Located in a park with 1 pad
Exterior
- Parking: Total 2 parking spaces; 1 carport space; 1 off-street space
- Utilities: Public water; Public sewer; Electricity connected (110V and 220V); Natural gas connected; Cable available; Phone connected
- Home design: Manufactured home (manufactured in park); Single-story (all living on main level); Individual ownership; Front-facing covered porch
- Construction: Clayton manufactured home; Frame construction with wood siding; Composition roof; Vinyl skirting; Manufactured dimensions approximately 66 ft by 16 ft
- Exterior features: Private yard; Landscaped lot; Covered front porch
Interior
- Kitchen: Range; Dishwasher; Refrigerator; Disposal; Laminate counters
- Bedrooms: 3 bedrooms, all on the main level; Primary suite located on the main level
- Flooring: Carpet; Laminate
- Bathrooms: 2 full bathrooms, both on the main level
- Heating & cooling: Forced air heating (natural gas); Central air conditioning
- Interior features: Ceiling fans; Laminate countertops; Primary suite; Smoke-free
- Laundry & utility: Washer; Dryer; Gas water heater
Neighborhood map
What this means for you Summary
Snapshot
- This is a 3-bed/2.0-bath manufactured listed at $115k.
Deal economics
- At list price, monthly cash flow is $1k ($16k/yr) — positive.
- The deal already cash-flows at list — no discount required.
- Meets the 1% rule at list price ($3k rent vs $115k).
- Recommended offer: $113k (1.5% below list) — sets the bar for market timing.
- Cap rate 20.0% vs local median 3.1% in Castle Rock — top-decile yield for the area; either an underpriced asset or a hidden risk that comps aren't pricing in. Stress-test before assuming the spread holds.
Location & tenants
- Location reads 78/100 on livability (#15 in CO, #2,469 nationally) — a middle-class / working-renter tenant base. Strengths: crime A+, amenities A+, employment A+; Watch: health & safety D+, commute D-, cost of living F.
- Douglas County School District No. RE-1 (suburban): math 45% / reading 62% proficiency, ranked #7 of 86 in CO (top 8%) — acceptable for families but not a draw, mixed tenant base, ~2y average lease; only 8% free/reduced lunch — higher-income household profile.
- Zoned schools: Clear Sky Elementary (math 47% / reading 52%, grade D, #207 of 966 statewide, top 24%, 675 students, 14% FRL); Castle Rock Middle School (math 30% / reading 49%, grade F, #84 of 270 statewide, top 32%, 748 students, 14% FRL); Castle View High School (math 38% / reading 67%, grade C-, #89 of 381 statewide, top 23%, 1,990 students, 0% FRL) — zoned schools at 9% FRL track the district average.
- Market conditions: Rents flat; 183 active listings in the ZIP; 17 comparable units currently listed for rent nearby; rentals leasing fast (median 13d on market — plan ~1-2 weeks tenant-placement turnaround); high-income renter base; 3,131 units permitted in Douglas County in 2024 (950 in 5+ unit buildings).
Forward outlook
- Local home prices are declining (-3.0%/yr); year-one equity from $795 of loan paydown is wiped out by about $3k of value loss. Plan a longer hold.
- Douglas County population projected at +43% by 2050 — long-run rental-demand tailwind backs the buy-and-hold thesis.
- At projected returns (-3.0% appreciation + 0.4% rent growth), your $32k cash investment doubles in ~3 years — after that, you're playing with house money.
Negotiation context
- It's been on market 16 days — a 2% lower offer ($113k) is reasonable based on typical stale-listing flexibility.
- Current owner paid $27k; list at $115k implies a 324% gain — meaningful room to come down on a strong offer.
Risks & watch-outs
- Climate carrying-cost: major wildfire risk — expect insurance premiums to compound above CPI over the hold.
Questions for the listing agent
- Is there a deadline driving the sale (1031 exchange, divorce, estate, relocation)? That informs how much negotiation room exists.
- Schools are A-rated — typically a magnet for longer-tenancy family renters. What's the average tenant stay here, and is there a school-zone premium baked into asking?
- What's the average days-on-market for RENTAL listings here right now (not sales)? A rising rental-DOM trend means longer vacancies and softer asking-rent achievability than the comps imply.
- What's the recent tenant-quality profile in this submarket — average credit score on applications, eviction rate, late-payment / NSF rate, and stable-employment percentage? A property-management company in the area should have these aggregated.
- How much new for-sale + rental construction is in the pipeline within 1–3 miles? Heavy new supply typically softens prices + rents 12–24 months out; constrained supply supports both.
Investment metrics
- 1% rule
- 2.22% ✓
- Cap rate
- 19.99%
- Cash-on-cash
- 48.93%
- DSCR
- 3.18
- GRM
- 3.8
CMA / ARV
- ARV (on-the-fly)
- $93,984
- Comps found
- 4
Show comp detail 4 sales within ~0.75 mi
| Address | Dist | Beds/Ba | Sqft | Sold | Price | $/sf | Match |
|---|---|---|---|---|---|---|---|
| 19 Danny St | 0.00mi | 3/2.0 | 1,056 (0%) | 0mo | $99,400 | $94 | 100 |
| 17 Darren St | 0.04mi | 3/2.0 | 1,120 (+6%) | 10mo | $100,000 | $89 | 80 |
| 7 Darren St | 0.06mi | 2/2.0 (-1) | 1,120 (+6%) | 13mo | $90,000 | $80 | 71 |
| 19 Jason St | 0.08mi | 3/2.0 | 1,200 (+14%) | 18mo | $105,000 | $88 | 59 |
Match score weights: distance 35% · size 25% · config 20% · recency 20%. Top-matched comps best support the ARV.
Projected returns pro-forma
-3.0% appreciation · 0.38% rent growth · sell at horizon
- IRR
- 43.6%
- Equity multiple
- 2.81×
- Total profit
- $58,423
- Equity at exit
- $17,147
- IRR
- 48.5%
- Equity multiple
- 5.13×
- Total profit
- $132,973
- Equity at exit
- $9,943
Cash invested: $32,200 (down + closing). Projections, not guarantees.
Landlord ↔ Tenant lean methodology
- Overall (STATE)
- 38 Tenant-Leaning
- State Colorado
- 38 Tenant-Leaning · D+4
- County
- — inherits STATE
- City
- — inherits STATE
ZIP-level market 80109
- Home prices YoY
- -24.0%
- Rents YoY
- 0.4%
- Active inventory
- 183
- Price-to-rent
- 3.8×
Monthly cashflow live
- Estimated rent
- $2,550 high interval (Pro) →
- Mortgage (P&I)
- −$603
- Tax from tax record
- −$50 /mo · $605/yr
- Insurance
- −$48
- HOA
- −$0
- Vacancy / Maint / Mgmt
- −$535
- Net cashflow
- $1,313
Break-even live
UW: 25.0% down · 7.5% · 30yr · 1.5% tax · 5.0% vac · 8.0% maint · 8.0% mgmt
Financing live
Cash to close
- Down payment
- $28,750
- Closing costs
- $3,450
- Reserves months
- —
- Total cash needed
- —
Loan-product check · same deal, 3 products live
Conventional
25% down · 7.5% · 30yr
- Down + closing
- —
- Monthly P&I
- —
- Monthly cashflow
- —
- DSCR
- —
- Eligible?
- —
Personal DTI + credit; lowest rate.
DSCR
20% down · 8.5% · 30yr
- Down + closing
- —
- Monthly P&I
- —
- Monthly cashflow
- —
- DSCR
- —
- Eligible?
- —
No personal income docs; deal must DSCR.
Hard money
10% down · 12.0% · 12mo
- Down + closing
- —
- Monthly P&I
- —
- Monthly cashflow
- —
- DSCR
- —
- Eligible?
- —
Short-term bridge; refi at stabilization.
Rent comps 17 comps
| Address | Beds | Baths | Sqft | Rent | $/sqft | DOM | Units | Dist |
|---|---|---|---|---|---|---|---|---|
| 610 Jerry St Castle Rock, CO | 3.0 | 1.0–3.0 | 862 | $3,029 | $3.51 | 12d | 149 | 0.27mi |
| 307 Jerry St Castle Rock, CO | 2.0 | 1.0 | 1150 | $1,995 | $1.73 | 14d | 1 | 0.41mi |
| 115 Wilcox St Castle Rock, CO | 2.0 | 1.0–2.0 | 825 | $2,504 | $3.03 | 2d | 6 | 0.55mi |
| 1465 Red Hawk Dr Castle Rock, CO | 3.0 | 2.0 | 1343 | $2,646 | $1.97 | 2d | 2 | 0.57mi |
| 1457 Red Hawk Dr Castle Rock, CO | 3.0 | 2.5 | 1537 | $3,085 | $2.01 | 12d | 2 | 0.61mi |
| 701 Canyon Dr Unit 701 Castle Rock, CO | 2.0 | 2.0 | 1060 | $2,000 | $1.89 | 5d | 1 | 0.62mi |
| 20 Wilcox St Castle Rock, CO | 1.0–3.0 | 1.0–2.0 | 1180 | $4,200 | $3.56 | 24d | 2 | 0.63mi |
| 677 Canyon Dr Castle Rock, CO | 2.0 | 2.0 | 1299 | $2,300 | $1.77 | 14d | 1 | 0.63mi |
| 122 Lewis St Unit B Castle Rock, CO | 2.0 | 1.0 | 750 | $1,550 | $2.07 | 18d | 1 | 0.72mi |
| 7 Cantril St Castle Rock, CO | 2.0–3.0 | 1.0–2.0 | 1072 | $2,295 | $2.14 | 2d | 5 | 0.73mi |
| 602 South St Unit C Castle Rock, CO | 2.0 | 1.0 | 890 | $1,450 | $1.63 | 24d | 1 | 0.78mi |
| 472 S Gilbert St Castle Rock, CO | 2.0 | 1.0 | 860 | $1,520 | $1.77 | 2d | 1 | 1.10mi |
| 481 S Oman Rd Castle Rock, CO | 2.0 | 1.0 | 867 | $1,525 | $1.76 | 5d | 1 | 1.11mi |
| 960 Bishop Ct Castle Rock, CO | 3.0 | 1.0 | 892 | $1,609 | $1.80 | 24d | 1 | 1.22mi |
| 910 Bishop Ct Castle Rock, CO | 2.0 | 1.0 | 900 | $1,334 | $1.48 | 16d | 1 | 1.25mi |
| 920 Bishop Ct Castle Rock, CO | 3.0 | 1.0 | 892 | $1,518 | $1.70 | 16d | 1 | 1.25mi |
| 1100 E Plum Creek Pkwy Castle Rock, CO | 1.0–3.0 | 1.0–2.0 | 984 | $2,596 | $2.64 | 2d | 33 | 1.39mi |
Listing history 3 events
-
2026-04-29status Pending
-
2026-04-12$115,000 Active
-
2011-06-01soldstatus $27,143
ⓘ Source: listings_history table (triggers on properties + properties_extension) + one-shot
backfill from property_details.listing_events for pre-trigger history.
Tax reassessment forecast CO · Resets to sale price
- Current annual tax
- $605 · $50/mo
- Projected year-2 tax
- $632 · $53/mo
- Expected delta
- +$27/yr (+$2/mo · 4.5%)
ⓘ Screening estimate from a state-policy table — verify with the county assessor before closing.
Climate risk First Street
- Flood 1/10 Low FEMA zone X (unshaded) · 0% chance over 30 yrs
- Wildfire 7/10 Severe
- Heat 3/10 Moderate 9 d/yr ≥89°F today · 24 d/yr by 30 yrs out
- Wind 2/10 Low
- Air quality 1/10 Low 0 unhealthy d/yr today · 0 by 30 yrs out
Nearby sold comps map
Loading sold comps map…
Walkable amenities ~0.75 mi
Loading nearby amenities…
Taxation est. · year 1
- Rental income
- $30,599
- − Mortgage interest
- −$6,442
- − Property taxes
- −$605
- − Insurance
- −$575
- − Repairs & maintenance
- −$2,448
- − Management
- −$2,448
- − Depreciation
- −$3,345
- Taxable income
- $14,736
- Est. tax owed @ 24.0%
- −$3,537
- After-tax cash flow
- $12,220/yr
For passive investors: Depreciation is non-cash, so a rental often shows a tax loss while cash-flowing — sheltering income. Rental losses are passive: they offset passive income freely, and up to $25,000/yr can offset ordinary (W-2) income if you actively participate and your MAGI is under $100k (phasing out to $0 by $150k); unused losses carry forward. On sale, claimed depreciation is recaptured at up to 25%, and gains may owe capital-gains tax (a 1031 exchange can defer both). Figures are a year-1 estimate at your 24.0% rate — not tax advice; consult a CPA.
Schools (NCES district)
- District
- Douglas County School District No. RE-1
- NCES district ID
- 0803450
- Math proficiency
- 45% ▼ -3.00%
- Reading proficiency
- 62% ▲ 3.00%
- Median HH income
- $103,175
- Composite
- 50.71/100
- National rank
- #1818
- State rank
- #7 of 86 in CO
Livability — Castle Rock
- Score
- 78/100
- State rank
- #15
- US rank
- #2469
Category grades
Schools grade is shown separately in the Schools card above.
Census & demographics
- Census place
- Castle Rock, CO
- County
- Douglas County · 358,815 people
- City population
- 66,879
- Metro
- Denver-Aurora-Lakewood, CO
- Population (ZIP)
- 28,400
- Household income
- $155,025
- Rent vs Own
- Severe rent burden
- 472.0
Population outlook (Douglas County) Hauer SSP2
- Today (2025)
- 400,644 people
- By 2030
- 438,441 · +9.4%
- By 2040
- 509,940 · +27.3%
- By 2050
- 571,695 · +42.7%
- By 2075
- 699,992 · +74.7%
- By 2100
- 751,119 · +87.5%
Race, ethnicity, and origin ACS 2023
- Neighborhood character
- Predominantly White (80%)
- Race & ethnicity
- White 80% Hispanic / Latino 12% Two or more races 8% Asian 2% Black 1%
- Hispanic origin (detail)
- Mexican 6%
- Common ancestry
- Italian 4% Slovak 3% Portuguese 3%
- Foreign-born
- 6% · Canada, Jamaica
- Languages at home
- 89% English-only · Spanish 9% Other Indo-European 1%
Political lean MEDSL · Douglas
- 2024 margin
- Lean R (+7.0) · D 45.3% · R 52.3% · Other 2.4%
- 2008→2024 swing
- +10.2pp toward D · 2008: -17.2pp · 2024: -7.0pp
- All cycles
- 2024: R+7.0 2020: R+7.2 2016: R+18.1 2012: R+26.5 2008: R+17.2
Not yet ingested
- Civics
- —
Market trends
- HPI YoY
- ▼ -84.64%
- Current HPI
- 268.6028
- Rent YoY
- ▲ 0.38%
- Metro
- Denver-Aurora-Lakewood, CO
- State GDP YoY
- ▲ 1.95%
- F500 in state
- 14
Industry mix (Fortune 500 HQ in CO)
| Industry | F500 HQs | Revenue |
|---|---|---|
| Technology Distribution | 1 | $31B |
|
||
| Food / Agriculture | 1 | $18B |
|
||
| Packaging | 1 | $14B |
|
||
| Healthcare | 1 | $13B |
|
||
| Energy | 1 | $10B |
|
||
| Technology | 1 | $4B |
|
||
Price history
+323.7% since first listed3 events — show timeline
- 2026-04-29 Pending — REColorado as Distributed by MLS Grid
- 2026-04-12 Listed $115,000 REColorado as Distributed by MLS Grid
- 2011-06-01 Sold (Public Records) $27,143 Public Records
Property tax history
+9.5%/yrLatest (2025): $605 · +178.2% YoY. Source: county tax records.
Cash-flow waterfall
monthlySold comps — $/sqft
last 12 mo · ≤1 miLoading sold comps…