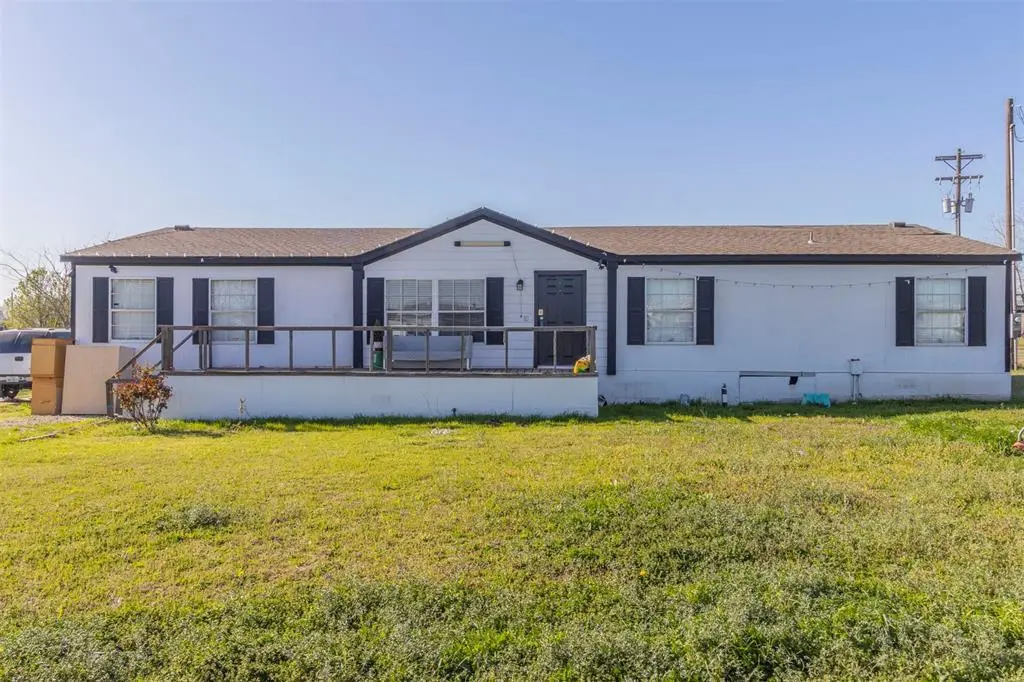
230 Private Road 4906 · Rhome, TX
Flood risk 1/10 · Minimal
- FEMA flood zone
- X (unshaded)
- Chance of flooding over 30 yrs
- 0.0%
- Est. flood insurance / yr
- $507 – $1,088
Fire risk 7/10 · Major
- Est. fire insurance / yr
- $1,222 – $2,270
Heat risk 7/10 · Major
- Hot days now (above 109°F)
- 7 days/yr
- Hot days in 30 yrs
- 22 days/yr
Wind risk 6/10 · Moderate
- Chance of severe wind over 30 yrs
- 27.0%
Air-quality risk 3/10 · Minor
- Unhealthy air days now
- 3 days/yr
- Unhealthy air days in 30 yrs
- 4 days/yr
Risk factors via First Street. Map © Google.
Why this score? — see what drove the C grade
The composite is a weighted blend of 9 inputs, each scored 0–100. Each bar is that input's sub-score; the figure is the points it added to the 100-point composite (weight × sub-score).
- Cash flow +18.4/30.0
- ARV discount +12.7/15.0
- DSCR +5.8/10.0
- 1% rule +4.7/10.0
- Schools +4.6/10.0
- Livability +3.7/5.0
- Rent growth +2.8/5.0
- Condition / age +2.5/5.0
- Appreciation +0.0/10.0
$252,350
🖨 Deal sheet 📄 Offer letter ✓ Due diligence
Listing remarks MLS
Discover the potential of this mobile home situated on a full acre of land, offering space, privacy, and flexibility with no HOA restrictions. Enjoy country-style living with room for outdoor activities, expansion, or storage—all while maintaining convenient access to nearby amenities. Don’t miss this chance to own land and create something truly your own. Whether you’re dreaming of a quiet retreat, a place to expand, or an investment opportunity, this property delivers. Buyer or Buyer's agent to verify all information including room dimensions and schools.
Key facts
- No hoa restrictions
- Full acre of land
- 1 acre lot
Tags
Neighborhood map
What this means for you Summary
Snapshot
- This is a 3-bed/2.0-bath manufactured listed at $252k.
Deal economics
- At list price, monthly cash flow is $235 ($3k/yr) — positive.
- The deal already cash-flows at list — no discount required.
- To meet the 1% rule (rent ≥ 1% of price), the offer needs to be $244k (3.4% below list).
- Recommended offer: $244k (3.4% below list) — sets the bar for 1% rule.
- Cap rate 7.4% vs local median 3.7% in Rhome — top-decile yield for the area; either an underpriced asset or a hidden risk that comps aren't pricing in. Stress-test before assuming the spread holds.
Location & tenants
- Location reads 74/100 on livability (#165 in TX, #4,376 nationally) — a middle-class / working-renter tenant base. Strengths: cost of living A+, housing A+, crime A-; Watch: schools D-, amenities F, commute F.
- Northwest ISD (rural): math 48% / reading 52% proficiency, ranked #120 of 826 in TX (top 14%) — acceptable for families but not a draw, mixed tenant base, ~2y average lease.
- Market conditions: Rents rising (+1.1%/yr); 1083 active listings in the ZIP; high-income renter base; 460 units permitted in Wise County in 2024 (243 in 5+ unit buildings).
Forward outlook
- Local home prices are declining (-3.0%/yr); year-one equity from $2k of loan paydown is wiped out by about $8k of value loss. Plan a longer hold.
- Wise County population projected at +27% by 2050 — long-run rental-demand tailwind backs the buy-and-hold thesis.
Negotiation context
- It's been on market 57 days — a 3% lower offer ($245k) is reasonable based on typical stale-listing flexibility.
- 4 sale attempts since 4y ago with the ask held roughly flat each time — persistent listings suggest the price (not the market) is what's stuck; bring a comps-based counter.
Risks & watch-outs
- Climate carrying-cost: major wind risk, 27% chance of damaging wind over 30y; major wildfire risk; extreme-heat days projected 7→22/yr by 2055 (HVAC capex compounding) — expect insurance premiums to compound above CPI over the hold.
Questions for the listing agent
- It's been on market 57 days. Have you received any prior offers? Is the seller open to a 3% concession, seller financing, or rate buy-down credit?
- Is there a deadline driving the sale (1031 exchange, divorce, estate, relocation)? That informs how much negotiation room exists.
- Schools are D-rated, which usually means shorter tenancies and higher turnover. Who's the typical renter profile here, and what's been the actual vacancy rate?
- What's the average days-on-market for RENTAL listings here right now (not sales)? A rising rental-DOM trend means longer vacancies and softer asking-rent achievability than the comps imply.
- What's the recent tenant-quality profile in this submarket — average credit score on applications, eviction rate, late-payment / NSF rate, and stable-employment percentage? A property-management company in the area should have these aggregated.
- How much new for-sale + rental construction is in the pipeline within 1–3 miles? Heavy new supply typically softens prices + rents 12–24 months out; constrained supply supports both.
Investment metrics
- 1% rule
- 0.97% ✗
- Cap rate
- 7.41%
- Cash-on-cash
- 3.99%
- DSCR
- 1.18
- GRM
- 8.6
CMA / ARV
- ARV (median comp)
- $285,652
- List price
- $252,350
- Delta
- -11.66%
- Verdict
- UNDERPRICED
- Comps
- 4 within 1.0 mi
Show comp detail 5 sales within ~0.75 mi
| Address | Dist | Beds/Ba | Sqft | Sold | Price | $/sf | Match |
|---|---|---|---|---|---|---|---|
| 578 Private Rd #4906 | 0.26mi | 3/2.0 | 1,848 (-10%) | 15mo | $229,900 | $124 | 59 |
| 1200 Alliance Blvd | 0.63mi | 4/2.0 (+1) | 2,128 (+4%) | 4mo | $275,000 | $129 | 56 |
| 1353 Speedway Dr | 0.56mi | 3/2.0 | 1,753 (-14%) | 8mo | $294,000 | $168 | 43 |
| 1115 Daytona Dr | 0.69mi | 4/2.0 (+1) | 2,280 (+11%) | 2mo | $292,500 | $128 | 42 |
| 1205 Alliance Blvd | 0.74mi | 4/3.5 (+1) | 2,128 (+4%) | 8mo | $290,000 | $136 | 41 |
Match score weights: distance 35% · size 25% · config 20% · recency 20%. Top-matched comps best support the ARV.
Projected returns pro-forma
-3.0% appreciation · 1.08% rent growth · sell at horizon
- IRR
- -12.2%
- Equity multiple
- 0.57×
- Total profit
- $-30,533
- Equity at exit
- $37,626
- IRR
- -6.1%
- Equity multiple
- 0.64×
- Total profit
- $-25,532
- Equity at exit
- $21,819
Cash invested: $70,658 (down + closing). Projections, not guarantees.
Landlord ↔ Tenant lean methodology
- Overall (STATE)
- 87 Strongly Landlord-Friendly
- State Texas
- 87 Strongly Landlord-Friendly · R+5
- County
- — inherits STATE
- City
- — inherits STATE
ZIP-level market 76052
- Home prices YoY
- -25.0%
- Rents YoY
- 1.1%
- Active inventory
- 1083
- Price-to-rent
- 8.6×
Monthly cashflow live
- Estimated rent
- $2,438 medium interval (Pro) →
- Mortgage (P&I)
- −$1,323
- Tax from tax record
- −$262 /mo · $3,145/yr
- Insurance
- −$105
- HOA
- −$0
- Vacancy / Maint / Mgmt
- −$512
- Net cashflow
- $235
Break-even live
UW: 25.0% down · 7.5% · 30yr · 1.5% tax · 5.0% vac · 8.0% maint · 8.0% mgmt
Financing live
Cash to close
- Down payment
- $63,088
- Closing costs
- $7,570
- Reserves months
- —
- Total cash needed
- —
Loan-product check · same deal, 3 products live
Conventional
25% down · 7.5% · 30yr
- Down + closing
- —
- Monthly P&I
- —
- Monthly cashflow
- —
- DSCR
- —
- Eligible?
- —
Personal DTI + credit; lowest rate.
DSCR
20% down · 8.5% · 30yr
- Down + closing
- —
- Monthly P&I
- —
- Monthly cashflow
- —
- DSCR
- —
- Eligible?
- —
No personal income docs; deal must DSCR.
Hard money
10% down · 12.0% · 12mo
- Down + closing
- —
- Monthly P&I
- —
- Monthly cashflow
- —
- DSCR
- —
- Eligible?
- —
Short-term bridge; refi at stabilization.
Listing history 30 events
-
2026-06-18days on market $252,350 Active 57 DOM
-
2026-06-17days on market $252,350 Active 56 DOM
-
2026-06-16days on market $252,350 Active 55 DOM
-
2026-06-15days on market $252,350 Active 54 DOM
-
2026-06-13days on market $252,350 Active 52 DOM
-
2026-06-09days on market $252,350 Active 48 DOM
-
2026-06-08days on market $252,350 Active 47 DOM
-
2026-06-07days on market $252,350 Active 46 DOM
-
2026-06-04days on market $252,350 Active 43 DOM
-
2026-06-03days on market $252,350 Active 42 DOM
-
2026-06-02days on market $252,350 Active 41 DOM
-
2026-06-01days on market $252,350 Active 40 DOM
-
2026-05-31days on market $252,350 Active 39 DOM
-
2026-04-22$252,350 Active 587-char remark
Show marketing remark (587 chars)
Discover the potential of this mobile home situated on a full acre of land, offering space, privacy, and flexibility with no HOA restrictions. Enjoy country-style living with room for outdoor activities, expansion, or storage—all while maintaining convenient access to nearby amenities. Don’t miss this chance to own land and create something truly your own. Whether you’re dreaming of a quiet retreat, a place to expand, or an investment opportunity, this property delivers. Buyer or Buyer's agent to verify all information including room dimensions and schools.
-
2025-12-31historical
-
2025-09-29price $255,000
-
2025-08-01$260,000 Active
-
2025-08-01historical
-
2025-07-07price $260,000
-
2025-06-12price $275,000
-
2025-05-13price $280,000
-
2025-03-22$290,000 Active
-
2022-05-25soldstatus
-
2022-05-23soldstatus Closed
-
2022-05-10status Pending
-
2022-04-19historical Active Option Contract
-
2022-04-04$254,000 Active
-
2017-04-26soldstatus
-
2002-01-11soldstatus
-
2000-09-13soldstatus
ⓘ Source: listings_history table (triggers on properties + properties_extension) + one-shot
backfill from property_details.listing_events for pre-trigger history.
Tax reassessment forecast TX · Resets to sale price
- Current annual tax
- $3,145 · $262/mo
- Projected year-2 tax
- $4,618 · $385/mo
- Expected delta
- +$1,473/yr (+$123/mo · 46.8%)
ⓘ Screening estimate from a state-policy table — verify with the county assessor before closing.
Climate risk First Street
- Flood 1/10 Low FEMA zone X (unshaded) · 0% chance over 30 yrs
- Wildfire 7/10 Severe
- Heat 7/10 Severe 7 d/yr ≥109°F today · 22 d/yr by 30 yrs out
- Wind 6/10 Major 27% chance of damaging wind over 30 yrs
- Air quality 3/10 Moderate 3 unhealthy d/yr today · 4 by 30 yrs out
Nearby sold comps map
Loading sold comps map…
Walkable amenities ~0.75 mi
Loading nearby amenities…
Taxation est. · year 1
- Rental income
- $29,251
- − Mortgage interest
- −$14,136
- − Property taxes
- −$3,145
- − Insurance
- −$1,262
- − Repairs & maintenance
- −$2,340
- − Management
- −$2,340
- − Depreciation
- −$7,341
- Taxable loss
- −$1,312
- Est. tax savings @ 24.0%
- +$315
- After-tax cash flow
- $3,136/yr
For passive investors: Depreciation is non-cash, so a rental often shows a tax loss while cash-flowing — sheltering income. Rental losses are passive: they offset passive income freely, and up to $25,000/yr can offset ordinary (W-2) income if you actively participate and your MAGI is under $100k (phasing out to $0 by $150k); unused losses carry forward. On sale, claimed depreciation is recaptured at up to 25%, and gains may owe capital-gains tax (a 1031 exchange can defer both). Figures are a year-1 estimate at your 24.0% rate — not tax advice; consult a CPA.
Schools (NCES district)
- District
- Northwest ISD
- NCES district ID
- 4833180
- Math proficiency
- 48% ▼ -15.00%
- Reading proficiency
- 52% ▼ -8.00%
- Median HH income
- $85,315
- Composite
- 46.15/100
- National rank
- #2504
- State rank
- #120 of 826 in TX
Livability — Rhome
- Score
- 74/100
- State rank
- #165
- US rank
- #4376
Category grades
Schools grade is shown separately in the Schools card above.
Census & demographics
- County
- Tarrant County · 2,033,669 people
- Metro
- Dallas-Fort Worth-Arlington, TX
- Population (ZIP)
- 34,249
- Household income
- $143,555
- Rent vs Own
- Severe rent burden
- 358.0
Population outlook (Wise County) Hauer SSP2
- Today (2025)
- 71,620 people
- By 2030
- 75,858 · +5.9%
- By 2040
- 83,908 · +17.2%
- By 2050
- 90,717 · +26.7%
- By 2075
- 107,583 · +50.2%
- By 2100
- 114,996 · +60.6%
Race, ethnicity, and origin ACS 2023
- Neighborhood character
- Predominantly White (66%)
- Race & ethnicity
- White 66% Hispanic / Latino 14% Two or more races 13% Black 11% Asian 4%
- Hispanic origin (detail)
- Mexican 7% Puerto Rican 2%
- Common ancestry
- Lithuanian 7% Slovak 4% Romanian 1%
- Foreign-born
- 7% · Canada, Vietnam
- Languages at home
- 88% English-only · Spanish 6% Vietnamese 2% Other Indo-European 1%
Political lean MEDSL · Wise
- 2024 margin
- Solid R (+70.0) · D 14.7% · R 84.7%
- 2008→2024 swing
- -14.3pp toward R · 2008: -55.7pp · 2024: -70.0pp
- All cycles
- 2024: R+70.0 2020: R+68.2 2016: R+69.9 2012: R+67.5 2008: R+55.7
Not yet ingested
- Civics
- —
Market trends
- HPI YoY
- ▼ -78.77%
- Current HPI
- 235.7417
- Rent YoY
- ▲ 1.08%
- Metro
- Dallas-Fort Worth-Arlington, TX
- State GDP YoY
- ▲ 3.95%
- F500 in state
- 110
Industry mix (Fortune 500 HQ in TX)
| Industry | F500 HQs | Revenue |
|---|---|---|
| Energy | 16 | $1,198B |
|
||
| Technology | 5 | $198B |
|
||
| Engineering / Construction | 4 | $72B |
|
||
| Energy Services | 3 | $60B |
|
||
| Utilities | 3 | $41B |
|
||
| Healthcare | 2 | $330B |
|
||
Price history
-0.6% since first listed17 events — show timeline
- 2026-04-22 Listed $252,350 NTREIS
- 2025-12-31 Listing Removed — NTREIS
- 2025-09-29 Price Changed $255,000 NTREIS
- 2025-08-01 Listing Removed — NTREIS
- 2025-08-01 Listed $260,000 NTREIS
- 2025-07-07 Price Changed $260,000 NTREIS
- 2025-06-12 Price Changed $275,000 NTREIS
- 2025-05-13 Price Changed $280,000 NTREIS
- 2025-03-22 Listed $290,000 NTREIS
- 2022-05-25 Sold (Public Records) — Public Records
- 2022-05-23 Sold (MLS) — NTREIS
- 2022-05-10 Pending — NTREIS
- 2022-04-19 Contingent — NTREIS
- 2022-04-04 Listed $254,000 NTREIS
- 2017-04-26 Sold (Public Records) — Public Records
- 2002-01-11 Sold (Public Records) — Public Records
- 2000-09-13 Sold (Public Records) — Public Records
Property tax history
+5.4%/yrLatest (2025): $3,145 · -4.9% YoY. Source: county tax records.
Cash-flow waterfall
monthlySold comps — $/sqft
last 12 mo · ≤1 miLoading sold comps…