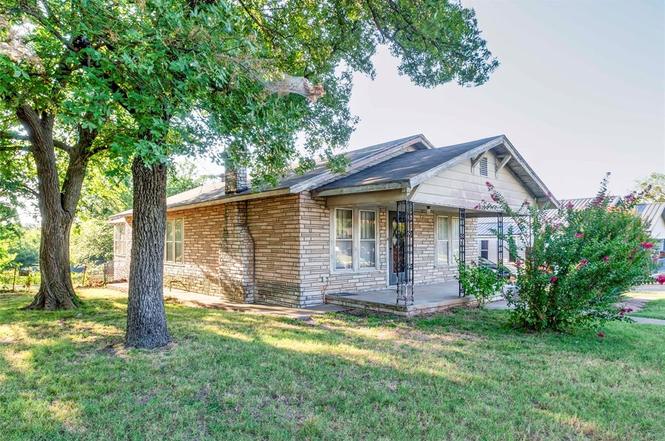
802 Bennett Blvd · Chandler, OK
Flood risk 1/10 · Minimal
- FEMA flood zone
- X (unshaded)
- Chance of flooding over 30 yrs
- 0.0%
- Est. flood insurance / yr
- $507 – $1,088
Fire risk 6/10 · Moderate
- Est. fire insurance / yr
- $2,463 – $4,575
Heat risk 6/10 · Moderate
- Hot days now (above 110°F)
- 7 days/yr
- Hot days in 30 yrs
- 18 days/yr
Wind risk 3/10 · Minor
- Chance of severe wind over 30 yrs
- 6.0%
Air-quality risk 2/10 · Minimal
- Unhealthy air days now
- 1 days/yr
- Unhealthy air days in 30 yrs
- 1 days/yr
Risk factors via First Street. Map © Google.
Why this score? — see what drove the B+ grade
The composite is a weighted blend of 9 inputs, each scored 0–100. Each bar is that input's sub-score; the figure is the points it added to the 100-point composite (weight × sub-score).
- Cash flow +25.7/30.0
- ARV discount +15.0/15.0
- Appreciation +10.0/10.0
- DSCR +8.6/10.0
- 1% rule +5.6/10.0
- Livability +3.2/5.0
- Schools +3.0/10.0
- Rent growth +2.5/5.0
- Condition / age +2.5/5.0
$109,000
🖨 Deal sheet 📄 Offer letter ✓ Due diligence
Listing remarks
Affordable 3-bedroom home with character, space, and potential on a shaded corner lot. Situated on a large lot with mature trees, established landscaping, and a fenced backyard, this property offers a great opportunity for investors, first-time buyers, or anyone looking to build equity through improvements. Inside, you'll find original hardwood floors, a spacious living area, and a functional floor plan with all three bedrooms conveniently located along the south side of the home. The east-facing sunroom provides a bright and relaxing space overlooking the backyard and could serve as a second living area, hobby room, or home office. Outside, the detached garage/workshop offers additional st
Key facts
- East-facing sunroom
- Original wood floors
- Fenced backyard
Tags
Property features AI
Finance
- Other: Listing days on market: 217; Property listed by Premier Realty LLC
- Financial info: Sold as‑is; financing options include Cash and Conventional; Not assumable
- HOA & community: No mandatory association dues
Exterior
- Parking: 1‑car garage
- Utilities: Homestead exempt (homestead status applied)
- Home design: Single family residence; One level; Residential property
- Construction: Brick and frame construction; Composition roof (replaced 2016); Conventional foundation
- Exterior features: Covered deck; Covered patio; Workshop; Chain link fencing; Corner lot
Interior
- Kitchen: Free‑standing electric range and oven
- Bedrooms: 3 bedrooms
- Flooring: Combination flooring
- Bathrooms: 1 full bathroom
- Interior features: Combo flooring; Mock fireplace; Florida room
Neighborhood map
What this means for you Summary
Snapshot
- This is a 3-bed/1.0-bath single-family listed at $109k.
Deal economics
- At list price, monthly cash flow is $262 ($3k/yr) — positive.
- The deal already cash-flows at list — no discount required.
- Meets the 1% rule at list price ($1k rent vs $109k).
- Recommended offer: $96k (12.0% below list) — sets the bar for market timing.
- Cap rate 9.2% vs local median 2.8% in Chandler — top-decile yield for the area; either an underpriced asset or a hidden risk that comps aren't pricing in. Stress-test before assuming the spread holds.
Location & tenants
- Location reads 64/100 on livability (#171 in OK) — a middle-class / working-renter tenant base. Strengths: cost of living A+, housing A+; Watch: crime D, employment D, amenities F.
- Chandler (town): math 35% / reading 35% proficiency, ranked #36 of 270 in OK (top 13%) — families likely to look elsewhere, expect single-tenant / working-renter base with shorter leases.
- Zoned schools: Park Road Es (math 38% / reading 36%, grade F, #132 of 845 statewide, top 19%, 313 students, 0% FRL); Chandler Hs (math 47% / reading 52%, grade D, #9 of 447 statewide, top 2%, 335 students, 0% FRL) — zoned schools average 0% FRL vs 42% district-wide (42 pts lower); this property's tenant base skews higher-income than the district average.
- Market conditions: 121 active listings in the ZIP; 19 units permitted in Lincoln County in 2024 (0 in 5+ unit buildings).
Forward outlook
- In year one you build about $12k of equity ($754 loan paydown + $11k appreciation (10.0% local appreciation)).
- At projected returns (10.0% appreciation + 3.0% rent growth), your $31k cash investment doubles in ~2 years — after that, you're playing with house money.
- By year 4, paydown + projected appreciation supports a ~$41k cash-out refi (75% LTV) — recoverable capital for the next deal without selling this one.
Negotiation context
- It's been on market 283 days — a 12% lower offer ($96k) is reasonable based on typical stale-listing flexibility.
- 2 sale attempts; this cycle's ask has dropped $33k (23%) from the opening price — seller is motivated, your offer sets the floor, not the list.
- Current owner paid $41k; list at $109k implies a 166% gain — meaningful room to come down on a strong offer.
Risks & watch-outs
- Watch-outs: built in 1926 — expect roof / HVAC / electrical / plumbing capex.
- Climate carrying-cost: major wildfire risk; extreme-heat days projected 7→18/yr by 2055 (HVAC capex compounding) — expect insurance premiums to compound above CPI over the hold.
Questions for the listing agent
- It's been on market 283 days. Have you received any prior offers? Is the seller open to a 12% concession, seller financing, or rate buy-down credit?
- Built in 1926 — when were the roof, HVAC, electrical panel, plumbing, and water heater last replaced?
- Why hasn't it sold? Are there any deal-killer items the seller is aware of (foundation, flood, title, zoning, code violations)?
- Is there a deadline driving the sale (1031 exchange, divorce, estate, relocation)? That informs how much negotiation room exists.
- Schools are F-rated, which usually means shorter tenancies and higher turnover. Who's the typical renter profile here, and what's been the actual vacancy rate?
- Crime grade is D in this area — have there been break-ins, vandalism, or insurance claims at this property in the last 3 years? What carrier currently insures it and at what premium?
- What's the average days-on-market for RENTAL listings here right now (not sales)? A rising rental-DOM trend means longer vacancies and softer asking-rent achievability than the comps imply.
- What's the recent tenant-quality profile in this submarket — average credit score on applications, eviction rate, late-payment / NSF rate, and stable-employment percentage? A property-management company in the area should have these aggregated.
- How much new for-sale + rental construction is in the pipeline within 1–3 miles? Heavy new supply typically softens prices + rents 12–24 months out; constrained supply supports both.
Investment metrics
- 1% rule
- 1.06% ✓
- Cap rate
- 9.18%
- Cash-on-cash
- 10.29%
- DSCR
- 1.46
- GRM
- 7.9
CMA / ARV
- ARV (on-the-fly)
- $175,872
- Comps found
- 10
Show comp detail 10 sales within ~0.75 mi
| Address | Dist | Beds/Ba | Sqft | Sold | Price | $/sf | Match |
|---|---|---|---|---|---|---|---|
| 215 Bennett Blvd | 0.41mi | 3/1.0 | 1,425 (+4%) | 2mo | $157,900 | $111 | 73 |
| 223 E 9th St | 0.33mi | 3/2.0 | 1,260 (-8%) | 2mo | $159,000 | $126 | 65 |
| 702 E 6th St | 0.17mi | 3/2.0 | 1,550 (+13%) | 5mo | $235,000 | $152 | 63 |
| 211 N Dewey Ave | 0.63mi | 3/2.0 | 1,315 (-4%) | 7mo | $150,000 | $114 | 54 |
| 417 S Cleveland Ave | 0.40mi | 3/2.0 | 1,260 (-8%) | 20mo | $168,000 | $133 | 47 |
| 1117 E 17th St | 0.70mi | 3/1.5 | 1,218 (-11%) | 1mo | $180,000 | $148 | 45 |
| 323 W 9th St | 0.66mi | 3/1.5 | 1,240 (-10%) | 10mo | $180,000 | $145 | 43 |
| 414 S Price Ave | 0.71mi | 2/2.0 (-1) | 1,278 (-7%) | 5mo | $164,000 | $128 | 42 |
| 407 Manvel Ave | 0.54mi | 2/1.0 (-1) | 1,167 (-15%) | 4mo | $35,000 | $30 | 41 |
| 520 Steele Ave | 0.54mi | 2/1.5 (-1) | 1,169 (-15%) | 10mo | $95,000 | $81 | 34 |
Match score weights: distance 35% · size 25% · config 20% · recency 20%. Top-matched comps best support the ARV.
Projected returns pro-forma
10.0% appreciation · 3.0% rent growth · sell at horizon
- IRR
- 31.8%
- Equity multiple
- 3.49×
- Total profit
- $75,994
- Equity at exit
- $98,196
- IRR
- 27.5%
- Equity multiple
- 7.90×
- Total profit
- $210,587
- Equity at exit
- $211,763
Cash invested: $30,520 (down + closing). Projections, not guarantees.
Landlord ↔ Tenant lean methodology
- Overall (STATE)
- 83 Strongly Landlord-Friendly
- State Oklahoma
- 83 Strongly Landlord-Friendly · R+20
- County
- — inherits STATE
- City
- — inherits STATE
ZIP-level market 74834
- Home prices YoY
- 19.9%
- Active inventory
- 121
- Price-to-rent
- 7.9×
Monthly cashflow live
- Estimated rent
- $1,157 medium interval (Pro) →
- Mortgage (P&I)
- −$572
- Tax from tax record
- −$35 /mo · $420/yr
- Insurance
- −$45
- HOA
- −$0
- Vacancy / Maint / Mgmt
- −$243
- Net cashflow
- $262
Break-even live
UW: 25.0% down · 7.5% · 30yr · 1.5% tax · 5.0% vac · 8.0% maint · 8.0% mgmt
Financing live
Cash to close
- Down payment
- $27,250
- Closing costs
- $3,270
- Reserves months
- —
- Total cash needed
- —
Loan-product check · same deal, 3 products live
Conventional
25% down · 7.5% · 30yr
- Down + closing
- —
- Monthly P&I
- —
- Monthly cashflow
- —
- DSCR
- —
- Eligible?
- —
Personal DTI + credit; lowest rate.
DSCR
20% down · 8.5% · 30yr
- Down + closing
- —
- Monthly P&I
- —
- Monthly cashflow
- —
- DSCR
- —
- Eligible?
- —
No personal income docs; deal must DSCR.
Hard money
10% down · 12.0% · 12mo
- Down + closing
- —
- Monthly P&I
- —
- Monthly cashflow
- —
- DSCR
- —
- Eligible?
- —
Short-term bridge; refi at stabilization.
Listing history 25 events
-
2026-06-18remarks 699-char remark
-
2026-06-18price $109,000 Active 283 DOM
-
2026-06-18days on market $110,000 Active 283 DOM
-
2026-06-17days on market $110,000 Active 282 DOM
-
2026-06-16days on market $110,000 Active 281 DOM
-
2026-06-15days on market $110,000 Active 280 DOM
-
2026-06-13days on market $110,000 Active 278 DOM
-
2026-06-12days on market $110,000 Active 277 DOM
-
2026-06-09days on market $110,000 Active 274 DOM
-
2026-06-08days on market $110,000 Active 273 DOM
-
2026-06-08days on market $110,000 Active 272 DOM
-
2026-06-05days on market $110,000 Active 270 DOM
-
2026-06-04days on market $110,000 Active 268 DOM
-
2026-06-02days on market $110,000 Active 267 DOM
-
2026-06-01days on market $110,000 Active 266 DOM
-
2026-05-31days on market $110,000 Active 265 DOM
-
2026-04-12price $110,000
-
2026-04-12status Active
-
2026-03-12status Pending
-
2026-02-18price $130,000
-
2025-09-23price $139,000
-
2025-08-07$142,000 Active
-
1995-05-09soldstatus $41,000
-
1993-02-26soldstatus $35,000
-
1982-09-17soldstatus $37,500
ⓘ Source: listings_history table (triggers on properties + properties_extension) + one-shot
backfill from property_details.listing_events for pre-trigger history.
Tax reassessment forecast OK · Resets to sale price
- Current annual tax
- $420 · $35/mo
- Projected year-2 tax
- $981 · $82/mo
- Expected delta
- +$561/yr (+$47/mo · 133.6%)
ⓘ Screening estimate from a state-policy table — verify with the county assessor before closing.
Climate risk First Street
- Flood 1/10 Low FEMA zone X (unshaded) · 0% chance over 30 yrs
- Wildfire 6/10 Major
- Heat 6/10 Major 7 d/yr ≥110°F today · 18 d/yr by 30 yrs out
- Wind 3/10 Moderate 6% chance of damaging wind over 30 yrs
- Air quality 2/10 Low 1 unhealthy d/yr today · 1 by 30 yrs out
Nearby sold comps map
Loading sold comps map…
Walkable amenities ~0.75 mi
Loading nearby amenities…
Taxation est. · year 1
- Rental income
- $13,881
- − Mortgage interest
- −$6,106
- − Property taxes
- −$420
- − Insurance
- −$545
- − Repairs & maintenance
- −$1,110
- − Management
- −$1,110
- − Depreciation
- −$3,171
- Taxable income
- $1,418
- Est. tax owed @ 24.0%
- −$340
- After-tax cash flow
- $2,801/yr
For passive investors: Depreciation is non-cash, so a rental often shows a tax loss while cash-flowing — sheltering income. Rental losses are passive: they offset passive income freely, and up to $25,000/yr can offset ordinary (W-2) income if you actively participate and your MAGI is under $100k (phasing out to $0 by $150k); unused losses carry forward. On sale, claimed depreciation is recaptured at up to 25%, and gains may owe capital-gains tax (a 1031 exchange can defer both). Figures are a year-1 estimate at your 24.0% rate — not tax advice; consult a CPA.
Schools (NCES district)
- District
- Chandler
- NCES district ID
- 4007290
- Math proficiency
- 35% ▲ 1.00%
- Reading proficiency
- 35% ▬ 0.00%
- Median HH income
- $45,229
- Composite
- 29.9/100
- National rank
- #6392
- State rank
- #36 of 270 in OK
Livability — Chandler
- Score
- 64/100
- State rank
- #171
- US rank
- #13840
Category grades
Schools grade is shown separately in the Schools card above.
Census & demographics
- Census place
- Chandler, OK
- City population
- 7,551
- Population (ZIP)
- 7,551
Population outlook (Lincoln County) Hauer SSP2
- Today (2025)
- 36,104 people
- By 2030
- 36,435 · +0.9%
- By 2040
- 36,696 · +1.6%
- By 2050
- 36,216 · +0.3%
- By 2075
- 35,057 · -2.9%
- By 2100
- 31,333 · -13.2%
Race, ethnicity, and origin ACS 2023
- Neighborhood character
- Predominantly White (78%)
- Race & ethnicity
- White 78% Two or more races 12% Hispanic / Latino 3% Black 3% Native American 3%
- Common ancestry
- Lithuanian 4% Slovak 2% Scottish 1%
- Foreign-born
- 1%
- Languages at home
- 97% English-only · Spanish 2%
Political lean MEDSL · Lincoln
- 2024 margin
- Solid R (+63.3) · D 17.5% · R 80.8% · Other 1.7%
- 2008→2024 swing
- -13.4pp toward R · 2008: -49.8pp · 2024: -63.3pp
- All cycles
- 2024: R+63.3 2020: R+63.2 2016: R+60.1 2012: R+49.0 2008: R+49.8
Not yet ingested
- Civics
- —
Market trends
- HPI YoY
- ▲ 52.43%
- Current HPI
- 315.8775
- Rent YoY
- —
- Metro
- —
- State GDP YoY
- ▲ 1.55%
- F500 in state
- 6
Industry mix (Fortune 500 HQ in OK)
| Industry | F500 HQs | Revenue |
|---|---|---|
| Energy | 3 | $48B |
|
||
Price history
+193.3% since first listed9 events — show timeline
- 2026-04-12 Price Changed $110,000 MLSOK
- 2026-04-12 Relisted — MLSOK
- 2026-03-12 Pending — MLSOK
- 2026-02-18 Price Changed $130,000 MLSOK
- 2025-09-23 Price Changed $139,000 MLSOK
- 2025-08-07 Listed $142,000 MLSOK
- 1995-05-09 Sold (Public Records) $41,000 Public Records
- 1993-02-26 Sold (Public Records) $35,000 Public Records
- 1982-09-17 Sold (Public Records) $37,500 Public Records
Property tax history
+2.7%/yrLatest (2025): $420 · -3.2% YoY. Source: county tax records.
Cash-flow waterfall
monthlySold comps — $/sqft
last 12 mo · ≤1 miLoading sold comps…