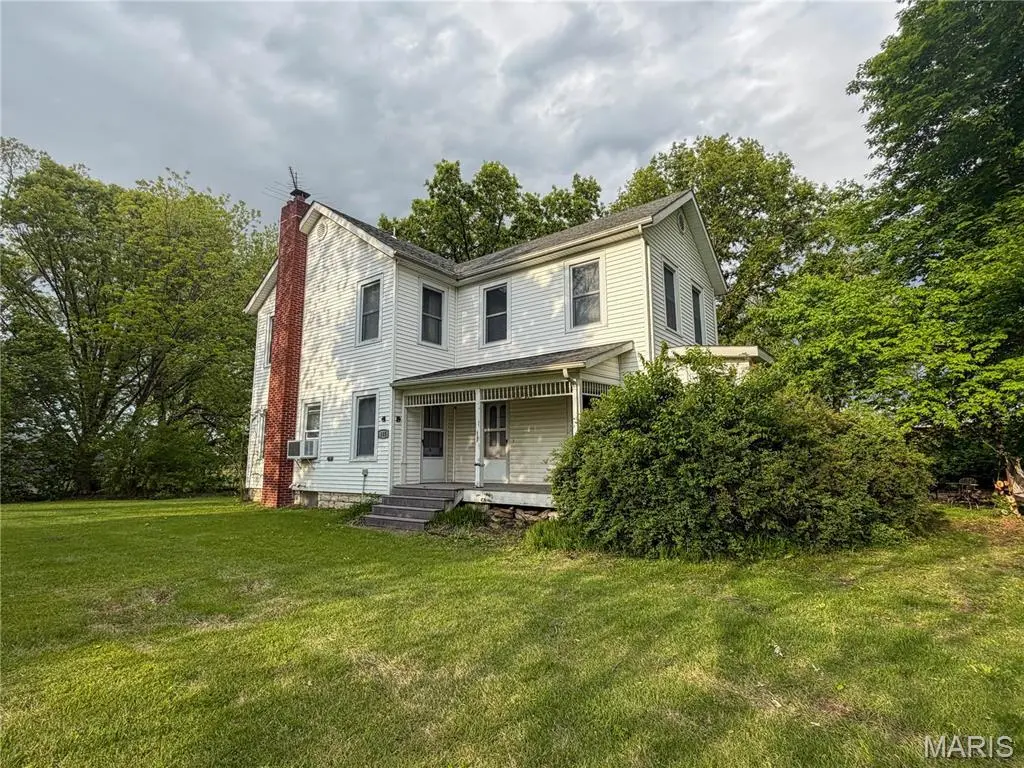
115 Rose Ln · Shipman, IL
Flood risk 1/10 · Minimal
- FEMA flood zone
- X
- Chance of flooding over 30 yrs
- 0.0%
- Est. flood insurance / yr
- $507 – $1,088
Fire risk 1/10 · Minimal
- Est. fire insurance / yr
- $804 – $1,492
Heat risk 4/10 · Minor
- Hot days now (above 106°F)
- 7 days/yr
- Hot days in 30 yrs
- 20 days/yr
Wind risk 2/10 · Minimal
- Chance of severe wind over 30 yrs
- 2.0%
Air-quality risk 2/10 · Minimal
- Unhealthy air days now
- 1 days/yr
- Unhealthy air days in 30 yrs
- 1 days/yr
Risk factors via First Street. Map © Google.
Why this score? — see what drove the C grade
The composite is a weighted blend of 9 inputs, each scored 0–100. Each bar is that input's sub-score; the figure is the points it added to the 100-point composite (weight × sub-score).
- Cash flow +16.0/30.0
- ARV discount +15.0/15.0
- Appreciation +6.3/10.0
- DSCR +4.9/10.0
- 1% rule +4.4/10.0
- Livability +2.8/5.0
- Rent growth +2.5/5.0
- Schools +2.4/10.0
- Condition / age +1.0/5.0
$129,900
🖨 Deal sheet (PDF) 📄 Offer letter ✓ Due diligence
Listing remarks
Character, space, charm, and potential! This charming older 2-story home is situated on a spacious country-style setting with plenty of mature trees and room to roam. This 3 bedroom, 2 bath home offers character throughout with tall ceilings, large rooms, original woodwork touches, and unique stained glass window accents. The home features spacious upstairs bedrooms, a covered front porch, and plenty of natural light throughout. While the property will need repairs and updates, it offers an excellent opportunity for investors or buyers looking to restore a classic home to its full potential. In addition to the home, the property also includes a single wide trailer featuring multiple rooms,
Key facts
- 1.86 acre lot
- 2 parking spots
- Listed 36 days
Property features AI
Finance
- Other: Owner-provided living area and finished area measurements
Exterior
- Parking: Carport with 2 spaces
- Utilities: Public water; Public sewer; Electric service by Ameren
- Home design: Single-family residence; Two levels; Residential property
- Construction: Vinyl siding; Architectural shingle roof
- Exterior features: Level lot with some trees; Chip-and-seal road access
Interior
- Kitchen: Kitchen
- Bedrooms: 3 bedrooms (all on upper level)
- Bathrooms: 2 full bathrooms (one on main level, one on upper level)
- Heating & cooling: Forced air heating; Wall/window air conditioning units
- Interior features: Entry foyer; Office; Living room; Partial basement
- Laundry & utility: Utilities connected: cable, electricity, water, sewer
Neighborhood map
What this means for you Summary
Snapshot
- This is a 3-bed/2.0-bath single-family listed at $130k. Condition is rated poor.
Deal economics
- At list price, monthly cash flow is $64 ($769/yr) — positive.
- The deal already cash-flows at list — no discount required.
- To meet the 1% rule (rent ≥ 1% of price), the offer needs to be $122k (6.3% below list).
- Recommended offer: $122k (6.3% below list) — sets the bar for 1% rule.
Location & tenants
- Location reads 55/100 on livability (#1,242 in IL) — a working-class tenant base; expect higher turnover. Strengths: cost of living A+, housing A+; Watch: crime D-, amenities F, commute F.
- Southwestern CUSD 9 (rural): math 22% / reading 31% proficiency, ranked #276 of 620 in IL (top 44%) — low school quality limits family demand, transient renter base, plan for 1-2y turnover.
- Zoned schools: Brighton North Primary School (305 students, 0% FRL); Southwestern Middle School (math 22% / reading 37%, grade F, #256 of 665 statewide, top 41%, 189 students, 0% FRL); Southwestern High School (math 22% / reading 27%, grade F, #256 of 693 statewide, top 44%, 372 students, 0% FRL) — zoned schools average 0% FRL vs 30% district-wide (30 pts lower); this property's tenant base skews higher-income than the district average.
- Market conditions: 3 active listings in the ZIP; 70 units permitted in Macoupin County in 2024 (0 in 5+ unit buildings).
Forward outlook
- In year one you build about $4k of equity ($898 loan paydown + $3k appreciation (2.7% local appreciation)).
- Macoupin County population projected at -27% by 2050 — secular population decline; favor cash flow + early exit over multi-decade hold.
- At projected returns (2.7% appreciation + 3.0% rent growth), your $36k cash investment doubles in ~6 years — after that, you're playing with house money.
- By year 8, paydown + projected appreciation supports a ~$33k cash-out refi (75% LTV) — recoverable capital for the next deal without selling this one.
Negotiation context
- It's been on market 37 days — a 3% lower offer ($126k) is reasonable based on typical stale-listing flexibility.
Questions for the listing agent
- It's been on market 37 days. Have you received any prior offers? Is the seller open to a 6% concession, seller financing, or rate buy-down credit?
- Have any recent inspections been done? Can we get a copy of the seller's disclosures and any deferred-maintenance estimates?
- Is there a deadline driving the sale (1031 exchange, divorce, estate, relocation)? That informs how much negotiation room exists.
- Schools are D-rated, which usually means shorter tenancies and higher turnover. Who's the typical renter profile here, and what's been the actual vacancy rate?
- Crime grade is D in this area — have there been break-ins, vandalism, or insurance claims at this property in the last 3 years? What carrier currently insures it and at what premium?
- What's the average days-on-market for RENTAL listings here right now (not sales)? A rising rental-DOM trend means longer vacancies and softer asking-rent achievability than the comps imply.
- What's the recent tenant-quality profile in this submarket — average credit score on applications, eviction rate, late-payment / NSF rate, and stable-employment percentage? A property-management company in the area should have these aggregated.
- How much new for-sale + rental construction is in the pipeline within 1–3 miles? Heavy new supply typically softens prices + rents 12–24 months out; constrained supply supports both.
Investment metrics
- 1% rule
- 0.94% ✗
- Cap rate
- 6.88%
- Cash-on-cash
- 2.11%
- DSCR
- 1.09
- GRM
- 8.9
CMA / ARV
- ARV (median comp)
- $169,499
- List price
- $129,900
- Delta
- -23.36%
- Verdict
- UNDERPRICED
- Comps
- 7 within 1.0 mi
Show comp detail 1 sale within ~0.75 mi
| Address | Dist | Beds/Ba | Sqft | Sold | Price | $/sf | Match |
|---|---|---|---|---|---|---|---|
| 918 Keating St | 0.11mi | 3/1.5 | 2,064 (+8%) | 14mo | $164,900 | $80 | 68 |
Match score weights: distance 35% · size 25% · config 20% · recency 20%. Top-matched comps best support the ARV.
Projected returns pro-forma
2.69% appreciation · 3.0% rent growth · sell at horizon
- IRR
- 8.6%
- Equity multiple
- 1.48×
- Total profit
- $17,623
- Equity at exit
- $56,150
- IRR
- 11.3%
- Equity multiple
- 2.64×
- Total profit
- $59,737
- Equity at exit
- $84,818
Cash invested: $36,372 (down + closing). Projections, not guarantees.
Landlord ↔ Tenant lean methodology
- Overall (STATE)
- 43 Moderately Tenant-Leaning
- State Illinois
- 43 Moderately Tenant-Leaning · D+7
- County
- — inherits STATE
- City
- — inherits STATE
ZIP-level market 62685
- Home prices YoY
- 1.0%
- Active inventory
- 3
- Price-to-rent
- 8.9×
Monthly cashflow live
- Estimated rent
- $1,217 medium interval (Pro) →
- Mortgage (P&I)
- −$681
- Tax est. 1.5%
- −$162 /mo · $1,948/yr
- Insurance
- −$54
- HOA
- −$0
- Vacancy / Maint / Mgmt
- −$256
- Net cashflow
- $64
Break-even live
Sensitivity live
| Price | -10% $154 | -5% $109 | +0% $64 | +5% $19 | +10% $-26 |
|---|---|---|---|---|---|
| Rent | -10% $-32 | -5% $16 | +0% $64 | +5% $112 | +10% $160 |
| Rate | -1.0pp $129 | -0.5pp $97 | base $64 | +0.5pp $30 | +1.0pp $-4 |
UW: 25.0% down · 7.5% · 30yr · 1.5% tax · 5.0% vac · 8.0% maint · 8.0% mgmt
Financing live
Cash to close
- Down payment
- $32,475
- Closing costs
- $3,897
- Reserves months
- —
- Total cash needed
- —
Loan-product check · same deal, 3 products live
Conventional
25% down · 7.5% · 30yr
- Down + closing
- —
- Monthly P&I
- —
- Monthly cashflow
- —
- DSCR
- —
- Eligible?
- —
Personal DTI + credit; lowest rate.
DSCR
20% down · 8.5% · 30yr
- Down + closing
- —
- Monthly P&I
- —
- Monthly cashflow
- —
- DSCR
- —
- Eligible?
- —
No personal income docs; deal must DSCR.
Hard money
10% down · 12.0% · 12mo
- Down + closing
- —
- Monthly P&I
- —
- Monthly cashflow
- —
- DSCR
- —
- Eligible?
- —
Short-term bridge; refi at stabilization.
Listing history 16 events
-
2026-06-21days on market $129,900 Active 37 DOM
-
2026-06-18days on market $129,900 Active 34 DOM
-
2026-06-17days on market $129,900 Active 33 DOM
-
2026-06-16days on market $129,900 Active 32 DOM
-
2026-06-15days on market $129,900 Active 31 DOM
-
2026-06-13days on market $129,900 Active 29 DOM
-
2026-06-13days on market $129,900 Active 28 DOM
-
2026-06-09days on market $129,900 Active 25 DOM
-
2026-06-08days on market $129,900 Active 24 DOM
-
2026-06-07days on market $129,900 Active 23 DOM
-
2026-06-03days on market $129,900 Active 19 DOM
-
2026-06-02days on market $129,900 Active 18 DOM
-
2026-06-01days on market $129,900 Active 17 DOM
-
2026-05-31days on market $129,900 Active 16 DOM
-
2026-05-16$129,900 Active 1155-char remark
-
2026-05-15historical $129,900 1155-char remark
ⓘ Source: listings_history table (triggers on properties + properties_extension) + one-shot
backfill from property_details.listing_events for pre-trigger history.
Climate risk First Street
- Flood 1/10 Low FEMA zone X · 0% chance over 30 yrs
- Wildfire 1/10 Low
- Heat 4/10 Moderate 7 d/yr ≥106°F today · 20 d/yr by 30 yrs out
- Wind 2/10 Low 2% chance of damaging wind over 30 yrs
- Air quality 2/10 Low 1 unhealthy d/yr today · 1 by 30 yrs out
Nearby sold comps map
Loading sold comps map…
Walkable amenities ~0.75 mi
Loading nearby amenities…
Taxation est. · year 1
- Rental income
- $14,609
- − Mortgage interest
- −$7,276
- − Property taxes
- −$1,948
- − Insurance
- −$650
- − Repairs & maintenance
- −$1,169
- − Management
- −$1,169
- − Depreciation
- −$3,779
- Taxable loss
- −$1,382
- Est. tax savings @ 24.0%
- +$332
- After-tax cash flow
- $1,100/yr
For passive investors: Depreciation is non-cash, so a rental often shows a tax loss while cash-flowing — sheltering income. Rental losses are passive: they offset passive income freely, and up to $25,000/yr can offset ordinary (W-2) income if you actively participate and your MAGI is under $100k (phasing out to $0 by $150k); unused losses carry forward. On sale, claimed depreciation is recaptured at up to 25%, and gains may owe capital-gains tax (a 1031 exchange can defer both). Figures are a year-1 estimate at your 24.0% rate — not tax advice; consult a CPA.
Condition & rehab AI · 13 photos
This older 2-story home requires extensive renovations to bring it up to modern standards, significantly impacting its resale and rental value. Immediate repairs and updates are needed to address the poor condition of the kitchen, bathrooms, exterior, and HVAC system.
Repairs flagged
- Major kitchen cabinets — severely dated and worn
- Major bathroom fixtures — outdated and in poor condition
- Major roof — visible wear
- Major exterior siding — weathered and peeling
- Major flooring — dated and worn carpet
- Major interior walls — dated paint and peeling
- Major HVAC — outdated and likely inefficient
Value-add opportunities
- Resale kitchen renovation — modernizing the kitchen would significantly increase the home's appeal
- Resale bathroom renovation — upgrading the bathrooms would enhance the home's value
- Both exterior paint and siding — a fresh coat of paint and new siding would improve curb appeal and increase both resale and rental value
- Both HVAC system — replacing the outdated HVAC system would improve comfort and energy efficiency, attracting more buyers and renters
Renovation cost estimate screening
| Repair item | Severity | Est. cost |
|---|---|---|
| kitchen cabinets · severely dated and worn | Major | $15,000–50,000 |
| bathroom fixtures · outdated and in poor condition | Major | $15,000–50,000 |
| roof · visible wear | Major | $15,000–50,000 |
| exterior siding · weathered and peeling | Major | $15,000–50,000 |
| flooring · dated and worn carpet | Major | $15,000–50,000 |
| interior walls · dated paint and peeling | Major | $15,000–50,000 |
| HVAC · outdated and likely inefficient | Major | $15,000–50,000 |
| Total estimated repair cost · 7 items | $105,000–350,000 |
Value-add ROI direction
- Resale kitchen renovation — modernizing the kitchen would significantly increase the home's appeal ↑
- Resale bathroom renovation — upgrading the bathrooms would enhance the home's value ↑
- Both exterior paint and siding — a fresh coat of paint and new siding would improve curb appeal and increase both resale and rental value ↑
- Both HVAC system — replacing the outdated HVAC system would improve comfort and energy efficiency, attracting more buyers and renters ↑
ⓘ Cost ranges are severity-bucket heuristics (US national rule-of-thumb). Get contractor quotes + a written scope before underwriting a rehab budget.
Schools (NCES district)
- District
- Southwestern CUSD 9
- NCES district ID
- 1731500
- Math proficiency
- 22% ▼ -8.00%
- Reading proficiency
- 31% ▼ -12.00%
- Median HH income
- $61,022
- Composite
- 24.32/100
- National rank
- #7706
- State rank
- #276 of 620 in IL
Livability — Shipman
- Score
- 55/100
- State rank
- #1242
- US rank
- #23282
Category grades
Schools grade is shown separately in the Schools card above.
Census & demographics
- Census place
- Shipman, IL
- Population (ZIP)
- 1,648
Population outlook (Macoupin County) Hauer SSP2
- Today (2025)
- 42,867 people
- By 2030
- 40,796 · -4.8%
- By 2040
- 36,135 · -15.7%
- By 2050
- 31,469 · -26.6%
- By 2075
- 22,102 · -48.4%
- By 2100
- 15,380 · -64.1%
Race, ethnicity, and origin ACS 2023
- Neighborhood character
- Predominantly White (84%)
- Race & ethnicity
- White 84% Black 15%
- Common ancestry
- Romanian 4% Slovak 3% Italian 1%
- Foreign-born
- 0%
Political lean MEDSL · Macoupin
- 2024 margin
- Solid R (+39.2) · D 29.4% · R 68.7% · Other 1.9%
- 2008→2024 swing
- -49.0pp toward R · 2008: 9.8pp · 2024: -39.2pp
- All cycles
- 2024: R+39.2 2020: R+36.5 2016: R+35.0 2012: R+7.0 2008: D+9.8
Not yet ingested
- Civics
- —
Market trends
- HPI YoY
- ▲ 2.69%
- Current HPI
- 267.4009
- Rent YoY
- —
- Metro
- —
- State GDP YoY
- ▲ 1.59%
- F500 in state
- 60
Industry mix (Fortune 500 HQ in IL)
| Industry | F500 HQs | Revenue |
|---|---|---|
| Insurance | 4 | $201B |
|
||
| Consumer Goods | 4 | $87B |
|
||
| Industrial Machinery | 3 | $64B |
|
||
| Healthcare | 2 | $55B |
|
||
| Retail / Pharmacy | 1 | $148B |
|
||
| Agriculture / Food | 1 | $86B |
|
||
Price history
+0.0% since first listed2 events — show timeline
- 2026-05-16 Listed $129,900 MARIS as Distributed by MLS Grid
- 2026-05-15 Coming Soon $129,900 MARIS as Distributed by MLS Grid
Cash-flow waterfall
monthlySold comps — $/sqft
last 12 mo · ≤1 miLoading sold comps…