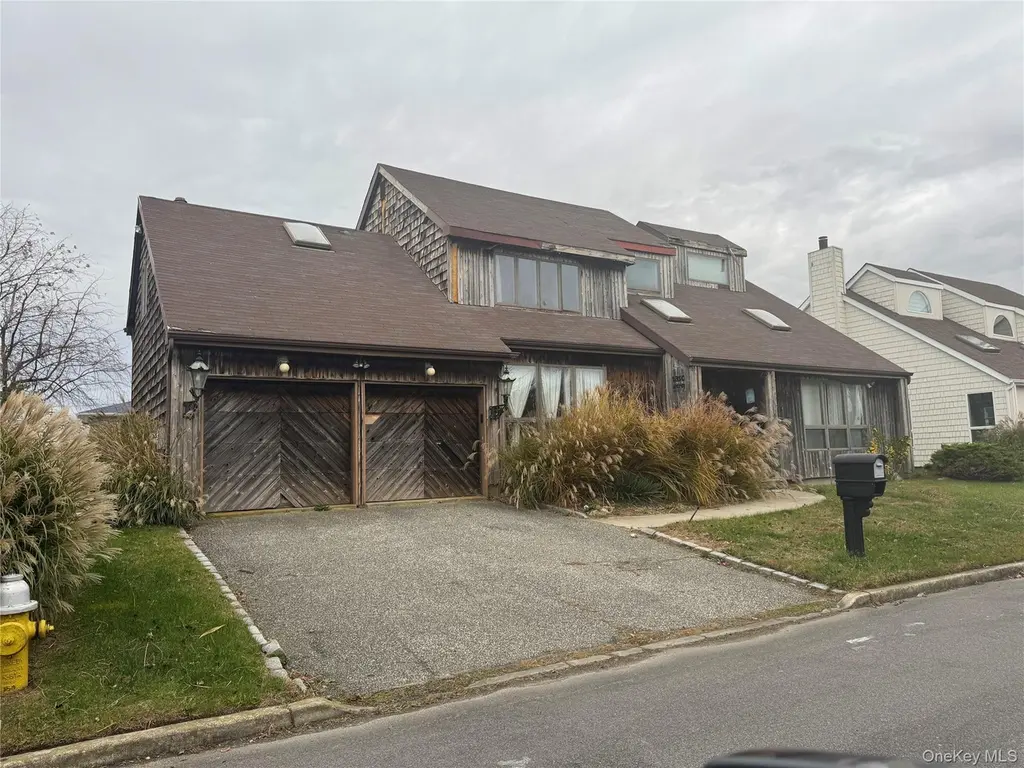
815 Anthony Dr · Lindenhurst, NY
Flood risk 9/10 · Severe
- FEMA flood zone
- X (shaded)
- Chance of flooding over 30 yrs
- 0.99%
- Est. flood insurance / yr
- $473 – $860
Fire risk 1/10 · Minimal
- Est. fire insurance / yr
- $691 – $1,283
Heat risk 5/10 · Moderate
- Hot days now (above 94°F)
- 7 days/yr
- Hot days in 30 yrs
- 17 days/yr
Wind risk 7/10 · Major
- Chance of severe wind over 30 yrs
- 78.0%
Air-quality risk 4/10 · Minor
- Unhealthy air days now
- 5 days/yr
- Unhealthy air days in 30 yrs
- 7 days/yr
Risk factors via First Street. Map © Google.
Why this score? — see what drove the D+ grade
The composite is a weighted blend of 9 inputs, each scored 0–100. Each bar is that input's sub-score; the figure is the points it added to the 100-point composite (weight × sub-score).
- ARV discount +15.0/15.0
- Cash flow +11.0/30.0
- Schools +6.1/10.0
- 1% rule +3.9/10.0
- Livability +3.8/5.0
- DSCR +3.2/10.0
- Rent growth +2.5/5.0
- Condition / age +2.5/5.0
- Appreciation +0.0/10.0
$494,000
🖨 Deal sheet (PDF) 📄 Offer letter ✓ Due diligence
Listing remarks
Bank owned property, sold As Is. Property is located in Shore Park Estates HOA. Amenities include private beach and marina.
Key facts
- 7,505 sq ft lot
- 2 garage spots
- Built 1989
Property features AI
Finance
- Other: Property subtype: Single Family Residence
- HOA & community: Has association; Monthly association fee of $250; Association amenities include a boat dock and clubhouse; Association fee covers other items
Exterior
- Parking: Attached garage and driveway; 2-car garage; No carport
- Utilities: Public sewer; Electricity connected; Natural gas connected; Public water connected; Public trash collection
- Home design: Single family residence; Living area reported from public records
- Construction: Frame construction; Other construction materials; Crawl space foundation; Built prior to or in public records (year not provided)
- Exterior features: Cul-de-sac lot; Not waterfront
Interior
- Kitchen: No appliances listed
- Bedrooms: Total rooms: 10 (includes bedrooms and living spaces)
- Flooring: Wood flooring
- Bathrooms: 2 full bathrooms; 1 half bathroom
- Heating & cooling: Central air conditioning; Natural gas heating; Other heating
- Interior features: Other interior features; One fireplace
- Laundry & utility: Laundry area (other)
Neighborhood map
What this means for you Summary
Snapshot
- This is a 4-bed/2.5-bath single-family listed at $494k.
Deal economics
- At list price, monthly cash flow is $-260 ($-3k/yr) — negative.
- To cash-flow at today's rent, offer at most $456k (7.6% below list).
- To meet the 1% rule (rent ≥ 1% of price), the offer needs to be $438k (11.4% below list).
- Recommended offer: $438k (11.4% below list) — sets the bar for 1% rule.
- Cap rate 5.8% vs local median 3.0% in Lindenhurst — top-decile yield for the area; either an underpriced asset or a hidden risk that comps aren't pricing in. Stress-test before assuming the spread holds.
Location & tenants
- Location reads 75/100 on livability (#260 in NY, #4,112 nationally) — a middle-class / working-renter tenant base. Strengths: commute A+, employment A+, housing A+; Watch: amenities D+, cost of living F, health & safety F.
- Lindenhurst Union Free School District (suburban): math 64% / reading 72% proficiency, ranked #139 of 590 in NY (top 24%) — acceptable for families but not a draw, mixed tenant base, ~2y average lease.
- Zoned schools: Harding Avenue School (math 64% / reading 84%, grade A, #314 of 2,108 statewide, top 17%, 303 students, 38% FRL); Lindenhurst Middle School (math 45% / reading 62%, grade C+, #228 of 729 statewide, top 31%, 1,284 students, 44% FRL); Lindenhurst Senior High School (math 86% / reading 95%, grade A+, #231 of 1,100 statewide, top 21%, 1,897 students, 41% FRL) — zoned schools average 41% FRL vs 21% district-wide (20 pts higher); higher-poverty schools than district average — tighter screening recommended.
- Market conditions: 205 active listings in the ZIP; 5 comparable units currently listed for rent nearby; rentals leasing fast (median 0d on market — plan ~1-2 weeks tenant-placement turnaround); high-income renter base; 1,366 units permitted in Suffolk County in 2024 (216 in 5+ unit buildings).
- This rent runs 41% of the median local income ($128k/yr) — at the standard rent-burdened threshold; future hikes will face affordability resistance.
Forward outlook
- Local home prices are declining (-3.0%/yr); year-one equity from $3k of loan paydown is wiped out by about $15k of value loss. Plan a longer hold.
- Suffolk County population projected to shrink 5% by 2050 — rents likely to lag national; underwrite the cash flow, not the appreciation.
Negotiation context
- It's been on market 36 days — a 3% lower offer ($479k) is reasonable based on typical stale-listing flexibility.
- 4 sale attempts since 9y ago with the ask held roughly flat each time — persistent listings suggest the price (not the market) is what's stuck; bring a comps-based counter.
Risks & watch-outs
- Watch-outs: flood insurance adds $56/mo.
- Climate carrying-cost: severe flood risk; major wind risk, 78% chance of damaging wind over 30y; extreme-heat days projected 7→17/yr by 2055 (HVAC capex compounding) — expect insurance premiums to compound above CPI over the hold.
Questions for the listing agent
- What do current leases actually rent for vs. the listed asking? Can we see a recent rent roll and the last 12 months of T-12 income?
- It's been on market 36 days. Have you received any prior offers? Is the seller open to a 11% concession, seller financing, or rate buy-down credit?
- What's the actual annual flood-insurance premium (NFIP or private), and is the property in a SFHA with mandatory coverage?
- What does the HOA fee cover, when was the last increase, and are there any pending special assessments or reserve-fund shortfalls?
- Is there a deadline driving the sale (1031 exchange, divorce, estate, relocation)? That informs how much negotiation room exists.
- Schools are B-rated — typically a magnet for longer-tenancy family renters. What's the average tenant stay here, and is there a school-zone premium baked into asking?
- The area grade is low — what's the realistic commute time and amenity access for the typical tenant pool here? Any planned neighborhood developments (good or bad) we should know about?
- What's the average days-on-market for RENTAL listings here right now (not sales)? A rising rental-DOM trend means longer vacancies and softer asking-rent achievability than the comps imply.
- What's the recent tenant-quality profile in this submarket — average credit score on applications, eviction rate, late-payment / NSF rate, and stable-employment percentage? A property-management company in the area should have these aggregated.
- How much new for-sale + rental construction is in the pipeline within 1–3 miles? Heavy new supply typically softens prices + rents 12–24 months out; constrained supply supports both.
Investment metrics
- 1% rule
- 0.89% ✗
- Cap rate
- 5.80%
- Cash-on-cash
- -1.78%
- DSCR
- 0.92
- GRM
- 9.4
CMA / ARV
- ARV (on-the-fly)
- $781,226
- Comps found
- 12
Show comp detail 12 sales within ~0.75 mi
| Address | Dist | Beds/Ba | Sqft | Sold | Price | $/sf | Match |
|---|---|---|---|---|---|---|---|
| 891 S Bay St | 0.09mi | 4/2.0 | 2,199 (-6%) | 3mo | $450,000 | $205 | 82 |
| 68 Knoll St | 0.26mi | 5/2.5 (+1) | 2,500 (+7%) | 5mo | $650,000 | $260 | 67 |
| 745 S 9th St | 0.65mi | 4/2.0 | 2,300 (-2%) | 3mo | $620,000 | $270 | 62 |
| 881 Surf St | 0.09mi | 3/3.0 (-1) | 2,000 (-14%) | 4mo | $630,000 | $315 | 61 |
| 815 S 4th St | 0.41mi | 5/2.0 (+1) | 2,128 (-9%) | 1mo | $780,000 | $367 | 58 |
| 909 S 5th St | 0.35mi | 4/3.0 | 2,000 (-14%) | 0mo | $960,000 | $480 | 57 |
| 630 Shore Rd | 0.55mi | 4/2.0 | 2,516 (+8%) | 5mo | $740,000 | $294 | 56 |
| 3 Garfield Pl | 0.63mi | 4/3.0 | 2,200 (-6%) | 5mo | $785,000 | $357 | 55 |
| 15 E Clearwater Rd | 0.73mi | 4/2.0 | 2,200 (-6%) | 2mo | $735,000 | $334 | 53 |
| 45 Inlet Dr | 0.71mi | 3/3.0 (-1) | 2,110 (-10%) | 7mo | $923,500 | $438 | 38 |
| 125 Spruce St | 0.72mi | 5/3.0 (+1) | 2,003 (-14%) | 3mo | $810,000 | $404 | 32 |
| 651 Madison Ave | 0.62mi | 3/1.5 (-1) | 2,000 (-14%) | 7mo | $605,000 | $303 | 32 |
Match score weights: distance 35% · size 25% · config 20% · recency 20%. Top-matched comps best support the ARV.
Projected returns pro-forma
-3.0% appreciation · 3.0% rent growth · sell at horizon
- IRR
- -20.0%
- Equity multiple
- 0.30×
- Total profit
- $-96,386
- Equity at exit
- $73,657
- IRR
- -12.8%
- Equity multiple
- 0.25×
- Total profit
- $-104,263
- Equity at exit
- $42,712
Cash invested: $138,320 (down + closing). Projections, not guarantees.
Landlord ↔ Tenant lean methodology
- Overall (STATE)
- 15 Strongly Tenant-Friendly
- State New York
- 15 Strongly Tenant-Friendly · D+10
- County
- — inherits STATE
- City
- — inherits STATE
ZIP-level market 11757
- Active inventory
- 205
- Price-to-rent
- 9.4×
Monthly cashflow live
- Estimated rent
- $4,378 medium interval (Pro) →
- Mortgage (P&I)
- −$2,591
- Tax est. 1.5%
- −$618 /mo · $7,410/yr
- Insurance
- −$206
- Flood insurance flood zone
- −$56 /mo · $666/yr
- HOA
- −$250
- Vacancy / Maint / Mgmt
- −$919
- Net cashflow
- $-260
Break-even live
Sensitivity live
| Price | -10% $81 | -5% $-90 | +0% $-260 | +5% $-431 | +10% $-602 |
|---|---|---|---|---|---|
| Rent | -10% $-606 | -5% $-433 | +0% $-260 | +5% $-88 | +10% $85 |
| Rate | -1.0pp $-12 | -0.5pp $-135 | base $-260 | +0.5pp $-388 | +1.0pp $-519 |
UW: 25.0% down · 7.5% · 30yr · 1.5% tax · 5.0% vac · 8.0% maint · 8.0% mgmt
Financing live
Cash to close
- Down payment
- $123,500
- Closing costs
- $14,820
- Reserves months
- —
- Total cash needed
- —
Loan-product check · same deal, 3 products live
Conventional
25% down · 7.5% · 30yr
- Down + closing
- —
- Monthly P&I
- —
- Monthly cashflow
- —
- DSCR
- —
- Eligible?
- —
Personal DTI + credit; lowest rate.
DSCR
20% down · 8.5% · 30yr
- Down + closing
- —
- Monthly P&I
- —
- Monthly cashflow
- —
- DSCR
- —
- Eligible?
- —
No personal income docs; deal must DSCR.
Hard money
10% down · 12.0% · 12mo
- Down + closing
- —
- Monthly P&I
- —
- Monthly cashflow
- —
- DSCR
- —
- Eligible?
- —
Short-term bridge; refi at stabilization.
Rent comps 5 comps
| Address | Beds | Baths | Sqft | Rent | $/sqft | DOM | Units | Dist |
|---|---|---|---|---|---|---|---|---|
| 762 Pecan St Lindenhurst, NY | 5.0 | 4.0 | 2970 | $5,500 | $1.85 | 0d | 1 | 0.44mi |
| 23 W Alhambra Ave Lindenhurst, NY | 3.0 | 1.0 | 2070 | $3,600 | $1.74 | 0d | 1 | 1.11mi |
| 75 E Hoffman Ave Lindenhurst, NY | 3.0 | 1.0–2.0 | 1125 | $4,750 | $4.22 | 0d | 1 | 1.38mi |
| 223 Audley Ct Copiague, NY | 3.0 | 1.0 | 2184 | $3,500 | $1.60 | 12d | 1 | 1.42mi |
| 125 W Hoffman Ave Lindenhurst, NY | 3.0 | 2.0 | 2000 | $3,500 | $1.75 | 45d | 1 | 1.45mi |
HOA detail
- Monthly dues
- $250 · $3,000/yr
Listing history 10 events
-
2026-04-23status Pending
-
2026-03-18$494,000 Active
-
2018-11-06historical
-
2018-10-01$399,000 New
-
2018-09-30historical
-
2018-05-07$399,000 New
-
2018-04-29historical
-
2017-12-12price $400,000
-
2017-04-20$449,000 New
-
2006-10-16soldstatus $608,000
ⓘ Source: listings_history table (triggers on properties + properties_extension) + one-shot
backfill from property_details.listing_events for pre-trigger history.
Climate risk First Street
- Flood 9/10 Extreme FEMA zone X (shaded) · 99% chance over 30 yrs
- Wildfire 1/10 Low
- Heat 5/10 Major 7 d/yr ≥94°F today · 17 d/yr by 30 yrs out
- Wind 7/10 Severe 78% chance of damaging wind over 30 yrs
- Air quality 4/10 Moderate 5 unhealthy d/yr today · 7 by 30 yrs out
Nearby sold comps map
Loading sold comps map…
Walkable amenities ~0.75 mi
Loading nearby amenities…
Taxation est. · year 1
- Rental income
- $52,541
- − Mortgage interest
- −$27,672
- − Property taxes
- −$7,410
- − Insurance
- −$3,136
- − Repairs & maintenance
- −$4,203
- − Management
- −$4,203
- − HOA
- −$3,000
- − Depreciation
- −$14,371
- Taxable loss
- −$11,454
- Est. tax savings @ 24.0%
- +$2,749
- After-tax cash flow
- $-377/yr
For passive investors: Depreciation is non-cash, so a rental often shows a tax loss while cash-flowing — sheltering income. Rental losses are passive: they offset passive income freely, and up to $25,000/yr can offset ordinary (W-2) income if you actively participate and your MAGI is under $100k (phasing out to $0 by $150k); unused losses carry forward. On sale, claimed depreciation is recaptured at up to 25%, and gains may owe capital-gains tax (a 1031 exchange can defer both). Figures are a year-1 estimate at your 24.0% rate — not tax advice; consult a CPA.
Schools (NCES district)
- District
- Lindenhurst Union Free School District
- NCES district ID
- 3617380
- Math proficiency
- 64% ▼ -2.00%
- Reading proficiency
- 72% ▲ 1.00%
- Median HH income
- $82,624
- Composite
- 60.8/100
- National rank
- #820
- State rank
- #139 of 590 in NY
Livability — Lindenhurst
- Score
- 75/100
- State rank
- #260
- US rank
- #4112
Category grades
Schools grade is shown separately in the Schools card above.
Census & demographics
- Census place
- Lindenhurst, NY
- County
- Suffolk County · 679,920 people
- City population
- 44,413
- Metro
- New York-Newark-Jersey City, NY-NJ-PA
- Population (ZIP)
- 44,413
- Household income
- $127,889
- Rent vs Own
- Severe rent burden
- 580.0
Population outlook (Suffolk County) Hauer SSP2
- Today (2025)
- 1,505,262 people
- By 2030
- 1,498,318 · -0.5%
- By 2040
- 1,471,101 · -2.3%
- By 2050
- 1,424,848 · -5.3%
- By 2075
- 1,337,157 · -11.2%
- By 2100
- 1,217,720 · -19.1%
Race, ethnicity, and origin ACS 2023
- Neighborhood character
- Predominantly White (71%)
- Race & ethnicity
- White 71% Hispanic / Latino 20% Two or more races 9% Black 5% Asian 3%
- Hispanic origin (detail)
- Puerto Rican 5% Dominican 6%
- Common ancestry
- Romanian 7% Subsaharan African 3% Scotch-Irish 1%
- Foreign-born
- 18% · Canada, Jamaica, China
- Languages at home
- 71% English-only · Spanish 14% Russian/Polish/Slavic 8% Other Indo-European 3%
Political lean MEDSL · Suffolk
- 2024 margin
- Lean R (+10.0) · D 45.0% · R 55.0%
- 2008→2024 swing
- -16.0pp toward R · 2008: 6.0pp · 2024: -10.0pp
- All cycles
- 2024: R+10.0 2020: R+0.0 2016: R+8.2 2012: D+2.9 2008: D+6.0
Not yet ingested
- Civics
- —
Market trends
- HPI YoY
- ▼ -743.47%
- Current HPI
- 295.1742
- Rent YoY
- —
- Metro
- New York-Newark-Jersey City, NY-NJ-PA
- State GDP YoY
- ▲ 2.60%
- F500 in state
- 92
Industry mix (Fortune 500 HQ in NY)
| Industry | F500 HQs | Revenue |
|---|---|---|
| Financial Services | 10 | $950B |
|
||
| Consumer Goods | 9 | $162B |
|
||
| Insurance | 4 | $225B |
|
||
| Telecommunications | 2 | $144B |
|
||
| Pharmaceuticals | 2 | $112B |
|
||
| Media / Entertainment | 2 | $69B |
|
||
Price history
-18.8% since first listed10 events — show timeline
- 2026-04-23 Pending — OneKey® MLS as Distributed by MLS Grid
- 2026-03-18 Listed $494,000 OneKey® MLS as Distributed by MLS Grid
- 2018-11-06 Listing Removed — OneKey® MLS as Distributed by MLS Grid
- 2018-10-01 Listed $399,000 OneKey® MLS as Distributed by MLS Grid
- 2018-09-30 Listing Removed — OneKey® MLS as Distributed by MLS Grid
- 2018-05-07 Listed $399,000 OneKey® MLS as Distributed by MLS Grid
- 2018-04-29 Listing Removed — OneKey® MLS as Distributed by MLS Grid
- 2017-12-12 Price Changed $400,000 OneKey® MLS as Distributed by MLS Grid
- 2017-04-20 Listed $449,000 OneKey® MLS as Distributed by MLS Grid
- 2006-10-16 Sold (Public Records) $608,000 Public Records
Property tax history
+7.4%/yrLatest (2025): $34,002 · +38.6% YoY. Source: county tax records.
Cash-flow waterfall
monthlySold comps — $/sqft
last 12 mo · ≤1 miLoading sold comps…