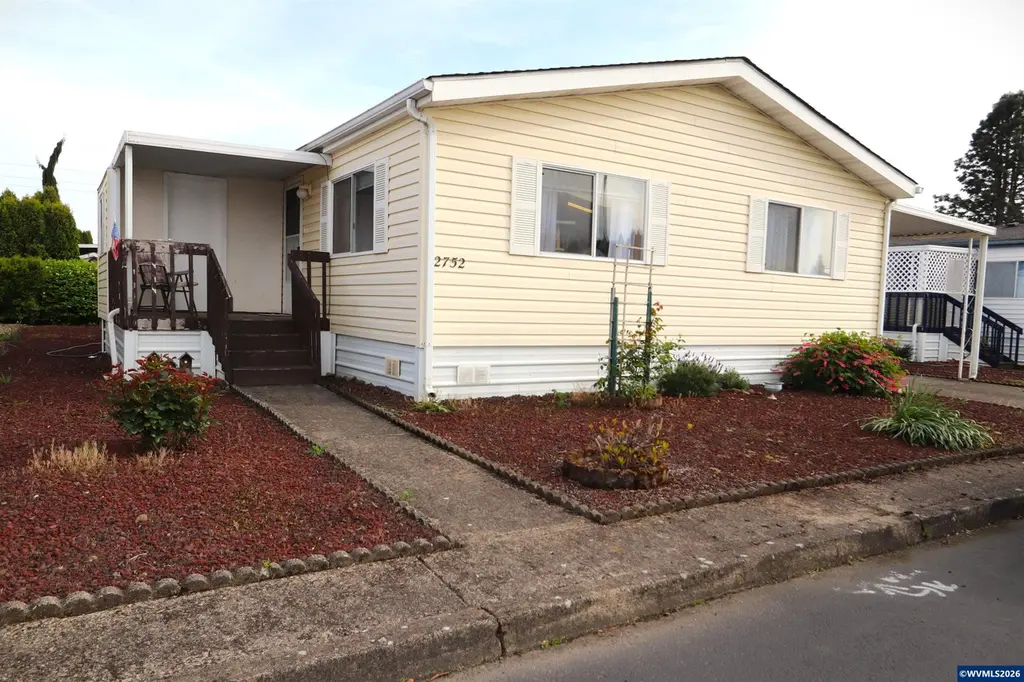
2752 Oakland Lp SE · Salem, OR
Flood risk 1/10 · Minimal
- FEMA flood zone
- X (unshaded)
- Chance of flooding over 30 yrs
- 0.0%
- Est. flood insurance / yr
- $507 – $1,088
Fire risk 3/10 · Minor
- Est. fire insurance / yr
- $498 – $926
Heat risk 4/10 · Minor
- Hot days now (above 91°F)
- 7 days/yr
- Hot days in 30 yrs
- 15 days/yr
Wind risk 1/10 · Minimal
- Chance of severe wind over 30 yrs
- —
Air-quality risk 9/10 · Severe
- Unhealthy air days now
- 12 days/yr
- Unhealthy air days in 30 yrs
- 13 days/yr
Risk factors via First Street. Map © Google.
Why this score? — see what drove the C- grade
The composite is a weighted blend of 9 inputs, each scored 0–100. Each bar is that input's sub-score; the figure is the points it added to the 100-point composite (weight × sub-score).
- Cash flow +15.0/30.0
- ARV discount +14.5/15.0
- 1% rule +5.0/10.0
- DSCR +5.0/10.0
- Livability +4.0/5.0
- Schools +3.7/10.0
- Rent growth +3.2/5.0
- Condition / age +2.2/5.0
- Appreciation +0.0/10.0
$35,000
🖨 Deal sheet 📄 Offer letter ✓ Due diligence
Listing remarks MLS
Fantastic Opportunity for this 1991 Goldenwest Double Wide located at Meadowlark Mobile Manor, 55+ community. 1199 square feet with open floor plan that flows well from the living room into the dining room and kitchen with vaulted ceilings. Spacious Primary bedroom with bathroom, total of 2 bedroom and 2 bathroom and interior utility room. Attached carport, garden shed, and additional storage space.
Key facts
- Garage
- Built 1991
- Listed 61 days
Neighborhood map
What this means for you Summary
Snapshot
- This is a 2-bed/2.0-bath manufactured listed at $35k. Condition is rated fair.
Deal economics
- At list price, monthly cash flow is $1k ($13k/yr) — positive.
- The deal already cash-flows at list — no discount required.
- Meets the 1% rule at list price ($2k rent vs $35k).
- Recommended offer: $33k (6.0% below list) — sets the bar for market timing.
- Cap rate 42.4% vs local median 2.9% in Salem — top-decile yield for the area; either an underpriced asset or a hidden risk that comps aren't pricing in. Stress-test before assuming the spread holds.
Location & tenants
- Location reads 79/100 on livability (#59 in OR, #2,084 nationally) — a middle-class / working-renter tenant base. Strengths: amenities A+, commute A+, housing A+; Watch: schools D, crime F.
- Salem-Keizer SD 24J (urban): math 34% / reading 47% proficiency, ranked #103 of 183 in OR (top 56%) — families likely to look elsewhere, expect single-tenant / working-renter base with shorter leases.
- Market conditions: Rents rising (+2.6%/yr); 133 active listings in the ZIP; 15 comparable units currently listed for rent nearby; rentals leasing fast (median 14d on market — plan ~1-2 weeks tenant-placement turnaround); solid renter incomes; 1,591 units permitted in Marion County in 2024 (716 in 5+ unit buildings).
Forward outlook
- Local home prices are declining (-3.0%/yr); year-one equity from $242 of loan paydown is wiped out by about $1k of value loss. Plan a longer hold.
- Marion County population projected at +17% by 2050 — long-run rental-demand tailwind backs the buy-and-hold thesis.
- At projected returns (-3.0% appreciation + 2.6% rent growth), your $10k cash investment doubles in ~1 year — after that, you're playing with house money.
Negotiation context
- It's been on market 61 days — a 6% lower offer ($33k) is reasonable based on typical stale-listing flexibility.
- 2 sale attempts; this cycle's ask has dropped $5k (12%) from the opening price — seller is motivated, your offer sets the floor, not the list.
- Current owner paid $30k; 17% above their basis — modest negotiation headroom, anchor on the comps not their cost.
Questions for the listing agent
- It's been on market 61 days. Have you received any prior offers? Is the seller open to a 6% concession, seller financing, or rate buy-down credit?
- Have any recent inspections been done? Can we get a copy of the seller's disclosures and any deferred-maintenance estimates?
- Why hasn't it sold? Are there any deal-killer items the seller is aware of (foundation, flood, title, zoning, code violations)?
- Is there a deadline driving the sale (1031 exchange, divorce, estate, relocation)? That informs how much negotiation room exists.
- Schools are D-rated, which usually means shorter tenancies and higher turnover. Who's the typical renter profile here, and what's been the actual vacancy rate?
- Crime grade is F in this area — have there been break-ins, vandalism, or insurance claims at this property in the last 3 years? What carrier currently insures it and at what premium?
- What's the average days-on-market for RENTAL listings here right now (not sales)? A rising rental-DOM trend means longer vacancies and softer asking-rent achievability than the comps imply.
- What's the recent tenant-quality profile in this submarket — average credit score on applications, eviction rate, late-payment / NSF rate, and stable-employment percentage? A property-management company in the area should have these aggregated.
- How much new for-sale + rental construction is in the pipeline within 1–3 miles? Heavy new supply typically softens prices + rents 12–24 months out; constrained supply supports both.
Investment metrics
- 1% rule
- 4.69% ✓
- Cap rate
- 42.45%
- Cash-on-cash
- 129.12%
- DSCR
- 6.75
- GRM
- 1.8
CMA / ARV
- ARV (median comp)
- $41,448
- List price
- $35,000
- Delta
- -15.56%
- Verdict
- UNDERPRICED
- Comps
- 12 within 1.0 mi
Show comp detail 12 sales within ~0.75 mi
| Address | Dist | Beds/Ba | Sqft | Sold | Price | $/sf | Match |
|---|---|---|---|---|---|---|---|
| 2730 Oakland Lp SE | 0.02mi | 2/2.0 | 1,188 (0%) | 6mo | $35,000 | $29 | 94 |
| 2750 Oakland Loop SE | 0.01mi | 2/2.0 | 1,188 (0%) | 9mo | $40,000 | $34 | 92 |
| 4454 Eden St SE | 0.10mi | 2/2.0 | 1,104 (-7%) | 11mo | $112,000 | $101 | 74 |
| 2232 42nd Ave SE #792 | 0.28mi | 2/2.0 | 1,152 (-3%) | 10mo | $34,000 | $30 | 74 |
| 2232 42nd Ave SE #704 | 0.28mi | 3/2.0 (+1) | 1,288 (+8%) | 1mo | $58,000 | $45 | 67 |
| 2232 42nd Ave SE #913 | 0.28mi | 2/2.0 | 1,152 (-3%) | 19mo | $50,000 | $43 | 66 |
| 4497 Essex St SE | 0.10mi | 3/2.0 (+1) | 1,296 (+9%) | 14mo | $115,000 | $89 | 63 |
| 2232 42nd Ave SE #776 | 0.28mi | 3/2.0 (+1) | 1,296 (+9%) | 12mo | $160,000 | $123 | 57 |
| 2232 42nd Ave SE #819 | 0.28mi | 2/2.0 | 1,026 (-14%) | 15mo | $76,000 | $74 | 51 |
| 2200 SE Lancaster Dr Unit 13D | 0.43mi | 2/2.0 | 1,056 (-11%) | 13mo | $135,000 | $128 | 51 |
| 2200 SE Lancaster Dr | 0.44mi | 2/2.0 | 1,056 (-11%) | 13mo | $135,000 | $128 | 50 |
| 2410 Lancaster Dr #949 | 0.31mi | 3/3.0 (+1) | 1,296 (+9%) | 17mo | $81,000 | $63 | 48 |
Match score weights: distance 35% · size 25% · config 20% · recency 20%. Top-matched comps best support the ARV.
Projected returns pro-forma
-3.0% appreciation · 2.62% rent growth · sell at horizon
- IRR
- —
- Equity multiple
- 7.21×
- Total profit
- $60,891
- Equity at exit
- $5,219
- IRR
- —
- Equity multiple
- 14.99×
- Total profit
- $137,060
- Equity at exit
- $3,026
Cash invested: $9,800 (down + closing). Projections, not guarantees.
Landlord ↔ Tenant lean methodology
- Overall (STATE)
- 28 Tenant-Leaning
- State Oregon
- 28 Tenant-Leaning · D+6
- County
- — inherits STATE
- City
- — inherits STATE
ZIP-level market 97317
- Rents YoY
- 2.6%
- Active inventory
- 133
- Price-to-rent
- 1.8×
Monthly cashflow live
- Estimated rent
- $1,641 high interval (Pro) →
- Mortgage (P&I)
- −$184
- Tax est. 1.5%
- −$44 /mo · $525/yr
- Insurance
- −$15
- HOA
- −$0
- Vacancy / Maint / Mgmt
- −$345
- Net cashflow
- $1,055
Break-even live
UW: 25.0% down · 7.5% · 30yr · 1.5% tax · 5.0% vac · 8.0% maint · 8.0% mgmt
Financing live
Cash to close
- Down payment
- $8,750
- Closing costs
- $1,050
- Reserves months
- —
- Total cash needed
- —
Loan-product check · same deal, 3 products live
Conventional
25% down · 7.5% · 30yr
- Down + closing
- —
- Monthly P&I
- —
- Monthly cashflow
- —
- DSCR
- —
- Eligible?
- —
Personal DTI + credit; lowest rate.
DSCR
20% down · 8.5% · 30yr
- Down + closing
- —
- Monthly P&I
- —
- Monthly cashflow
- —
- DSCR
- —
- Eligible?
- —
No personal income docs; deal must DSCR.
Hard money
10% down · 12.0% · 12mo
- Down + closing
- —
- Monthly P&I
- —
- Monthly cashflow
- —
- DSCR
- —
- Eligible?
- —
Short-term bridge; refi at stabilization.
Rent comps 15 comps
| Address | Beds | Baths | Sqft | Rent | $/sqft | DOM | Units | Dist |
|---|---|---|---|---|---|---|---|---|
| 2728 Lancaster Dr SE Unit 2728-14 Salem, OR | 2.0 | 1.5 | 1000 | $1,195 | $1.20 | 43d | 1 | 0.22mi |
| 4665 Campbell Dr SE Salem, OR | 1.0–3.0 | 1.0–2.0 | 923 | $1,699 | $1.84 | 13d | 1 | 0.25mi |
| 4435 Campbell Dr SE Salem, OR | 2.0 | 1.0 | 807 | $1,445 | $1.79 | 23d | 1 | 0.35mi |
| 4243 Campbell Dr SE Unit 4243 Salem, OR | 3.0 | 1.0 | 936 | $1,550 | $1.66 | 13d | 1 | 0.48mi |
| 1447 Connecticut St SE Salem, OR | 3.0 | 2.0 | 1258 | $2,675 | $2.13 | 43d | 1 | 0.59mi |
| 1569 Whitaker Dr SE Salem, OR | 1.0–3.0 | 1.0–2.0 | 933 | $1,799 | $1.93 | 13d | 1 | 0.68mi |
| 4976 Turquoise Ave SE Salem, OR | 2.0 | 2.0 | 918 | $1,495 | $1.63 | 13d | 5 | 0.80mi |
| 1029 Raffon Ct SE Unit AR7171-3 Salem, OR | 2.0 | 1.5 | 927 | $1,700 | $1.83 | 23d | 1 | 0.88mi |
| 4776 Buffalo Dr SE Salem, OR | 3.0 | 1.0 | 1369 | $2,150 | $1.57 | 43d | 1 | 0.98mi |
| 4807 Chinook Ct SE Salem, OR | 3.0 | 1.5 | 1104 | $2,200 | $1.99 | 13d | 1 | 1.10mi |
| 5192 Caplinger Rd SE Salem, OR | 1.0–3.0 | 1.0–2.0 | 927 | $1,554 | $1.67 | 13d | 25 | 1.10mi |
| 3897 Meadowlawn Loop SE Salem, OR | 1.0–3.0 | 1.0–2.0 | 962 | $1,619 | $1.68 | 13d | 26 | 1.45mi |
| 3828 Bayonne Dr SE Salem, OR | 2.0 | 1.0 | 980 | $1,299 | $1.33 | 13d | 1 | 1.48mi |
| 3822 Bayonne Dr SE Salem, OR | 2.0 | 1.0 | 980 | $1,299 | $1.33 | 23d | 1 | 1.49mi |
| 4836 Tanglewood Ct SE Salem, OR | 3.0 | 2.0 | 1316 | $2,150 | $1.63 | 23d | 1 | 1.49mi |
Listing history 18 events
-
2026-06-18days on market $35,000 Active 61 DOM
-
2026-06-17days on market $35,000 Active 60 DOM
-
2026-06-16days on market $35,000 Active 59 DOM
-
2026-06-15days on market $35,000 Active 58 DOM
-
2026-06-14days on market $35,000 Active 56 DOM
-
2026-06-10days on market $35,000 Active 53 DOM
-
2026-06-09days on market $35,000 Active 52 DOM
-
2026-06-08days on market $35,000 Active 51 DOM
-
2026-06-07pricedays on market $35,000 Active 50 DOM
-
2026-06-03days on market $40,000 Active 46 DOM
-
2026-06-02days on market $40,000 Active 45 DOM
-
2026-06-01days on market $40,000 Active 44 DOM
-
2026-05-31days on market $40,000 Active 43 DOM
-
2026-05-30days on market $40,000 Active 42 DOM
-
2026-04-18$40,000 Active 402-char remark
Show marketing remark (402 chars)
Fantastic Opportunity for this 1991 Goldenwest Double Wide located at Meadowlark Mobile Manor, 55+ community. 1199 square feet with open floor plan that flows well from the living room into the dining room and kitchen with vaulted ceilings. Spacious Primary bedroom with bathroom, total of 2 bedroom and 2 bathroom and interior utility room. Attached carport, garden shed, and additional storage space.
-
2025-02-28soldstatus $29,900 Sold 521-char remark
Show marketing remark (521 chars)
Don’t miss out on this great buy for a 1991 Double Wide located at Meadowlark Mobile Manor – a 55+ park. 1199 SF Goldenwest with attached carport, garden shed, ample yard space, and Covered deck at entry. Open floor plan with vaulted ceilings, skylights, Formal living/dining room. Two spacious bedrooms, 1.5 baths. Inside utility rm includes Washer/Dryer. Convenient Kitchen with Range and Refrigerator. Heat pump, Priced for Quick Sale at $29,900.
-
2025-02-24historical Active under Contract 521-char remark
Show marketing remark (521 chars)
Don’t miss out on this great buy for a 1991 Double Wide located at Meadowlark Mobile Manor – a 55+ park. 1199 SF Goldenwest with attached carport, garden shed, ample yard space, and Covered deck at entry. Open floor plan with vaulted ceilings, skylights, Formal living/dining room. Two spacious bedrooms, 1.5 baths. Inside utility rm includes Washer/Dryer. Convenient Kitchen with Range and Refrigerator. Heat pump, Priced for Quick Sale at $29,900.
-
2025-02-20$29,900 Active 521-char remark
Show marketing remark (521 chars)
Don’t miss out on this great buy for a 1991 Double Wide located at Meadowlark Mobile Manor – a 55+ park. 1199 SF Goldenwest with attached carport, garden shed, ample yard space, and Covered deck at entry. Open floor plan with vaulted ceilings, skylights, Formal living/dining room. Two spacious bedrooms, 1.5 baths. Inside utility rm includes Washer/Dryer. Convenient Kitchen with Range and Refrigerator. Heat pump, Priced for Quick Sale at $29,900.
ⓘ Source: listings_history table (triggers on properties + properties_extension) + one-shot
backfill from property_details.listing_events for pre-trigger history.
Climate risk First Street
- Flood 1/10 Low FEMA zone X (unshaded) · 0% chance over 30 yrs
- Wildfire 3/10 Moderate
- Heat 4/10 Moderate 7 d/yr ≥91°F today · 15 d/yr by 30 yrs out
- Wind 1/10 Low
- Air quality 9/10 Extreme 12 unhealthy d/yr today · 13 by 30 yrs out
Nearby sold comps map
Loading sold comps map…
Walkable amenities ~0.75 mi
Loading nearby amenities…
Taxation est. · year 1
- Rental income
- $19,692
- − Mortgage interest
- −$1,961
- − Property taxes
- −$525
- − Insurance
- −$175
- − Repairs & maintenance
- −$1,575
- − Management
- −$1,575
- − Depreciation
- −$1,018
- Taxable income
- $12,863
- Est. tax owed @ 24.0%
- −$3,087
- After-tax cash flow
- $9,567/yr
For passive investors: Depreciation is non-cash, so a rental often shows a tax loss while cash-flowing — sheltering income. Rental losses are passive: they offset passive income freely, and up to $25,000/yr can offset ordinary (W-2) income if you actively participate and your MAGI is under $100k (phasing out to $0 by $150k); unused losses carry forward. On sale, claimed depreciation is recaptured at up to 25%, and gains may owe capital-gains tax (a 1031 exchange can defer both). Figures are a year-1 estimate at your 24.0% rate — not tax advice; consult a CPA.
Condition & rehab AI · 12 photos
This mobile home requires significant repairs and updates to improve its condition and value. The exterior siding and interior walls are in poor condition, and the kitchen and bathrooms need updates. Landscaping also needs attention. With proper repairs and updates, this home has the potential to be a great investment.
Repairs flagged
- Major exterior siding — Severe weathering and peeling
- Major interior walls — Worn carpet and outdated wallpaper
- Major kitchen cabinets — Outdated and in poor condition
- Major bathroom fixtures — Outdated and in poor condition
- Major landscaping — Overgrown and in poor condition
Value-add opportunities
- Resale paint exterior — Fresh paint can significantly improve curb appeal
- Resale replace carpet — Fresh carpet can improve the overall look and feel of the home
- Resale update kitchen cabinets — Fresh cabinets can improve the overall look and functionality of the kitchen
- Resale update bathroom fixtures — Fresh fixtures can improve the overall look and functionality of the bathroom
- Resale prune landscaping — Pruned landscaping can improve the overall look and curb appeal of the home
Renovation cost estimate screening
| Repair item | Severity | Est. cost |
|---|---|---|
| exterior siding · Severe weathering and peeling | Major | $15,000–50,000 |
| interior walls · Worn carpet and outdated wallpaper | Major | $15,000–50,000 |
| kitchen cabinets · Outdated and in poor condition | Major | $15,000–50,000 |
| bathroom fixtures · Outdated and in poor condition | Major | $15,000–50,000 |
| landscaping · Overgrown and in poor condition | Major | $15,000–50,000 |
| Total estimated repair cost · 5 items | $75,000–250,000 |
Value-add ROI direction
- Resale paint exterior — Fresh paint can significantly improve curb appeal ↑
- Resale replace carpet — Fresh carpet can improve the overall look and feel of the home ↑
- Resale update kitchen cabinets — Fresh cabinets can improve the overall look and functionality of the kitchen ↑
- Resale update bathroom fixtures — Fresh fixtures can improve the overall look and functionality of the bathroom ↑
- Resale prune landscaping — Pruned landscaping can improve the overall look and curb appeal of the home ↑
ⓘ Cost ranges are severity-bucket heuristics (US national rule-of-thumb). Get contractor quotes + a written scope before underwriting a rehab budget.
Schools (NCES district)
- District
- Salem-Keizer SD 24J
- NCES district ID
- 4110820
- Math proficiency
- 34% ▼ -1.00%
- Reading proficiency
- 47% ▼ -2.00%
- Median HH income
- $48,632
- Composite
- 37.16/100
- National rank
- #9017
- State rank
- #103 of 183 in OR
Livability — Salem
- Score
- 79/100
- State rank
- #59
- US rank
- #2084
Category grades
Schools grade is shown separately in the Schools card above.
Census & demographics
- Census place
- Salem, OR
- County
- Marion County · 258,219 people
- City population
- 193,601
- Metro
- Salem, OR
- Population (ZIP)
- 25,966
- Household income
- $84,393
- Rent vs Own
- Severe rent burden
- 395.0
Population outlook (Marion County) Hauer SSP2
- Today (2025)
- 360,940 people
- By 2030
- 375,178 · +3.9%
- By 2040
- 400,914 · +11.1%
- By 2050
- 422,187 · +17.0%
- By 2075
- 460,305 · +27.5%
- By 2100
- 464,025 · +28.6%
Race, ethnicity, and origin ACS 2023
- Neighborhood character
- Majority White (61%)
- Race & ethnicity
- White 61% Hispanic / Latino 28% Two or more races 17% Asian 2% Pacific Islander 2%
- Hispanic origin (detail)
- Mexican 26%
- Common ancestry
- Portuguese 4% Italian 2% Lithuanian 2%
- Foreign-born
- 11% · Canada, Vietnam
- Languages at home
- 74% English-only · Spanish 22% Russian/Polish/Slavic 2% German/W. Germanic 1%
Political lean MEDSL · Marion
- 2024 margin
- Toss-up / Even · D 47.5% · R 49.5% · Other 3.0%
- 2008→2024 swing
- -4.2pp toward R · 2008: 2.2pp · 2024: -2.0pp
- All cycles
- 2024: R+2.0 2020: D+1.1 2016: R+5.0 2012: R+3.5 2008: D+2.2
Not yet ingested
- Civics
- —
Market trends
- HPI YoY
- ▼ -471.73%
- Current HPI
- 307.3264
- Rent YoY
- ▲ 2.62%
- Metro
- Salem, OR
- State GDP YoY
- ▲ 2.05%
- F500 in state
- 2
Industry mix (Fortune 500 HQ in OR)
| Industry | F500 HQs | Revenue |
|---|---|---|
| Consumer Goods | 1 | $51B |
|
||
Price history
+33.8% since first listed4 events — show timeline
- 2026-04-18 Listed $40,000 WVMLS
- 2025-02-28 Sold (MLS) $29,900 WVMLS
- 2025-02-24 Contingent — WVMLS
- 2025-02-20 Listed $29,900 WVMLS
Cash-flow waterfall
monthlySold comps — $/sqft
last 12 mo · ≤1 miLoading sold comps…