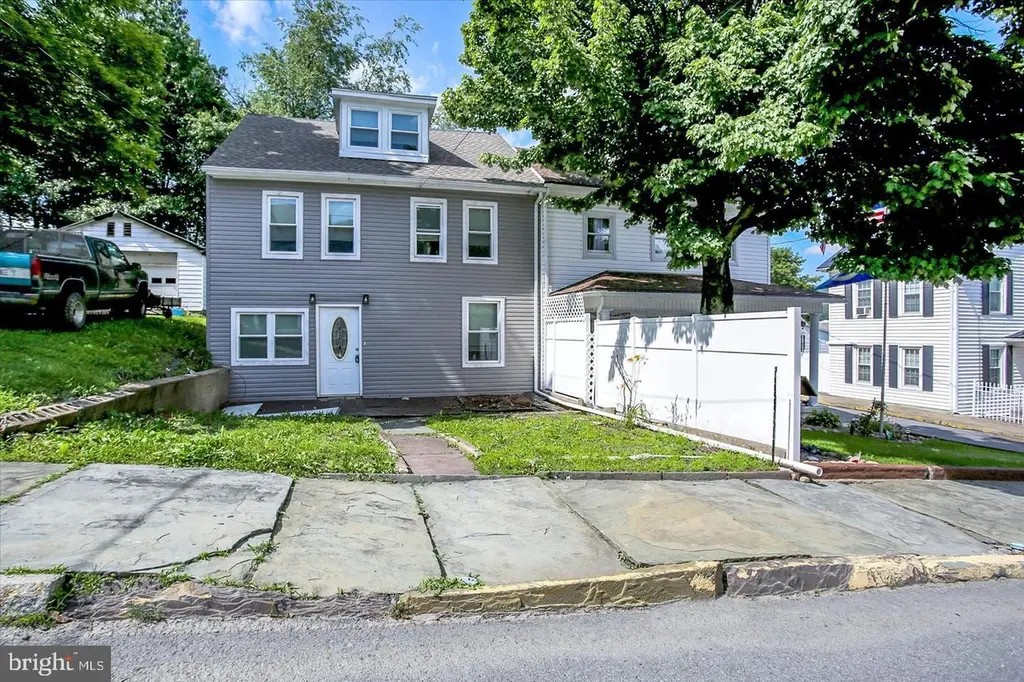
829-831 W Pine St · Fairview-Ferndale, PA
Flood risk 1/10 · Minimal
- FEMA flood zone
- X (unshaded)
- Chance of flooding over 30 yrs
- 0.0%
- Est. flood insurance / yr
- $473 – $860
Fire risk 1/10 · Minimal
- Est. fire insurance / yr
- $511 – $949
Heat risk 4/10 · Minor
- Hot days now (above 95°F)
- 8 days/yr
- Hot days in 30 yrs
- 17 days/yr
Wind risk 2/10 · Minimal
- Chance of severe wind over 30 yrs
- 4.0%
Air-quality risk 2/10 · Minimal
- Unhealthy air days now
- 1 days/yr
- Unhealthy air days in 30 yrs
- 2 days/yr
Risk factors via First Street. Map © Google.
Why this score? — see what drove the C- grade
The composite is a weighted blend of 9 inputs, each scored 0–100. Each bar is that input's sub-score; the figure is the points it added to the 100-point composite (weight × sub-score).
- Cash flow +19.5/30.0
- ARV discount +7.5/15.0
- DSCR +6.2/10.0
- Appreciation +4.4/10.0
- 1% rule +3.9/10.0
- Rent growth +2.5/5.0
- Livability +2.5/5.0
- Condition / age +2.5/5.0
- Schools +2.4/10.0
$140,000
🖨 Deal sheet (PDF) 📄 Offer letter ✓ Due diligence
Listing remarks
✨Ready to occupy or rent immediately! ✨ … This newly renovated home is ready for a new owner. 🏠 The main floor consists of a living room, dining room, kitchen with appliances, laundry room/office and a full bathroom. On the second floor, you’ll find 3 hall-entered bedrooms 🛏️ and a 2nd full bathroom. There is a finished walk-up attic that offers endless possibilities -- hang out area for the kids, additional living space or extra storage space. The low-maintenance backyard 🌳 is ready for your creative touch making it a perfect spot for relaxing, entertaining, or outdoor fun. The unfinished basement provides additional storage space. Accepting Cash or Conventional offers only!
Key facts
- Built 1920
- Listed 232 days
Neighborhood map
What this means for you Summary
Snapshot
- This is a 3-bed/2.0-bath other listed at $140k.
Deal economics
- At list price, monthly cash flow is $159 ($2k/yr) — positive.
- The deal already cash-flows at list — no discount required.
- To meet the 1% rule (rent ≥ 1% of price), the offer needs to be $125k (11.0% below list).
- Recommended offer: $123k (12.0% below list) — sets the bar for market timing.
Location & tenants
- Location reads: area grade C — affects rentability + tenant quality, not the cash-flow math above.
- Shamokin Area SD (town): math 19% / reading 40% proficiency, ranked #450 of 539 in PA (top 84%) — low school quality limits family demand, transient renter base, plan for 1-2y turnover.
- Zoned schools: Shamokin Area El Sch (math 22% / reading 36%, grade F, #1,146 of 1,518 statewide, top 76%, 832 students, 100% FRL); Shamokin Area Ms (math 12% / reading 40%, grade F, #412 of 512 statewide, top 81%, 346 students, 100% FRL); Shamokin Area Hs (math 42% / reading 30%, grade F, #300 of 437 statewide, top 70%, 702 students, 80% FRL) — zoned schools average 93% FRL vs 57% district-wide (37 pts higher); higher-poverty schools than district average — tighter screening recommended.
- Market conditions: 30 active listings in the ZIP; 2 comparable units currently listed for rent nearby; 81 units permitted in Northumberland County in 2024 (0 in 5+ unit buildings).
Forward outlook
- Local home prices are declining (-1.3%/yr); year-one equity from $968 of loan paydown is wiped out by about $2k of value loss. Plan a longer hold.
- Northumberland County population projected at -11% by 2050 — secular population decline; favor cash flow + early exit over multi-decade hold.
Negotiation context
- It's been on market 233 days — a 12% lower offer ($123k) is reasonable based on typical stale-listing flexibility.
- 4 sale attempts since 2y ago; this cycle's ask has dropped $14k (9%) from the opening price — seller is motivated, your offer sets the floor, not the list.
- Current owner paid $23k; list at $140k implies a 509% gain — meaningful room to come down on a strong offer.
Risks & watch-outs
- Watch-outs: built in 1920 — expect roof / HVAC / electrical / plumbing capex.
Questions for the listing agent
- It's been on market 233 days. Have you received any prior offers? Is the seller open to a 12% concession, seller financing, or rate buy-down credit?
- Built in 1920 — when were the roof, HVAC, electrical panel, plumbing, and water heater last replaced?
- Why hasn't it sold? Are there any deal-killer items the seller is aware of (foundation, flood, title, zoning, code violations)?
- Is there a deadline driving the sale (1031 exchange, divorce, estate, relocation)? That informs how much negotiation room exists.
- What's the average days-on-market for RENTAL listings here right now (not sales)? A rising rental-DOM trend means longer vacancies and softer asking-rent achievability than the comps imply.
- What's the recent tenant-quality profile in this submarket — average credit score on applications, eviction rate, late-payment / NSF rate, and stable-employment percentage? A property-management company in the area should have these aggregated.
- How much new for-sale + rental construction is in the pipeline within 1–3 miles? Heavy new supply typically softens prices + rents 12–24 months out; constrained supply supports both.
Investment metrics
- 1% rule
- 0.89% ✗
- Cap rate
- 7.66%
- Cash-on-cash
- 4.88%
- DSCR
- 1.22
- GRM
- 9.4
CMA / ARV
- ARV (median comp)
- $45,441
- List price
- $140,000
- Delta
- 208.09%
- Verdict
- OVERPRICED
- Comps
- 11 within 1.0 mi
Projected returns pro-forma
-1.29% appreciation · 3.0% rent growth · sell at horizon
- IRR
- -1.4%
- Equity multiple
- 0.94×
- Total profit
- $-2,292
- Equity at exit
- $31,838
- IRR
- 5.6%
- Equity multiple
- 1.52×
- Total profit
- $20,336
- Equity at exit
- $31,792
Cash invested: $39,200 (down + closing). Projections, not guarantees.
Landlord ↔ Tenant lean methodology
- Overall (STATE)
- 62 Landlord-Friendly
- State Pennsylvania
- 62 Landlord-Friendly · EVEN
- County
- — inherits STATE
- City
- — inherits STATE
ZIP-level market 17866
- Home prices YoY
- -1.1%
- Active inventory
- 30
- Price-to-rent
- 9.4×
Monthly cashflow live
- Estimated rent
- $1,246 medium interval (Pro) →
- Mortgage (P&I)
- −$734
- Tax from tax record
- −$33 /mo · $391/yr
- Insurance
- −$58
- HOA
- −$0
- Vacancy / Maint / Mgmt
- −$262
- Net cashflow
- $159
Break-even live
Sensitivity live
| Price | -10% $239 | -5% $199 | +0% $159 | +5% $120 | +10% $80 |
|---|---|---|---|---|---|
| Rent | -10% $61 | -5% $110 | +0% $159 | +5% $209 | +10% $258 |
| Rate | -1.0pp $230 | -0.5pp $195 | base $159 | +0.5pp $123 | +1.0pp $86 |
UW: 25.0% down · 7.5% · 30yr · 1.5% tax · 5.0% vac · 8.0% maint · 8.0% mgmt
Financing live
Cash to close
- Down payment
- $35,000
- Closing costs
- $4,200
- Reserves months
- —
- Total cash needed
- —
Loan-product check · same deal, 3 products live
Conventional
25% down · 7.5% · 30yr
- Down + closing
- —
- Monthly P&I
- —
- Monthly cashflow
- —
- DSCR
- —
- Eligible?
- —
Personal DTI + credit; lowest rate.
DSCR
20% down · 8.5% · 30yr
- Down + closing
- —
- Monthly P&I
- —
- Monthly cashflow
- —
- DSCR
- —
- Eligible?
- —
No personal income docs; deal must DSCR.
Hard money
10% down · 12.0% · 12mo
- Down + closing
- —
- Monthly P&I
- —
- Monthly cashflow
- —
- DSCR
- —
- Eligible?
- —
Short-term bridge; refi at stabilization.
Rent comps 2 comps
| Address | Beds | Baths | Sqft | Rent | $/sqft | DOM | Units | Dist |
|---|---|---|---|---|---|---|---|---|
| 2 S Vine St Shamokin, PA | 3.0 | 1.0 | 1450 | $975 | $0.67 | 45d | 1 | 0.92mi |
| 609 E Commerce St Shamokin, PA | 4.0 | 1.5 | 1668 | $1,500 | $0.90 | 45d | 1 | 0.99mi |
Listing history 24 events
-
2026-06-22days on market $140,000 Active 233 DOM
-
2026-06-19days on market $140,000 Active 230 DOM
-
2026-06-18days on market $140,000 Active 229 DOM
-
2026-06-17days on market $140,000 Active 228 DOM
-
2026-06-16days on market $140,000 Active 227 DOM
-
2026-06-15days on market $140,000 Active 226 DOM
-
2026-06-14days on market $140,000 Active 224 DOM
-
2026-06-12days on market $140,000 Active 223 DOM
-
2026-06-09days on market $140,000 Active 220 DOM
-
2026-06-08days on market $140,000 Active 219 DOM
-
2026-06-07days on market $140,000 Active 218 DOM
-
2026-06-03days on market $140,000 Active 214 DOM
-
2026-06-02days on market $140,000 Active 213 DOM
-
2026-06-01days on market $140,000 Active 212 DOM
-
2026-05-31days on market $140,000 Active 211 DOM
-
2026-05-30days on market $140,000 Active 210 DOM
-
2026-03-16status Active
-
2026-03-01status Pending
-
2026-01-15price $140,000
-
2025-10-17$153,500 Active
-
2025-10-15historical
-
2025-06-25$165,000 Active
-
2024-06-02$172,000 Active
-
2023-09-22soldstatus $23,000
ⓘ Source: listings_history table (triggers on properties + properties_extension) + one-shot
backfill from property_details.listing_events for pre-trigger history.
Tax reassessment forecast PA · Partial reset (capped growth)
- Current annual tax
- $391 · $33/mo
- Projected year-2 tax
- $1,302 · $108/mo
- Expected delta
- +$910/yr (+$76/mo · 232.6%)
ⓘ Screening estimate from a state-policy table — verify with the county assessor before closing.
Climate risk First Street
- Flood 1/10 Low FEMA zone X (unshaded) · 0% chance over 30 yrs
- Wildfire 1/10 Low
- Heat 4/10 Moderate 8 d/yr ≥95°F today · 17 d/yr by 30 yrs out
- Wind 2/10 Low 4% chance of damaging wind over 30 yrs
- Air quality 2/10 Low 1 unhealthy d/yr today · 2 by 30 yrs out
Nearby sold comps map
Loading sold comps map…
Walkable amenities ~0.75 mi
Loading nearby amenities…
Taxation est. · year 1
- Rental income
- $14,956
- − Mortgage interest
- −$7,842
- − Property taxes
- −$391
- − Insurance
- −$700
- − Repairs & maintenance
- −$1,196
- − Management
- −$1,196
- − Depreciation
- −$4,073
- Taxable loss
- −$443
- Est. tax savings @ 24.0%
- +$106
- After-tax cash flow
- $2,020/yr
For passive investors: Depreciation is non-cash, so a rental often shows a tax loss while cash-flowing — sheltering income. Rental losses are passive: they offset passive income freely, and up to $25,000/yr can offset ordinary (W-2) income if you actively participate and your MAGI is under $100k (phasing out to $0 by $150k); unused losses carry forward. On sale, claimed depreciation is recaptured at up to 25%, and gains may owe capital-gains tax (a 1031 exchange can defer both). Figures are a year-1 estimate at your 24.0% rate — not tax advice; consult a CPA.
Schools (NCES district)
- District
- Shamokin Area SD
- NCES district ID
- 4221240
- Math proficiency
- 19% ▼ -13.00%
- Reading proficiency
- 40% ▼ -11.00%
- Median HH income
- $35,380
- Composite
- 24.31/100
- National rank
- #7709
- State rank
- #450 of 539 in PA
Livability — Fairview-Ferndale
No livability data for this city. (Only ~50 U.S. cities are tracked.)
Census & demographics
- Census place
- Fairview-Ferndale, PA
- Population (ZIP)
- 9,808
Population outlook (Northumberland County) Hauer SSP2
- Today (2025)
- 90,896 people
- By 2030
- 89,084 · -2.0%
- By 2040
- 84,822 · -6.7%
- By 2050
- 80,521 · -11.4%
- By 2075
- 72,152 · -20.6%
- By 2100
- 62,257 · -31.5%
Race, ethnicity, and origin ACS 2023
- Neighborhood character
- Predominantly White (79%)
- Race & ethnicity
- White 79% Black 15% Hispanic / Latino 4% Two or more races 2%
- Common ancestry
- Romanian 12% Iranian 4% Subsaharan African 2%
- Foreign-born
- 1%
- Languages at home
- 97% English-only · Spanish 3%
Political lean MEDSL · Northumberland
- 2024 margin
- Solid R (+39.9) · D 29.6% · R 69.5%
- 2008→2024 swing
- -26.1pp toward R · 2008: -13.8pp · 2024: -39.9pp
- All cycles
- 2024: R+39.9 2020: R+38.5 2016: R+43.6 2012: R+19.4 2008: R+13.8
Not yet ingested
- Civics
- —
Market trends
- HPI YoY
- ▼ -1.29%
- Current HPI
- 111.3788
- Rent YoY
- —
- Metro
- —
- State GDP YoY
- ▲ 1.68%
- F500 in state
- 34
Industry mix (Fortune 500 HQ in PA)
| Industry | F500 HQs | Revenue |
|---|---|---|
| Healthcare | 2 | $309B |
|
||
| Insurance | 2 | $27B |
|
||
| Telecommunications / Media | 1 | $124B |
|
||
| Industrial Distribution | 1 | $22B |
|
||
| Financial Services | 1 | $20B |
|
||
| Chemicals / Materials | 1 | $18B |
|
||
Price history
+508.7% since first listed8 events — show timeline
- 2026-03-16 Relisted — BRIGHT MLS
- 2026-03-01 Pending — BRIGHT MLS
- 2026-01-15 Price Changed $140,000 BRIGHT MLS
- 2025-10-17 Listed $153,500 BRIGHT MLS
- 2025-10-15 Listing Removed — BRIGHT MLS
- 2025-06-25 Listed $165,000 BRIGHT MLS
- 2024-06-02 Listed $172,000 CSVBR
- 2023-09-22 Sold (Public Records) $23,000 Public Records
Property tax history
+3.9%/yrLatest (2026): $391 · +2.2% YoY. Source: county tax records.
Cash-flow waterfall
monthlySold comps — $/sqft
last 12 mo · ≤1 miLoading sold comps…