329 King George Iii Dr · Mundy, MI
Flood risk No data
- FEMA flood zone
- —
- Chance of flooding over 30 yrs
- —
- Est. flood insurance / yr
- —
Fire risk No data
- Est. fire insurance / yr
- —
Heat risk No data
- Hot days now (above threshold)
- —
- Hot days in 30 yrs
- —
Wind risk No data
- Chance of severe wind over 30 yrs
- —
Air-quality risk No data
- Unhealthy air days now
- —
- Unhealthy air days in 30 yrs
- —
Risk factors via First Street. Map © Google.
Why this score? — see what drove the D grade
The composite is a weighted blend of 9 inputs, each scored 0–100. Each bar is that input's sub-score; the figure is the points it added to the 100-point composite (weight × sub-score).
- Cash flow +15.0/30.0
- ARV discount +7.5/15.0
- 1% rule +5.0/10.0
- DSCR +5.0/10.0
- Schools +2.9/10.0
- Livability +2.5/5.0
- Condition / age +2.5/5.0
- Rent growth +2.2/5.0
- Appreciation +0.0/10.0
$7,300
🖨 Deal sheet 📄 Offer letter ✓ Due diligence
Listing remarks MLS
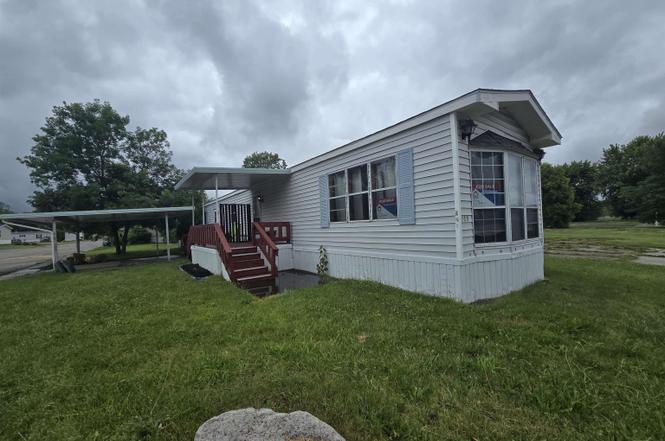
Very affordable, move in ready home on a corner lot! No immediate neighbors, peaceful setting. Community has a pool, playgrounds, and clubhouse! Central air, carport, nice covered porch. Lots of natural light and cool built ins. All appliances included, can come partially furnished if desired. Swartz Creek Schools!!! Come see today!
Key facts
- Covered porch
- Community pool
- Built ins
Tags
Property features AI
Finance
- Other: Subdivision: TORREY HILLS; Cross streets: Torrey Lane / Torrey Road
- HOA & community: Homeowners association with a $585 monthly fee
Exterior
- Utilities: Shared septic
- Home design: Single-family residence; One story; Residential property
- Construction: Vinyl siding; Slab foundation
Interior
- Bathrooms: 1 full bathroom
- Heating & cooling: Forced air heating (natural gas); No cooling
- Interior features: Total of 2 rooms
Neighborhood map
What this means for you Summary
Snapshot
- This is a 2-bed/1.0-bath other listed at $7k.
Deal economics
- At list price, monthly cash flow is $131 ($2k/yr) — positive.
- The deal already cash-flows at list — no discount required.
- Meets the 1% rule at list price ($960 rent vs $7k).
Location & tenants
- Location reads: area grade D — affects rentability + tenant quality, not the cash-flow math above.
- Swartz Creek Community Schools (suburban): math 23% / reading 44% proficiency, ranked #298 of 540 in MI (top 55%) — families likely to look elsewhere, expect single-tenant / working-renter base with shorter leases.
- Market conditions: Rents soft (-1.0%/yr); 206 active listings in the ZIP; 419 units permitted in Genesee County in 2024 (68 in 5+ unit buildings).
Forward outlook
- Local home prices are declining (-3.0%/yr); year-one equity from $50 of loan paydown is wiped out by about $219 of value loss. Plan a longer hold.
- Genesee County population projected at -27% by 2050 — secular population decline; favor cash flow + early exit over multi-decade hold.
- At projected returns (-3.0% appreciation + 0.0% rent growth), your $2k cash investment doubles in ~2 years — after that, you're playing with house money.
Negotiation context
- Only 1 days on market — expect competitive offers; lowballing is unlikely to land.
- 2 sale attempts with the ask held roughly flat each time — persistent listings suggest the price (not the market) is what's stuck; bring a comps-based counter.
Risks & watch-outs
- Watch-outs: HOA is 61% of rent.
Questions for the listing agent
- What does the HOA fee cover, when was the last increase, and are there any pending special assessments or reserve-fund shortfalls?
- Is there a deadline driving the sale (1031 exchange, divorce, estate, relocation)? That informs how much negotiation room exists.
- The area grade is low — what's the realistic commute time and amenity access for the typical tenant pool here? Any planned neighborhood developments (good or bad) we should know about?
- What's the average days-on-market for RENTAL listings here right now (not sales)? A rising rental-DOM trend means longer vacancies and softer asking-rent achievability than the comps imply.
- What's the recent tenant-quality profile in this submarket — average credit score on applications, eviction rate, late-payment / NSF rate, and stable-employment percentage? A property-management company in the area should have these aggregated.
- How much new for-sale + rental construction is in the pipeline within 1–3 miles? Heavy new supply typically softens prices + rents 12–24 months out; constrained supply supports both.
Investment metrics
- 1% rule
- 13.15% ✓
- Cap rate
- 27.75%
- Cash-on-cash
- 76.62%
- DSCR
- 4.41
- GRM
- 0.6
CMA / ARV
No comps found within radius.
Projected returns pro-forma
-3.0% appreciation · 0.0% rent growth · sell at horizon
- IRR
- 62.9%
- Equity multiple
- 3.29×
- Total profit
- $4,686
- Equity at exit
- $1,088
- IRR
- 62.6%
- Equity multiple
- 3.65×
- Total profit
- $5,412
- Equity at exit
- $631
Cash invested: $2,044 (down + closing). Projections, not guarantees.
Landlord ↔ Tenant lean methodology
- Overall (STATE)
- 62 Landlord-Friendly
- State Michigan
- 62 Landlord-Friendly · EVEN
- County
- — inherits STATE
- City
- — inherits STATE
ZIP-level market 48507
- Rents YoY
- -1.0%
- Active inventory
- 206
- Price-to-rent
- 0.6×
Monthly cashflow live
- Estimated rent
- $960 medium interval (Pro) →
- Mortgage (P&I)
- −$38
- Tax from tax record
- −$2 /mo · $19/yr
- Insurance
- −$3
- HOA
- −$585
- Vacancy / Maint / Mgmt
- −$202
- Net cashflow
- $131
Break-even live
UW: 25.0% down · 7.5% · 30yr · 1.5% tax · 5.0% vac · 8.0% maint · 8.0% mgmt
Financing live
Cash to close
- Down payment
- $1,825
- Closing costs
- $219
- Reserves months
- —
- Total cash needed
- —
Loan-product check · same deal, 3 products live
Conventional
25% down · 7.5% · 30yr
- Down + closing
- —
- Monthly P&I
- —
- Monthly cashflow
- —
- DSCR
- —
- Eligible?
- —
Personal DTI + credit; lowest rate.
DSCR
20% down · 8.5% · 30yr
- Down + closing
- —
- Monthly P&I
- —
- Monthly cashflow
- —
- DSCR
- —
- Eligible?
- —
No personal income docs; deal must DSCR.
Hard money
10% down · 12.0% · 12mo
- Down + closing
- —
- Monthly P&I
- —
- Monthly cashflow
- —
- DSCR
- —
- Eligible?
- —
Short-term bridge; refi at stabilization.
HOA detail
- Monthly dues
- $585 · $7,020/yr
- Likely covers
- landscapingpool
Listing history 3 events
-
2026-06-17status $7,300 Pending 1 DOM
-
2026-06-16remarks 335-char remark
Show marketing remark (335 chars)
Very affordable, move in ready home on a corner lot! No immediate neighbors, peaceful setting. Community has a pool, playgrounds, and clubhouse! Central air, carport, nice covered porch. Lots of natural light and cool built ins. All appliances included, can come partially furnished if desired. Swartz Creek Schools!!! Come see today!
-
2026-06-16$7,300 Active 1 DOM
Show marketing remark (335 chars)
Very affordable, move in ready home on a corner lot! No immediate neighbors, peaceful setting. Community has a pool, playgrounds, and clubhouse! Central air, carport, nice covered porch. Lots of natural light and cool built ins. All appliances included, can come partially furnished if desired. Swartz Creek Schools!!! Come see today!
ⓘ Source: listings_history table (triggers on properties + properties_extension) + one-shot
backfill from property_details.listing_events for pre-trigger history.
Tax reassessment forecast MI · Partial reset (capped growth)
- Current annual tax
- $19 · $2/mo
- Projected year-2 tax
- $66 · $5/mo
- Expected delta
- +$47/yr (+$4/mo · 245.8%)
ⓘ Screening estimate from a state-policy table — verify with the county assessor before closing.
Nearby sold comps map
Loading sold comps map…
Walkable amenities ~0.75 mi
Loading nearby amenities…
Taxation est. · year 1
- Rental income
- $11,520
- − Mortgage interest
- −$409
- − Property taxes
- −$19
- − Insurance
- −$36
- − Repairs & maintenance
- −$922
- − Management
- −$922
- − HOA
- −$7,020
- − Depreciation
- −$212
- Taxable income
- $1,980
- Est. tax owed @ 24.0%
- −$475
- After-tax cash flow
- $1,091/yr
For passive investors: Depreciation is non-cash, so a rental often shows a tax loss while cash-flowing — sheltering income. Rental losses are passive: they offset passive income freely, and up to $25,000/yr can offset ordinary (W-2) income if you actively participate and your MAGI is under $100k (phasing out to $0 by $150k); unused losses carry forward. On sale, claimed depreciation is recaptured at up to 25%, and gains may owe capital-gains tax (a 1031 exchange can defer both). Figures are a year-1 estimate at your 24.0% rate — not tax advice; consult a CPA.
Schools (NCES district)
- District
- Swartz Creek Community Schools
- NCES district ID
- 2633420
- Math proficiency
- 23% ▼ -9.00%
- Reading proficiency
- 44% ▼ -5.00%
- Median HH income
- $53,586
- Composite
- 29.37/100
- National rank
- #6530
- State rank
- #298 of 540 in MI
Livability — Mundy
No livability data for this city. (Only ~50 U.S. cities are tracked.)
Census & demographics
- County
- Genesee County · 221,329 people
- Metro
- Flint, MI
- Population (ZIP)
- 28,723
- Household income
- $46,554
- Rent vs Own
- Severe rent burden
- 1534.0
Population outlook (Genesee County) Hauer SSP2
- Today (2025)
- 381,312 people
- By 2030
- 362,731 · -4.9%
- By 2040
- 321,550 · -15.7%
- By 2050
- 279,212 · -26.8%
- By 2075
- 193,336 · -49.3%
- By 2100
- 128,118 · -66.4%
Race, ethnicity, and origin ACS 2023
- Neighborhood character
- Diverse neighborhood (Simpson 0.57)
- Race & ethnicity
- White 59% Black 28% Two or more races 10% Hispanic / Latino 5%
- Common ancestry
- Lithuanian 4% Romanian 3% Slovak 2%
- Foreign-born
- 1% · Canada
- Languages at home
- 97% English-only · Spanish 1% Other Asian/Pacific 1%
Political lean MEDSL · Genesee
- 2024 margin
- Toss-up / Even · D 51.4% · R 47.2% · Other 1.4%
- 2008→2024 swing
- -28.3pp toward R · 2008: 32.5pp · 2024: 4.2pp
- All cycles
- 2024: D+4.2 2020: D+9.3 2016: D+9.5 2012: D+28.2 2008: D+32.5
Not yet ingested
- Civics
- —
Market trends
- HPI YoY
- ▼ -154.90%
- Current HPI
- 132.3632
- Rent YoY
- ▼ -1.04%
- Metro
- Flint, MI
- State GDP YoY
- ▲ 1.37%
- F500 in state
- 28
Industry mix (Fortune 500 HQ in MI)
| Industry | F500 HQs | Revenue |
|---|---|---|
| Automotive Parts | 3 | $48B |
|
||
| Automotive | 2 | $372B |
|
||
| Chemicals | 1 | $45B |
|
||
| Automotive Retail | 1 | $29B |
|
||
| Healthcare / Medical Devices | 1 | $23B |
|
||
| Automotive Technology | 1 | $20B |
|
||
Price history
+0.0% since first listed2 events — show timeline
- 2026-06-16 Listed $7,300 MiRealSource-MiMLS
- 2026-06-16 Listed $7,300 REALCOMP
Cash-flow waterfall
monthlySold comps — $/sqft
last 12 mo · ≤1 miLoading sold comps…