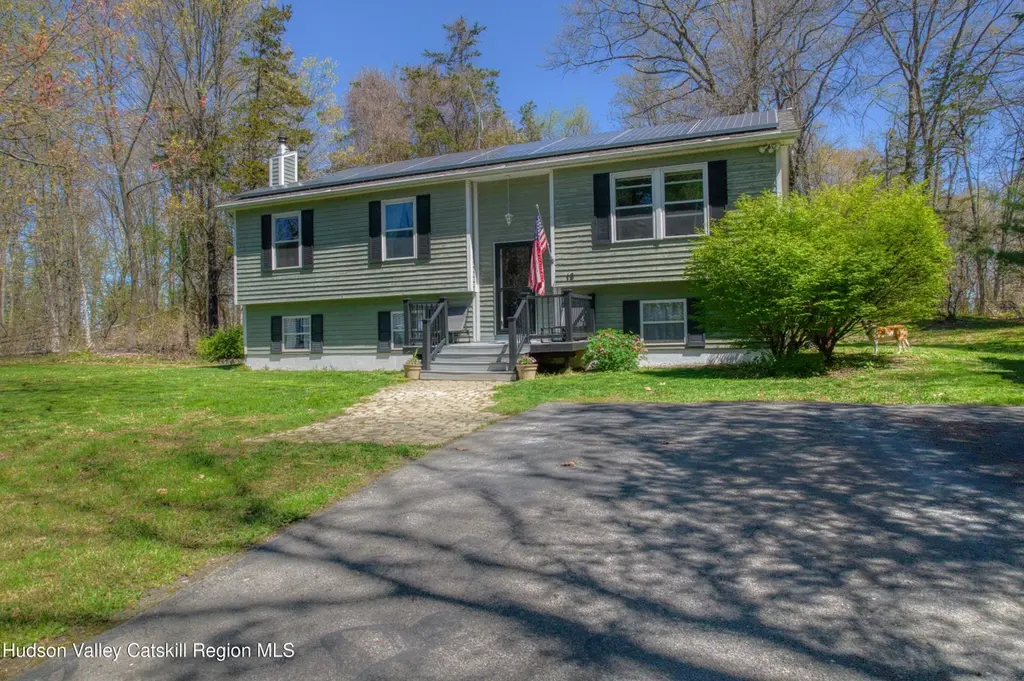
18 Mystery Ct · Sleepy Hollow Lake, NY
Flood risk 1/10 · Minimal
- FEMA flood zone
- X (unshaded)
- Chance of flooding over 30 yrs
- 0.0%
- Est. flood insurance / yr
- $473 – $860
Fire risk 3/10 · Minor
- Est. fire insurance / yr
- $691 – $1,283
Heat risk 3/10 · Minor
- Hot days now (above 99°F)
- 7 days/yr
- Hot days in 30 yrs
- 16 days/yr
Wind risk 3/10 · Minor
- Chance of severe wind over 30 yrs
- 9.0%
Air-quality risk 2/10 · Minimal
- Unhealthy air days now
- 0 days/yr
- Unhealthy air days in 30 yrs
- 1 days/yr
Risk factors via First Street. Map © Google.
Why this score? — see what drove the C grade
The composite is a weighted blend of 9 inputs, each scored 0–100. Each bar is that input's sub-score; the figure is the points it added to the 100-point composite (weight × sub-score).
- ARV discount +15.0/15.0
- Cash flow +12.6/30.0
- Appreciation +8.0/10.0
- 1% rule +4.3/10.0
- Schools +4.3/10.0
- DSCR +3.8/10.0
- Condition / age +3.8/5.0
- Rent growth +2.5/5.0
- Livability +2.5/5.0
$350,000
🖨 Deal sheet 📄 Offer letter ✓ Due diligence
Listing remarks
SELLER RELOCATING !! HUGE PRICE REDUCTION FOR QUICK SALE !!!! Meticulously maintained Raised Ranch set on a wooded lot in Sleepy Hollow Lake. Enjoy access to a private motor boat lake offering the best of year round recreation. The open concept main level features an updated kitchen with granite counters and seamless flow into the dining + living areas. Step out onto new trex deck perfect for morning coffee or entertaining guests in a peaceful natural setting. This upper level offers 3 beds, 2 full baths. The finished lower level provides flexible space to suit your needs- currently spacious family room with woodstove, plus ample storage and laundry area. A solid move in ready home with
Key facts
- Wooded lot
- Updated kitchen
- New trex deck
Tags
Property features AI
Finance
- Other: Community features include pool, clubhouse, fishing, gated entry, lake, park, playground
- HOA & community: Homeowners association with annual fee; Association amenities include boating, beach access and rights, clubhouse, gated entry, picnic area, playground, pool, recreation facilities, tennis courts, basketball court
Exterior
- Parking: Driveway
- Security: Gated community
- Utilities: Private water; Private sewer; 200+ amp electric service with circuit breakers; Cable available
- Home design: Single family residence; Residential property
- Construction: Wood siding; Asphalt roof; Slab foundation; Built using wood siding construction
- Exterior features: Deck; Cul-de-sac lot; Wooded lot; Community pool access
Interior
- Kitchen: Dishwasher, Microwave, Range, Refrigerator
- Flooring: Ceramic tile; Hardwood
- Bathrooms: 2 full bathrooms
- Heating & cooling: Baseboard heating; Oil heating; Wood stove
- Interior features: Finished basement; Dishwasher, Microwave, Range, Refrigerator
- Laundry & utility: Washer and Dryer included
Neighborhood map
What this means for you Summary
Snapshot
- This is a 3-bed/2.0-bath single-family listed at $350k. Condition is rated good.
Deal economics
- At list price, monthly cash flow is $-43 ($-519/yr) — negative.
- To cash-flow at today's rent, offer at most $344k (1.8% below list).
- To meet the 1% rule (rent ≥ 1% of price), the offer needs to be $325k (7.1% below list).
- Recommended offer: $325k (7.1% below list) — sets the bar for 1% rule.
- Cap rate 6.1% vs local median 2.3% in Sleepy Hollow Lake — top-decile yield for the area; either an underpriced asset or a hidden risk that comps aren't pricing in. Stress-test before assuming the spread holds.
Location & tenants
- Location reads: area grade C — affects rentability + tenant quality, not the cash-flow math above.
- Coxsackie-Athens Central School District (town): math 43% / reading 56% proficiency, ranked #384 of 590 in NY (top 65%) — families likely to look elsewhere, expect single-tenant / working-renter base with shorter leases.
- Market conditions: 91 active listings in the ZIP; 1 comparable units currently listed for rent nearby; 97 units permitted in Greene County in 2024 (0 in 5+ unit buildings).
Forward outlook
- In year one you build about $23k of equity ($2k loan paydown + $21k appreciation (5.9% local appreciation)).
- Greene County population projected at -22% by 2050 — secular population decline; favor cash flow + early exit over multi-decade hold.
- At projected returns (5.9% appreciation + 3.0% rent growth), your $98k cash investment doubles in ~4 years — after that, you're playing with house money.
- By year 2, paydown + projected appreciation supports a ~$37k cash-out refi (75% LTV) — recoverable capital for the next deal without selling this one.
Negotiation context
- It's been on market 45 days — a 3% lower offer ($340k) is reasonable based on typical stale-listing flexibility.
- 8 sale attempts since 22y ago; this cycle's ask has dropped $25k (7%) from the opening price — seller is motivated, your offer sets the floor, not the list.
- Current owner paid $170k; list at $350k implies a 106% gain — meaningful room to come down on a strong offer.
Questions for the listing agent
- What do current leases actually rent for vs. the listed asking? Can we see a recent rent roll and the last 12 months of T-12 income?
- It's been on market 45 days. Have you received any prior offers? Is the seller open to a 7% concession, seller financing, or rate buy-down credit?
- What does the HOA fee cover, when was the last increase, and are there any pending special assessments or reserve-fund shortfalls?
- Is there a deadline driving the sale (1031 exchange, divorce, estate, relocation)? That informs how much negotiation room exists.
- What's the average days-on-market for RENTAL listings here right now (not sales)? A rising rental-DOM trend means longer vacancies and softer asking-rent achievability than the comps imply.
- What's the recent tenant-quality profile in this submarket — average credit score on applications, eviction rate, late-payment / NSF rate, and stable-employment percentage? A property-management company in the area should have these aggregated.
- How much new for-sale + rental construction is in the pipeline within 1–3 miles? Heavy new supply typically softens prices + rents 12–24 months out; constrained supply supports both.
Investment metrics
- 1% rule
- 0.93% ✗
- Cap rate
- 6.14%
- Cash-on-cash
- -0.53%
- DSCR
- 0.98
- GRM
- 9.0
CMA / ARV
- ARV (median comp)
- $513,399
- List price
- $350,000
- Delta
- -31.83%
- Verdict
- UNDERPRICED
- Comps
- 20 within 1.0 mi
Show comp detail 2 sales within ~0.75 mi
| Address | Dist | Beds/Ba | Sqft | Sold | Price | $/sf | Match |
|---|---|---|---|---|---|---|---|
| 38 Ichabod Crane Cir | 0.55mi | 3/2.5 | 2,120 (+0%) | 22mo | $360,000 | $170 | 53 |
| 5 Catskill Ct | 0.64mi | 4/2.0 (+1) | 2,100 (-1%) | 20mo | $449,000 | $214 | 48 |
Match score weights: distance 35% · size 25% · config 20% · recency 20%. Top-matched comps best support the ARV.
Projected returns pro-forma
5.93% appreciation · 3.0% rent growth · sell at horizon
- IRR
- 14.8%
- Equity multiple
- 1.99×
- Total profit
- $96,900
- Equity at exit
- $218,360
- IRR
- 15.0%
- Equity multiple
- 3.94×
- Total profit
- $287,926
- Equity at exit
- $394,557
Cash invested: $98,000 (down + closing). Projections, not guarantees.
Landlord ↔ Tenant lean methodology
- Overall (STATE)
- 15 Strongly Tenant-Friendly
- State New York
- 15 Strongly Tenant-Friendly · D+10
- County
- — inherits STATE
- City
- — inherits STATE
ZIP-level market 12015
- Home prices YoY
- 1.4%
- Active inventory
- 91
- Price-to-rent
- 9.0×
Monthly cashflow live
- Estimated rent
- $3,250 medium interval (Pro) →
- Mortgage (P&I)
- −$1,835
- Tax est. 1.5%
- −$438 /mo · $5,250/yr
- Insurance
- −$146
- HOA
- −$192
- Vacancy / Maint / Mgmt
- −$682
- Net cashflow
- $-43
Break-even live
UW: 25.0% down · 7.5% · 30yr · 1.5% tax · 5.0% vac · 8.0% maint · 8.0% mgmt
Financing live
Cash to close
- Down payment
- $87,500
- Closing costs
- $10,500
- Reserves months
- —
- Total cash needed
- —
Loan-product check · same deal, 3 products live
Conventional
25% down · 7.5% · 30yr
- Down + closing
- —
- Monthly P&I
- —
- Monthly cashflow
- —
- DSCR
- —
- Eligible?
- —
Personal DTI + credit; lowest rate.
DSCR
20% down · 8.5% · 30yr
- Down + closing
- —
- Monthly P&I
- —
- Monthly cashflow
- —
- DSCR
- —
- Eligible?
- —
No personal income docs; deal must DSCR.
Hard money
10% down · 12.0% · 12mo
- Down + closing
- —
- Monthly P&I
- —
- Monthly cashflow
- —
- DSCR
- —
- Eligible?
- —
Short-term bridge; refi at stabilization.
Rent comps 1 comps
| Address | Beds | Baths | Sqft | Rent | $/sqft | DOM | Units | Dist |
|---|---|---|---|---|---|---|---|---|
| 1321 Sleepy Hollow RD Other City - Not In The State Of Florida, NY | 3.0 | 2.0 | 1640 | $3,250 | $1.98 | 44d | 1 | 1.03mi |
HOA detail
- Monthly dues
- $192 · $2,304/yr
Listing history 29 events
-
2026-06-13remarks 699-char remark
-
2026-06-13pricestatusdays on market $350,000 Pending 45 DOM
-
2026-06-10statusdays on market $375,000 Active 43 DOM
-
2026-06-09days on market $375,000 Active Under Contract 42 DOM
-
2026-06-08days on market $375,000 Active Under Contract 41 DOM
-
2026-06-07days on market $375,000 Active Under Contract 40 DOM
-
2026-06-05days on market $375,000 Active Under Contract 37 DOM
-
2026-06-03days on market $375,000 Active Under Contract 36 DOM
-
2026-06-02days on market $375,000 Active Under Contract 35 DOM
-
2026-06-01days on market $375,000 Active Under Contract 34 DOM
-
2026-05-31days on market $375,000 Active Under Contract 33 DOM
-
2026-05-31days on market $375,000 Active Under Contract 32 DOM
-
2026-05-12historical Active Under Contract 680-char remark
-
2026-04-28$375,000 Active 680-char remark
-
2025-08-13price $364,900
-
2025-06-17$375,000 Active
-
2024-09-30historical
-
2024-09-10price $334,900
-
2024-07-26price $339,900
-
2024-07-09price $359,900
-
2024-06-26$379,900 Active
-
2016-11-23historical
-
2016-05-31historical
-
2015-11-28$249,900
-
2015-11-23$249,900
-
2013-09-30historical
-
2013-03-28$219,000
-
2005-11-18soldstatus $169,500
-
2004-10-07$169,500
ⓘ Source: listings_history table (triggers on properties + properties_extension) + one-shot
backfill from property_details.listing_events for pre-trigger history.
Climate risk First Street
- Flood 1/10 Low FEMA zone X (unshaded) · 0% chance over 30 yrs
- Wildfire 3/10 Moderate
- Heat 3/10 Moderate 7 d/yr ≥99°F today · 16 d/yr by 30 yrs out
- Wind 3/10 Moderate 9% chance of damaging wind over 30 yrs
- Air quality 2/10 Low 0 unhealthy d/yr today · 1 by 30 yrs out
Nearby sold comps map
Loading sold comps map…
Walkable amenities ~0.75 mi
Loading nearby amenities…
Taxation est. · year 1
- Rental income
- $39,000
- − Mortgage interest
- −$19,605
- − Property taxes
- −$5,250
- − Insurance
- −$1,750
- − Repairs & maintenance
- −$3,120
- − Management
- −$3,120
- − HOA
- −$2,304
- − Depreciation
- −$10,182
- Taxable loss
- −$6,331
- Est. tax savings @ 24.0%
- +$1,520
- After-tax cash flow
- $1,000/yr
For passive investors: Depreciation is non-cash, so a rental often shows a tax loss while cash-flowing — sheltering income. Rental losses are passive: they offset passive income freely, and up to $25,000/yr can offset ordinary (W-2) income if you actively participate and your MAGI is under $100k (phasing out to $0 by $150k); unused losses carry forward. On sale, claimed depreciation is recaptured at up to 25%, and gains may owe capital-gains tax (a 1031 exchange can defer both). Figures are a year-1 estimate at your 24.0% rate — not tax advice; consult a CPA.
Condition & rehab AI · 12 photos
This solid move-in ready home with room to grow in a sought-after lake community is in good condition with minor cosmetic updates needed to maximize its resale and rental value.
Value-add opportunities
- Resale Paint interior walls — Neutral paint can be updated to a more modern color scheme
- Both Replace Trex deck — New Trex deck is in good condition, but replacing it could add curb appeal and value
- Both Replace woodstove with modern HVAC system — Modern HVAC system would improve comfort and energy efficiency
- Both Add smart home features — Smart home features can increase home value and appeal to tech-savvy buyers
Renovation cost estimate screening
Value-add ROI direction
- Resale Paint interior walls — Neutral paint can be updated to a more modern color scheme ↑
- Both Replace Trex deck — New Trex deck is in good condition, but replacing it could add curb appeal and value ↑
- Both Replace woodstove with modern HVAC system — Modern HVAC system would improve comfort and energy efficiency ↑
- Both Add smart home features — Smart home features can increase home value and appeal to tech-savvy buyers ↑
ⓘ Cost ranges are severity-bucket heuristics (US national rule-of-thumb). Get contractor quotes + a written scope before underwriting a rehab budget.
Schools (NCES district)
- District
- Coxsackie-Athens Central School District
- NCES district ID
- 3608490
- Math proficiency
- 43% ▼ -1.00%
- Reading proficiency
- 56% ▲ 19.00%
- Median HH income
- $55,006
- Composite
- 42.8/100
- National rank
- #3143
- State rank
- #384 of 590 in NY
Livability — Sleepy Hollow Lake
No livability data for this city. (Only ~50 U.S. cities are tracked.)
Census & demographics
- Census place
- Sleepy Hollow Lake, NY
- Population (ZIP)
- 4,084
Population outlook (Greene County) Hauer SSP2
- Today (2025)
- 44,963 people
- By 2030
- 43,126 · -4.1%
- By 2040
- 38,756 · -13.8%
- By 2050
- 34,913 · -22.4%
- By 2075
- 28,156 · -37.4%
- By 2100
- 22,296 · -50.4%
Race, ethnicity, and origin ACS 2023
- Neighborhood character
- Predominantly White (79%)
- Race & ethnicity
- White 79% Two or more races 10% Hispanic / Latino 7% Asian 3% Black 1%
- Hispanic origin (detail)
- Mexican 4% Dominican 2%
- Common ancestry
- Romanian 3% Iranian 3% Scotch-Irish 2%
- Foreign-born
- 11% · Canada, South Korea, Vietnam
- Languages at home
- 90% English-only · Russian/Polish/Slavic 5% Other Indo-European 2% Spanish 1%
Political lean MEDSL · Greene
- 2024 margin
- R (+17.0) · D 41.5% · R 58.5%
- 2008→2024 swing
- -7.1pp toward R · 2008: -9.9pp · 2024: -17.0pp
- All cycles
- 2024: R+17.0 2020: R+15.6 2016: R+27.4 2012: R+11.1 2008: R+9.9
Not yet ingested
- Civics
- —
Market trends
- HPI YoY
- ▲ 5.93%
- Current HPI
- 426.3034
- Rent YoY
- —
- Metro
- —
- State GDP YoY
- ▲ 2.60%
- F500 in state
- 92
Industry mix (Fortune 500 HQ in NY)
| Industry | F500 HQs | Revenue |
|---|---|---|
| Financial Services | 10 | $950B |
|
||
| Consumer Goods | 9 | $162B |
|
||
| Insurance | 4 | $225B |
|
||
| Telecommunications | 2 | $144B |
|
||
| Pharmaceuticals | 2 | $112B |
|
||
| Media / Entertainment | 2 | $69B |
|
||
Price history
+106.5% since first listed20 events — show timeline
- 2026-06-12 Pending — HVCRMLS
- 2026-06-10 Price Changed $350,000 HVCRMLS
- 2026-06-09 Relisted — HVCRMLS
- 2026-05-12 Contingent — HVCRMLS
- 2026-04-28 Listed $375,000 HVCRMLS
- 2025-08-13 Price Changed $364,900 HVCRMLS
- 2025-06-17 Listed $375,000 HVCRMLS
- 2024-09-30 Listing Removed — Global MLS
- 2024-09-10 Price Changed $334,900 Global MLS
- 2024-07-26 Price Changed $339,900 Global MLS
- 2024-07-09 Price Changed $359,900 Global MLS
- 2024-06-26 Listed $379,900 Global MLS
- 2016-11-23 Listing Removed — OneKey® MLS as Distributed by MLS Grid
- 2016-05-31 Listing Removed — Global MLS
- 2015-11-28 Listed $249,900 Global MLS
- 2015-11-23 Listed $249,900 OneKey® MLS as Distributed by MLS Grid
- 2013-09-30 Listing Removed — Global MLS
- 2013-03-28 Listed $219,000 Global MLS
- 2005-11-18 Sold (MLS) $169,500 Global MLS
- 2004-10-07 Listed $169,500 Global MLS
Cash-flow waterfall
monthlySold comps — $/sqft
last 12 mo · ≤1 miLoading sold comps…