 🏷️ Likely Rental
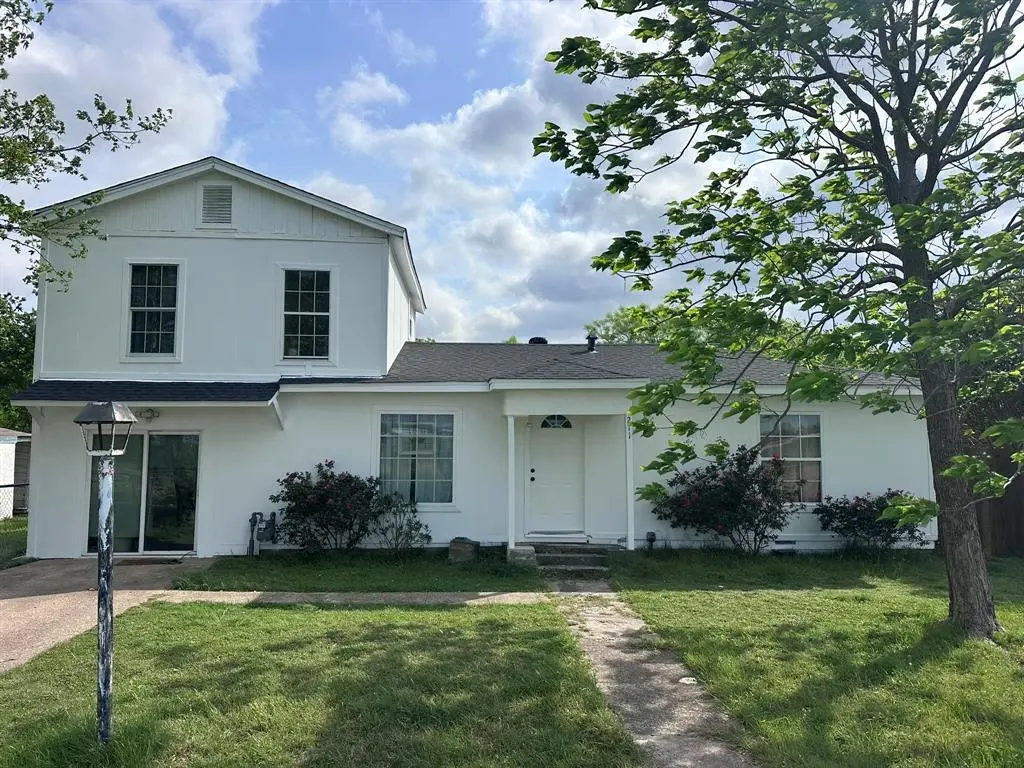
211 Sunnyside Dr · Waxahachie, TX
Flood risk 1/10 · Minimal
- FEMA flood zone
- X (unshaded)
- Chance of flooding over 30 yrs
- 0.0%
- Est. flood insurance / yr
- $507 – $1,088
Fire risk 4/10 · Minor
- Est. fire insurance / yr
- $1,222 – $2,270
Heat risk 7/10 · Major
- Hot days now (above 110°F)
- 7 days/yr
- Hot days in 30 yrs
- 25 days/yr
Wind risk 6/10 · Moderate
- Chance of severe wind over 30 yrs
- 27.0%
Air-quality risk 2/10 · Minimal
- Unhealthy air days now
- 1 days/yr
- Unhealthy air days in 30 yrs
- 2 days/yr
Risk factors via First Street. Map © Google.
Why this score? — see what drove the C grade
The composite is a weighted blend of 9 inputs, each scored 0–100. Each bar is that input's sub-score; the figure is the points it added to the 100-point composite (weight × sub-score).
- Cash flow +18.3/30.0
- ARV discount +15.0/15.0
- DSCR +5.8/10.0
- 1% rule +5.3/10.0
- Schools +3.9/10.0
- Livability +3.9/5.0
- Rent growth +3.4/5.0
- Condition / age +2.5/5.0
- Appreciation +0.0/10.0
$220,000
🖨 Deal sheet 📄 Offer letter ✓ Due diligence
Listing remarks
Home has a current lease term expiration of 5.31.2026. Please do not disturb without appointment. Pictures taken prior to tenant move-in. Welcome to this charming home with timeless appeal, right across from the elementary school. This 3 bed 2 bath home features two living areas, and beautiful hardwood floors that flow throughout, adding warmth and charm to every room. The two spacious living areas provide endless possibilities-perfect for creating a cozy family room, a sitting area, or even a home office. The kitchen features a large pantry and newer cabinets with a bar area for seating. The three bedrooms offer peaceful retreats, while the two full bathrooms ensure convenience for everyon
Key facts
- Newer cabinets
- Two living areas
- Bar area for seating
Tags
Property features AI
Finance
- Other: Subdivision: Hilltop-Rev; Directions available to the property
- Financial info: Listing terms include Cash, Contact Agent, Conventional, FHA; Property listed For Sale (Active Under Contract) — possession subject to lease
- HOA & community: No association
Exterior
- Parking: Driveway parking; Outside parking (no garage or carport)
- Security: Smoke detector(s)
- Utilities: City water; City sewer; Cable available; Electricity available; Sewer available; Curbs
- Home design: Single-family residence; Two-story (one and one-half levels); Preowned (built in 1940); Not attached to other properties; No accessory unit
- Construction: Wood siding construction; Composition roof; Pillar/post/pier foundation
- Exterior features: Fenced yard with wood fencing and gate; Corner lot; Cleared lot; Utilities easement
Interior
- Kitchen: Electric cooktop; Electric oven; Electric range; Refrigerator; Eat-in kitchen with pantry
- Bedrooms: Three bedrooms total; Primary bedroom located on the second level with an ensuite bath; Two additional bedrooms on the first level
- Flooring: Ceramic tile; Hardwood
- Bathrooms: Two full bathrooms
- Heating & cooling: Central heating (natural gas); Central air; Ceiling fan(s); Wall/window unit(s); Electric service available
- Interior features: Cable TV available; Eat-in kitchen; Pantry; Two living areas (including a great room and living room)
- Laundry & utility: Individual gas meter; Individual water meter
Neighborhood map
What this means for you Summary
Snapshot
- This is a 3-bed/1.0-bath single-family listed at $220k.
Deal economics
- At list price, monthly cash flow is $203 ($2k/yr) — positive.
- The deal already cash-flows at list — no discount required.
- Meets the 1% rule at list price ($2k rent vs $220k).
- Recommended offer: $217k (1.5% below list) — sets the bar for market timing.
- Cap rate 7.4% vs local median 3.3% in Waxahachie — top-decile yield for the area; either an underpriced asset or a hidden risk that comps aren't pricing in. Stress-test before assuming the spread holds.
Location & tenants
- Location reads 78/100 on livability (#71 in TX, #2,592 nationally) — a middle-class / working-renter tenant base. Strengths: cost of living A+, housing A+, employment A-; Watch: commute F.
- Waxahachie ISD (suburban): math 45% / reading 44% proficiency, ranked #253 of 826 in TX (top 31%) — families likely to look elsewhere, expect single-tenant / working-renter base with shorter leases.
- Zoned schools: Dunaway El (math 44% / reading 45%, grade F, #1,155 of 4,322 statewide, top 29%, 454 students, 64% FRL) — zoned schools average 64% FRL vs 48% district-wide (16 pts higher); higher-poverty schools than district average — tighter screening recommended.
- Market conditions: Rents rising (+3.4%/yr); 854 active listings in the ZIP; 6 comparable units currently listed for rent nearby; rentals leasing fast (median 7d on market — plan ~1-2 weeks tenant-placement turnaround); solid renter incomes; 3,016 units permitted in Ellis County in 2024 (20 in 5+ unit buildings).
- This rent runs 32% of the median local income ($86k/yr) — at the standard rent-burdened threshold; future hikes will face affordability resistance.
Forward outlook
- Local home prices are declining (-3.0%/yr); year-one equity from $2k of loan paydown is wiped out by about $7k of value loss. Plan a longer hold.
- Ellis County population projected at +36% by 2050 — long-run rental-demand tailwind backs the buy-and-hold thesis.
Negotiation context
- It's been on market 28 days — a 2% lower offer ($217k) is reasonable based on typical stale-listing flexibility.
- 3 sale attempts with the ask held roughly flat each time — persistent listings suggest the price (not the market) is what's stuck; bring a comps-based counter.
- Current owner paid $35k; list at $220k implies a 529% gain — meaningful room to come down on a strong offer.
Risks & watch-outs
- Watch-outs: built in 1940 — expect roof / HVAC / electrical / plumbing capex.
- Climate carrying-cost: major wind risk, 27% chance of damaging wind over 30y; extreme-heat days projected 7→25/yr by 2055 (HVAC capex compounding) — expect insurance premiums to compound above CPI over the hold.
Questions for the listing agent
- Built in 1940 — when were the roof, HVAC, electrical panel, plumbing, and water heater last replaced?
- Is there a deadline driving the sale (1031 exchange, divorce, estate, relocation)? That informs how much negotiation room exists.
- Schools are B-rated — typically a magnet for longer-tenancy family renters. What's the average tenant stay here, and is there a school-zone premium baked into asking?
- What's the average days-on-market for RENTAL listings here right now (not sales)? A rising rental-DOM trend means longer vacancies and softer asking-rent achievability than the comps imply.
- What's the recent tenant-quality profile in this submarket — average credit score on applications, eviction rate, late-payment / NSF rate, and stable-employment percentage? A property-management company in the area should have these aggregated.
- How much new for-sale + rental construction is in the pipeline within 1–3 miles? Heavy new supply typically softens prices + rents 12–24 months out; constrained supply supports both.
Investment metrics
- 1% rule
- 1.03% ✓
- Cap rate
- 7.40%
- Cash-on-cash
- 3.96%
- DSCR
- 1.18
- GRM
- 8.1
CMA / ARV
- ARV (on-the-fly)
- $283,092
- Comps found
- 12
Show comp detail 12 sales within ~0.75 mi
| Address | Dist | Beds/Ba | Sqft | Sold | Price | $/sf | Match |
|---|---|---|---|---|---|---|---|
| 211 Sunnyside Dr | 0.00mi | 3/2.0 | 1,522 (0%) | 1mo | $220,000 | $145 | 95 |
| 221 N Edgefield Rd | 0.21mi | 3/2.0 | 1,424 (-6%) | 1mo | $299,900 | $211 | 75 |
| 303 Pasley St | 0.39mi | 4/2.5 (+1) | 1,510 (-1%) | 2mo | $275,000 | $182 | 68 |
| 905 Ellis St | 0.25mi | 4/1.0 (+1) | 1,570 (+3%) | 22mo | $285,000 | $182 | 60 |
| 700 Ellis St | 0.42mi | 4/2.0 (+1) | 1,608 (+6%) | 7mo | $235,000 | $146 | 56 |
| 205 N Edgefield Rd | 0.30mi | 3/2.0 | 1,310 (-14%) | 10mo | $289,500 | $221 | 51 |
| 513 Dillon St | 0.59mi | 3/2.0 | 1,649 (+8%) | 10mo | $300,000 | $182 | 46 |
| 109 Terra Verde Ct | 0.45mi | 2/2.0 (-1) | 1,607 (+6%) | 21mo | $299,000 | $186 | 43 |
| 300 Haley Dr | 0.61mi | 3/2.5 | 1,633 (+7%) | 14mo | $365,000 | $224 | 42 |
| 105 Terra Verde Ct | 0.45mi | 2/2.0 (-1) | 1,642 (+8%) | 20mo | $284,500 | $173 | 40 |
| 322 Woodside Trl | 0.42mi | 3/2.0 | 1,339 (-12%) | 20mo | $379,000 | $283 | 40 |
| 309 Haley Dr | 0.60mi | 3/2.5 | 1,669 (+10%) | 20mo | $350,000 | $210 | 33 |
Match score weights: distance 35% · size 25% · config 20% · recency 20%. Top-matched comps best support the ARV.
Projected returns pro-forma
-3.0% appreciation · 3.4% rent growth · sell at horizon
- IRR
- -9.6%
- Equity multiple
- 0.65×
- Total profit
- $-21,711
- Equity at exit
- $32,803
- IRR
- 0.4%
- Equity multiple
- 1.03×
- Total profit
- $1,876
- Equity at exit
- $19,022
Cash invested: $61,600 (down + closing). Projections, not guarantees.
Landlord ↔ Tenant lean methodology
- Overall (STATE)
- 87 Strongly Landlord-Friendly
- State Texas
- 87 Strongly Landlord-Friendly · R+5
- County
- — inherits STATE
- City
- — inherits STATE
ZIP-level market 75165
- Home prices YoY
- -24.5%
- Rents YoY
- 3.4%
- Active inventory
- 854
- Price-to-rent
- 8.1×
Monthly cashflow live
- Estimated rent
- $2,273 high interval (Pro) →
- Mortgage (P&I)
- −$1,154
- Tax from tax record
- −$347 /mo · $4,162/yr
- Insurance
- −$92
- HOA
- −$0
- Vacancy / Maint / Mgmt
- −$477
- Net cashflow
- $203
Break-even live
UW: 25.0% down · 7.5% · 30yr · 1.5% tax · 5.0% vac · 8.0% maint · 8.0% mgmt
Financing live
Cash to close
- Down payment
- $55,000
- Closing costs
- $6,600
- Reserves months
- —
- Total cash needed
- —
Loan-product check · same deal, 3 products live
Conventional
25% down · 7.5% · 30yr
- Down + closing
- —
- Monthly P&I
- —
- Monthly cashflow
- —
- DSCR
- —
- Eligible?
- —
Personal DTI + credit; lowest rate.
DSCR
20% down · 8.5% · 30yr
- Down + closing
- —
- Monthly P&I
- —
- Monthly cashflow
- —
- DSCR
- —
- Eligible?
- —
No personal income docs; deal must DSCR.
Hard money
10% down · 12.0% · 12mo
- Down + closing
- —
- Monthly P&I
- —
- Monthly cashflow
- —
- DSCR
- —
- Eligible?
- —
Short-term bridge; refi at stabilization.
Rent comps 6 comps
| Address | Beds | Baths | Sqft | Rent | $/sqft | DOM | Units | Dist |
|---|---|---|---|---|---|---|---|---|
| 510 Woodside Trl Waxahachie, TX | 3.0 | 2.0 | 1472 | $2,650 | $1.80 | 1d | 1 | 0.51mi |
| 420 W Franklin St Unit 3 Waxahachie, TX | 2.0 | 1.0 | 1440 | $1,625 | $1.13 | 43d | 1 | 1.01mi |
| 408 Martin Luther King Junior Blvd Apt 302 Waxahachie, TX | 2.0 | 2.0 | 1210 | $1,850 | $1.53 | 15d | 1 | 1.05mi |
| 115 Church St Waxahachie, TX | 4.0 | 3.5 | 1914 | $2,800 | $1.46 | 7d | 1 | 1.11mi |
| 423 Dr Martin Luther King Jr Blvd Waxahachie, TX | 2.0 | 1.0 | 1152 | $1,395 | $1.21 | 7d | 1 | 1.11mi |
| 113 Church St Waxahachie, TX | 4.0 | 3.5 | 1892 | $2,800 | $1.48 | 1d | 1 | 1.11mi |
Listing history 8 events
-
2026-04-29status Pending
-
2026-04-20historical Active Option Contract
-
2026-03-14$220,000 Active
-
2025-04-14$214,900 Active
-
2025-01-16historical $1,800
-
2025-01-09$1,800
-
2004-07-07soldstatus
-
1986-08-14soldstatus $35,000
ⓘ Source: listings_history table (triggers on properties + properties_extension) + one-shot
backfill from property_details.listing_events for pre-trigger history.
Tax reassessment forecast TX · Resets to sale price
- Current annual tax
- $4,162 · $347/mo
- Projected year-2 tax
- $4,162 · $347/mo
- Expected delta
- $0/yr ($0/mo · 0.0%)
ⓘ Screening estimate from a state-policy table — verify with the county assessor before closing.
Climate risk First Street
- Flood 1/10 Low FEMA zone X (unshaded) · 0% chance over 30 yrs
- Wildfire 4/10 Moderate
- Heat 7/10 Severe 7 d/yr ≥110°F today · 25 d/yr by 30 yrs out
- Wind 6/10 Major 27% chance of damaging wind over 30 yrs
- Air quality 2/10 Low 1 unhealthy d/yr today · 2 by 30 yrs out
Nearby sold comps map
Loading sold comps map…
Walkable amenities ~0.75 mi
Loading nearby amenities…
Taxation est. · year 1
- Rental income
- $27,272
- − Mortgage interest
- −$12,323
- − Property taxes
- −$4,162
- − Insurance
- −$1,100
- − Repairs & maintenance
- −$2,182
- − Management
- −$2,182
- − Depreciation
- −$6,400
- Taxable loss
- −$1,077
- Est. tax savings @ 24.0%
- +$259
- After-tax cash flow
- $2,697/yr
For passive investors: Depreciation is non-cash, so a rental often shows a tax loss while cash-flowing — sheltering income. Rental losses are passive: they offset passive income freely, and up to $25,000/yr can offset ordinary (W-2) income if you actively participate and your MAGI is under $100k (phasing out to $0 by $150k); unused losses carry forward. On sale, claimed depreciation is recaptured at up to 25%, and gains may owe capital-gains tax (a 1031 exchange can defer both). Figures are a year-1 estimate at your 24.0% rate — not tax advice; consult a CPA.
Schools (NCES district)
- District
- Waxahachie ISD
- NCES district ID
- 4844730
- Math proficiency
- 45% ▼ -7.00%
- Reading proficiency
- 44% ▼ -6.00%
- Median HH income
- $59,434
- Composite
- 39.14/100
- National rank
- #4034
- State rank
- #253 of 826 in TX
Livability — Waxahachie
- Score
- 78/100
- State rank
- #71
- US rank
- #2592
Category grades
Schools grade is shown separately in the Schools card above.
Census & demographics
- Census place
- Waxahachie, TX
- County
- Ellis County · 199,237 people
- City population
- 67,417
- Metro
- Dallas-Fort Worth-Arlington, TX
- Population (ZIP)
- 53,513
- Household income
- $86,391
- Rent vs Own
- Severe rent burden
- 1365.0
Population outlook (Ellis County) Hauer SSP2
- Today (2025)
- 194,556 people
- By 2030
- 209,679 · +7.8%
- By 2040
- 238,837 · +22.8%
- By 2050
- 265,451 · +36.4%
- By 2075
- 326,571 · +67.9%
- By 2100
- 362,156 · +86.1%
Race, ethnicity, and origin ACS 2023
- Neighborhood character
- Diverse neighborhood (Simpson 0.60)
- Race & ethnicity
- White 56% Hispanic / Latino 26% Black 14% Two or more races 13%
- Hispanic origin (detail)
- Mexican 22%
- Common ancestry
- Slovak 2% Lithuanian 2% Italian 2%
- Foreign-born
- 7% · Canada
- Languages at home
- 84% English-only · Spanish 15%
Political lean MEDSL · Ellis
- 2024 margin
- Solid R (+31.1) · D 34.0% · R 65.1%
- 2008→2024 swing
- +11.2pp toward D · 2008: -42.2pp · 2024: -31.1pp
- All cycles
- 2024: R+31.1 2020: R+34.1 2016: R+45.4 2012: R+47.5 2008: R+42.2
Not yet ingested
- Civics
- —
Market trends
- HPI YoY
- ▼ -82.58%
- Current HPI
- 255.0247
- Rent YoY
- ▲ 3.40%
- Metro
- Dallas-Fort Worth-Arlington, TX
- State GDP YoY
- ▲ 3.95%
- F500 in state
- 110
Industry mix (Fortune 500 HQ in TX)
| Industry | F500 HQs | Revenue |
|---|---|---|
| Energy | 16 | $1,198B |
|
||
| Technology | 5 | $198B |
|
||
| Engineering / Construction | 4 | $72B |
|
||
| Energy Services | 3 | $60B |
|
||
| Utilities | 3 | $41B |
|
||
| Healthcare | 2 | $330B |
|
||
Price history
+528.6% since first listed8 events — show timeline
- 2026-04-29 Pending — NTREIS
- 2026-04-20 Contingent — NTREIS
- 2026-03-14 Listed $220,000 NTREIS
- 2025-04-14 Listed $214,900 NTREIS
- 2025-01-16 Rental Removed $1,800 NTREIS
- 2025-01-09 Listed for Rent $1,800 NTREIS
- 2004-07-07 Sold (Public Records) — Public Records
- 1986-08-14 Sold (Public Records) $35,000 Public Records
Property tax history
+11.1%/yrLatest (2025): $4,162 · +14.0% YoY. Source: county tax records.
Cash-flow waterfall
monthlySold comps — $/sqft
last 12 mo · ≤1 miLoading sold comps…