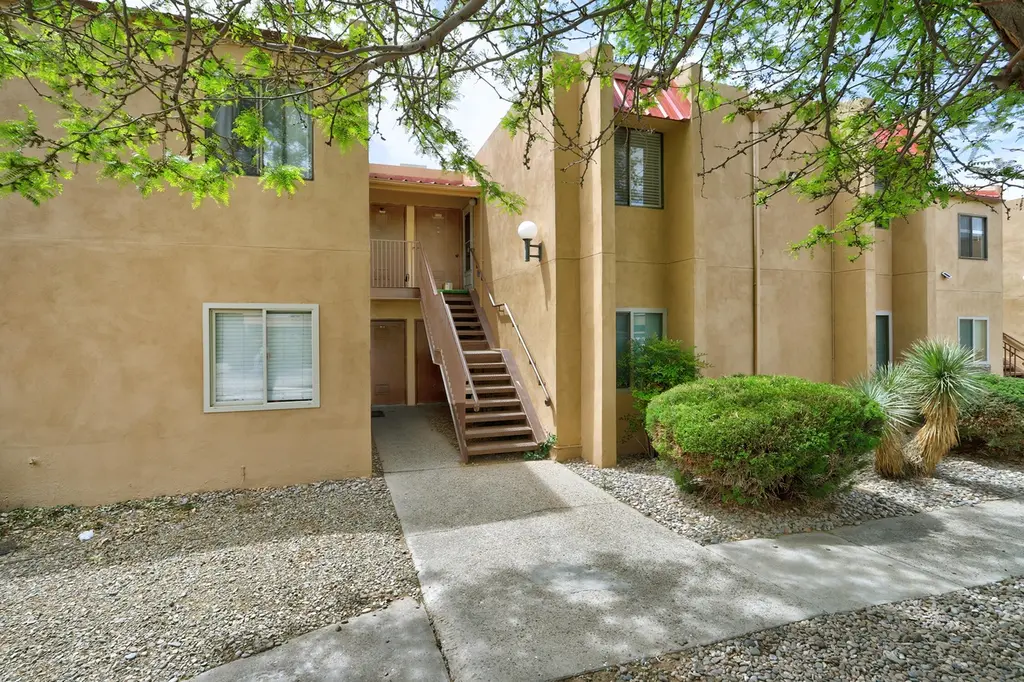
911 Country Club Dr SE Apt E · Rio Rancho, NM
Flood risk 1/10 · Minimal
- FEMA flood zone
- X (unshaded)
- Chance of flooding over 30 yrs
- 0.0%
- Est. flood insurance / yr
- $507 – $1,088
Fire risk 3/10 · Minor
- Est. fire insurance / yr
- $706 – $1,312
Heat risk 4/10 · Minor
- Hot days now (above 95°F)
- 6 days/yr
- Hot days in 30 yrs
- 14 days/yr
Wind risk 1/10 · Minimal
- Chance of severe wind over 30 yrs
- —
Air-quality risk 3/10 · Minor
- Unhealthy air days now
- 3 days/yr
- Unhealthy air days in 30 yrs
- 4 days/yr
Risk factors via First Street. Map © Google.
Why this score? — see what drove the D grade
The composite is a weighted blend of 9 inputs, each scored 0–100. Each bar is that input's sub-score; the figure is the points it added to the 100-point composite (weight × sub-score).
- Cash flow +12.0/30.0
- ARV discount +7.5/15.0
- Schools +5.2/10.0
- 1% rule +3.7/10.0
- DSCR +3.6/10.0
- Livability +3.6/5.0
- Rent growth +3.3/5.0
- Condition / age +2.5/5.0
- Appreciation +0.0/10.0
$187,500
🖨 Deal sheet (PDF) 📄 Offer letter ✓ Due diligence
Listing remarks
Conveniently located, and afforably priced two bedroom condo at the Fairways. Well taken care of unit, with 1.5 baths. Living and dining area. Light and bright kitchen. Updated stainless steel appliances. One year old water heater. Stylish tile in the bathroom. Catch some fresh air on the enclosed patio. Newer washer and dryer included. Live in comfort, be close to it all. See it, love it, own it, today!
Key facts
- Enclosed patio
- $200 HOA
- Parking
Tags
Property features AI
Finance
- Other: Property is a resale; Zoning: R-1; Multi-unit property (4 total units)
- HOA & community: Homeowners association with a $200 monthly fee; HOA covers clubhouse, common areas, and pool(s)
Exterior
- Parking: Carport (1 space)
- Utilities: Electricity connected; Natural gas connected; Water connected (public); Sewer connected (public); Cable available; Phone available
- Home design: 2 stories; Entry level: 2; Faces east; Attached property
- Construction: Frame and stucco construction; Flat roof
- Exterior features: Community pool
Interior
- Kitchen: Dishwasher; Free-standing electric range
- Bedrooms: Main level bedroom
- Flooring: Carpet; Tile; Vinyl
- Bathrooms: 1 full bathroom; 1 half bathroom
- Heating & cooling: Central heating; Forced air; Natural gas heating; Refrigerated cooling
- Interior features: Main level primary; Vinyl window frames
- Laundry & utility: Washer; Dryer; Electric dryer hookup
Neighborhood map
What this means for you Summary
Snapshot
- This is a 2-bed/1.5-bath condo listed at $188k.
Deal economics
- At list price, monthly cash flow is $-43 ($-520/yr) — negative.
- To cash-flow at today's rent, offer at most $180k (4.1% below list).
- To meet the 1% rule (rent ≥ 1% of price), the offer needs to be $163k (13.3% below list).
- Recommended offer: $163k (13.3% below list) — sets the bar for 1% rule.
- Cap rate 6.0% vs local median 3.6% in Rio Rancho — top-decile yield for the area; either an underpriced asset or a hidden risk that comps aren't pricing in. Stress-test before assuming the spread holds.
Location & tenants
- Location reads 71/100 on livability (#17 in NM) — a middle-class / working-renter tenant base. Strengths: housing A+, cost of living A; Watch: amenities D, commute F.
- Rio Rancho Public Schools (suburban): math 48% / reading 73% proficiency, ranked #4 of 29 in NM (top 14%) — acceptable for families but not a draw, mixed tenant base, ~2y average lease.
- Zoned schools: Martin King Jr Elementary (628 students, 16% FRL); Lincoln Middle (823 students, 21% FRL); Rio Rancho High (math 52% / reading 77%, grade B-, #22 of 110 statewide, top 22%, 2,573 students, 22% FRL) — zoned schools average 20% FRL vs 36% district-wide (16 pts lower); this property's tenant base skews higher-income than the district average.
- Market conditions: Rents rising (+3.1%/yr); 837 active listings in the ZIP; 15 comparable units currently listed for rent nearby; rentals leasing fast (median 5d on market — plan ~1-2 weeks tenant-placement turnaround); solid renter incomes; 1,278 units permitted in Sandoval County in 2024 (216 in 5+ unit buildings).
Forward outlook
- Local home prices are declining (-3.0%/yr); year-one equity from $1k of loan paydown is wiped out by about $6k of value loss. Plan a longer hold.
- Sandoval County population projected at +15% by 2050 — long-run rental-demand tailwind backs the buy-and-hold thesis.
Negotiation context
- It's been on market 65 days — a 6% lower offer ($176k) is reasonable based on typical stale-listing flexibility.
Questions for the listing agent
- What do current leases actually rent for vs. the listed asking? Can we see a recent rent roll and the last 12 months of T-12 income?
- It's been on market 65 days. Have you received any prior offers? Is the seller open to a 13% concession, seller financing, or rate buy-down credit?
- Built in 1974 — when were the roof, HVAC, electrical panel, plumbing, and water heater last replaced?
- What does the HOA fee cover, when was the last increase, and are there any pending special assessments or reserve-fund shortfalls?
- Any open or pending special assessments — roof, HVAC, plumbing, elevator, façade? What's the per-unit balance and payoff schedule, and is the seller paying it off at close or rolling it to the buyer?
- Why hasn't it sold? Are there any deal-killer items the seller is aware of (foundation, flood, title, zoning, code violations)?
- Is there a deadline driving the sale (1031 exchange, divorce, estate, relocation)? That informs how much negotiation room exists.
- The area grade is low — what's the realistic commute time and amenity access for the typical tenant pool here? Any planned neighborhood developments (good or bad) we should know about?
- What's the average days-on-market for RENTAL listings here right now (not sales)? A rising rental-DOM trend means longer vacancies and softer asking-rent achievability than the comps imply.
- What's the recent tenant-quality profile in this submarket — average credit score on applications, eviction rate, late-payment / NSF rate, and stable-employment percentage? A property-management company in the area should have these aggregated.
- How much new apartment / multifamily construction is in the pipeline within 1–3 miles? Heavy new supply (>2% of stock underway) typically softens rents 12–24 months out; light construction supports rent growth.
Investment metrics
- 1% rule
- 0.87% ✗
- Cap rate
- 6.02%
- Cash-on-cash
- -0.99%
- DSCR
- 0.96
- GRM
- 9.6
CMA / ARV
No comps found within radius.
Projected returns pro-forma
-3.0% appreciation · 3.13% rent growth · sell at horizon
- IRR
- -17.8%
- Equity multiple
- 0.37×
- Total profit
- $-32,887
- Equity at exit
- $27,957
- IRR
- -9.6%
- Equity multiple
- 0.41×
- Total profit
- $-31,136
- Equity at exit
- $16,212
Cash invested: $52,500 (down + closing). Projections, not guarantees.
Landlord ↔ Tenant lean methodology
- Overall (STATE)
- 55 Moderately Landlord-Leaning
- State New Mexico
- 55 Moderately Landlord-Leaning · D+3
- County
- — inherits STATE
- City
- — inherits STATE
ZIP-level market 87124
- Rents YoY
- 3.1%
- Active inventory
- 837
- Price-to-rent
- 9.6×
Monthly cashflow live
- Estimated rent
- $1,626 high interval (Pro) →
- Mortgage (P&I)
- −$983
- Tax from tax record
- −$67 /mo · $801/yr
- Insurance
- −$78
- HOA
- −$200
- Vacancy / Maint / Mgmt
- −$342
- Net cashflow
- $-43
Break-even live
Sensitivity live
| Price | -10% $63 | -5% $10 | +0% $-43 | +5% $-96 | +10% $-149 |
|---|---|---|---|---|---|
| Rent | -10% $-172 | -5% $-108 | +0% $-43 | +5% $21 | +10% $85 |
| Rate | -1.0pp $51 | -0.5pp $4 | base $-43 | +0.5pp $-92 | +1.0pp $-141 |
UW: 25.0% down · 7.5% · 30yr · 1.5% tax · 5.0% vac · 8.0% maint · 8.0% mgmt
Financing live
Cash to close
- Down payment
- $46,875
- Closing costs
- $5,625
- Reserves months
- —
- Total cash needed
- —
Loan-product check · same deal, 3 products live
Conventional
25% down · 7.5% · 30yr
- Down + closing
- —
- Monthly P&I
- —
- Monthly cashflow
- —
- DSCR
- —
- Eligible?
- —
Personal DTI + credit; lowest rate.
DSCR
20% down · 8.5% · 30yr
- Down + closing
- —
- Monthly P&I
- —
- Monthly cashflow
- —
- DSCR
- —
- Eligible?
- —
No personal income docs; deal must DSCR.
Hard money
10% down · 12.0% · 12mo
- Down + closing
- —
- Monthly P&I
- —
- Monthly cashflow
- —
- DSCR
- —
- Eligible?
- —
Short-term bridge; refi at stabilization.
Rent comps 15 comps
| Address | Beds | Baths | Sqft | Rent | $/sqft | DOM | Units | Dist |
|---|---|---|---|---|---|---|---|---|
| 925 Country Club Dr SE Rio Rancho, NM | 2.0 | 2.0 | 1045 | $1,600 | $1.53 | 4d | 1 | 0.10mi |
| 833 Country Club Dr SE Unit 1A Rio Rancho, NM | 2.0 | 2.0 | 1156 | $1,500 | $1.30 | 4d | 1 | 0.18mi |
| 937 Country Club Dr SE Unit J Rio Rancho, NM | 2.0 | 1.5 | 1100 | $1,300 | $1.18 | 45d | 1 | 0.18mi |
| 900 Country Club Dr SE Rio Rancho, NM | 1.0–2.0 | 1.0–2.0 | 730 | $1,567 | $2.15 | 3d | 12 | 0.28mi |
| 201 Pinnacle Dr SE Rio Rancho, NM | 1.0–3.0 | 1.0–2.0 | 1095 | $1,618 | $1.48 | 3d | 26 | 0.88mi |
| 2517 Bogie Rd SE Rio Rancho, NM | 3.0 | 2.0 | 1430 | $1,950 | $1.36 | 4d | 1 | 0.97mi |
| 2220 Mayapan Rd SE Rio Rancho, NM | 3.0 | 2.0 | 1286 | $1,850 | $1.44 | 12d | 1 | 0.99mi |
| 598 Turmalina DR SE Albuquerque, NM | 3.0 | 2.0 | 1440 | $2,375 | $1.65 | 45d | 1 | 1.13mi |
| 37 Parkside Rd SE Rio Rancho, NM | 3.0 | 3.0 | 1445 | $2,600 | $1.80 | 4d | 1 | 1.18mi |
| 4101 Meadowlark Ln SE Rio Rancho, NM | 1.0–2.0 | 1.0–2.0 | 703 | $1,620 | $2.30 | 4d | 12 | 1.36mi |
| 4248 Sabana Loop SE Rio Rancho, NM | 2.0 | 2.0 | 800 | $1,500 | $1.88 | 45d | 1 | 1.41mi |
| 305 Geraldine Rd SE Unit A Rio Rancho, NM | 2.0 | 1.0 | 912 | $1,300 | $1.43 | 25d | 1 | 1.44mi |
| 1011 Meadowlark Ct SE Apt 2 Rio Rancho, NM | 2.0 | 1.0 | 820 | $1,250 | $1.52 | 4d | 1 | 1.46mi |
| 1071 Meadowlark Ct SE Rio Rancho, NM | 2.0 | 1.0 | 950 | $1,500 | $1.58 | 4d | 1 | 1.49mi |
| 325 Geraldine Loop SE Apt A Rio Rancho, NM | 2.0 | 1.5 | 900 | $1,295 | $1.44 | 45d | 1 | 1.49mi |
HOA detail condo
- Monthly dues
- $200 · $2,400/yr
- Likely covers
- water
- Assessments
- None detected in remarks — confirm with the listing agent.
Listing history 17 events
-
2026-06-21days on market $187,500 Active 65 DOM
-
2026-06-18days on market $187,500 Active 62 DOM
-
2026-06-17days on market $187,500 Active 61 DOM
-
2026-06-16days on market $187,500 Active 60 DOM
-
2026-06-15days on market $187,500 Active 59 DOM
-
2026-06-13days on market $187,500 Active 57 DOM
-
2026-06-13days on market $187,500 Active 56 DOM
-
2026-06-10days on market $187,500 Active 54 DOM
-
2026-06-09days on market $187,500 Active 53 DOM
-
2026-06-08days on market $187,500 Active 52 DOM
-
2026-06-07days on market $187,500 Active 51 DOM
-
2026-06-03days on market $187,500 Active 47 DOM
-
2026-06-02days on market $187,500 Active 46 DOM
-
2026-06-01days on market $187,500 Active 45 DOM
-
2026-05-31days on market $187,500 Active 44 DOM
-
2026-04-27price $187,500 407-char remark
-
2026-04-14$189,900 Active 407-char remark
ⓘ Source: listings_history table (triggers on properties + properties_extension) + one-shot
backfill from property_details.listing_events for pre-trigger history.
Tax reassessment forecast NM · Resets to sale price
- Current annual tax
- $801 · $67/mo
- Projected year-2 tax
- $1,500 · $125/mo
- Expected delta
- +$699/yr (+$58/mo · 87.2%)
ⓘ Screening estimate from a state-policy table — verify with the county assessor before closing.
Climate risk First Street
- Flood 1/10 Low FEMA zone X (unshaded) · 0% chance over 30 yrs
- Wildfire 3/10 Moderate
- Heat 4/10 Moderate 6 d/yr ≥95°F today · 14 d/yr by 30 yrs out
- Wind 1/10 Low
- Air quality 3/10 Moderate 3 unhealthy d/yr today · 4 by 30 yrs out
Nearby sold comps map
Loading sold comps map…
Walkable amenities ~0.75 mi
Loading nearby amenities…
Taxation est. · year 1
- Rental income
- $19,516
- − Mortgage interest
- −$10,503
- − Property taxes
- −$801
- − Insurance
- −$938
- − Repairs & maintenance
- −$1,561
- − Management
- −$1,561
- − HOA
- −$2,400
- − Depreciation
- −$5,455
- Taxable loss
- −$3,703
- Est. tax savings @ 24.0%
- +$889
- After-tax cash flow
- $368/yr
For passive investors: Depreciation is non-cash, so a rental often shows a tax loss while cash-flowing — sheltering income. Rental losses are passive: they offset passive income freely, and up to $25,000/yr can offset ordinary (W-2) income if you actively participate and your MAGI is under $100k (phasing out to $0 by $150k); unused losses carry forward. On sale, claimed depreciation is recaptured at up to 25%, and gains may owe capital-gains tax (a 1031 exchange can defer both). Figures are a year-1 estimate at your 24.0% rate — not tax advice; consult a CPA.
Schools (NCES district)
- District
- Rio Rancho Public Schools
- NCES district ID
- 3500010
- Math proficiency
- 48% ▲ 38.00%
- Reading proficiency
- 73% ▲ 48.00%
- Median HH income
- $59,410
- Composite
- 52.29/100
- National rank
- #1595
- State rank
- #4 of 29 in NM
Livability — Rio Rancho
- Score
- 71/100
- State rank
- #17
- US rank
- #7253
Category grades
Schools grade is shown separately in the Schools card above.
Census & demographics
- Census place
- Rio Rancho, NM
- County
- Sandoval County · 110,336 people
- City population
- 110,336
- Metro
- Albuquerque, NM
- Population (ZIP)
- 58,499
- Household income
- $86,555
- Rent vs Own
- Severe rent burden
- 1027.0
Population outlook (Sandoval County) Hauer SSP2
- Today (2025)
- 155,072 people
- By 2030
- 161,714 · +4.3%
- By 2040
- 171,831 · +10.8%
- By 2050
- 178,536 · +15.1%
- By 2075
- 192,517 · +24.1%
- By 2100
- 197,952 · +27.7%
Race, ethnicity, and origin ACS 2023
- Neighborhood character
- Diverse neighborhood (Simpson 0.61)
- Race & ethnicity
- White 47% Hispanic / Latino 41% Two or more races 18% Native American 5% Black 3% Asian 2%
- Hispanic origin (detail)
- Mexican 24% Puerto Rican 2%
- Common ancestry
- Lithuanian 3% Slovak 2% Italian 2%
- Foreign-born
- 6% · Canada, Vietnam, China
- Languages at home
- 84% English-only · Spanish 12% Vietnamese 1%
Political lean MEDSL · Sandoval
- 2024 margin
- Lean D (+5.8) · D 51.8% · R 46.0% · Other 2.2%
- 2008→2024 swing
- -7.0pp toward R · 2008: 12.8pp · 2024: 5.8pp
- All cycles
- 2024: D+5.8 2020: D+8.4 2016: D+2.7 2012: D+5.1 2008: D+12.8
Not yet ingested
- Civics
- —
Market trends
- HPI YoY
- ▼ -303.50%
- Current HPI
- 219.8377
- Rent YoY
- ▲ 3.13%
- Metro
- Albuquerque, NM
- State GDP YoY
- —
- F500 in state
- 0
Price history
-1.3% since first listed2 events — show timeline
- 2026-04-27 Price Changed $187,500 Southwest MLS
- 2026-04-14 Listed $189,900 Southwest MLS
Property tax history
-3.3%/yrLatest (2024): $801 · +2.6% YoY. Source: county tax records.
Cash-flow waterfall
monthlySold comps — $/sqft
last 12 mo · ≤1 miLoading sold comps…