5840 Grain Mill Rd · Pahrump, NV
Flood risk 1/10 · Minimal
- FEMA flood zone
- X (shaded)
- Chance of flooding over 30 yrs
- 0.0%
- Est. flood insurance / yr
- $507 – $1,088
Fire risk 6/10 · Moderate
- Est. fire insurance / yr
- $490 – $910
Heat risk 7/10 · Major
- Hot days now (above 102°F)
- 7 days/yr
- Hot days in 30 yrs
- 18 days/yr
Wind risk 1/10 · Minimal
- Chance of severe wind over 30 yrs
- —
Air-quality risk 1/10 · Minimal
- Unhealthy air days now
- 0 days/yr
- Unhealthy air days in 30 yrs
- 0 days/yr
Risk factors via First Street. Map © Google.
Why this score? — see what drove the D+ grade
The composite is a weighted blend of 9 inputs, each scored 0–100. Each bar is that input's sub-score; the figure is the points it added to the 100-point composite (weight × sub-score).
- ARV discount +15.0/15.0
- Cash flow +11.0/30.0
- Appreciation +6.4/10.0
- Livability +3.4/5.0
- DSCR +3.2/10.0
- Rent growth +2.5/5.0
- Condition / age +2.5/5.0
- Schools +2.2/10.0
- 1% rule +2.1/10.0
$375,000
🖨 Deal sheet (PDF) 📄 Offer letter ✓ Due diligence
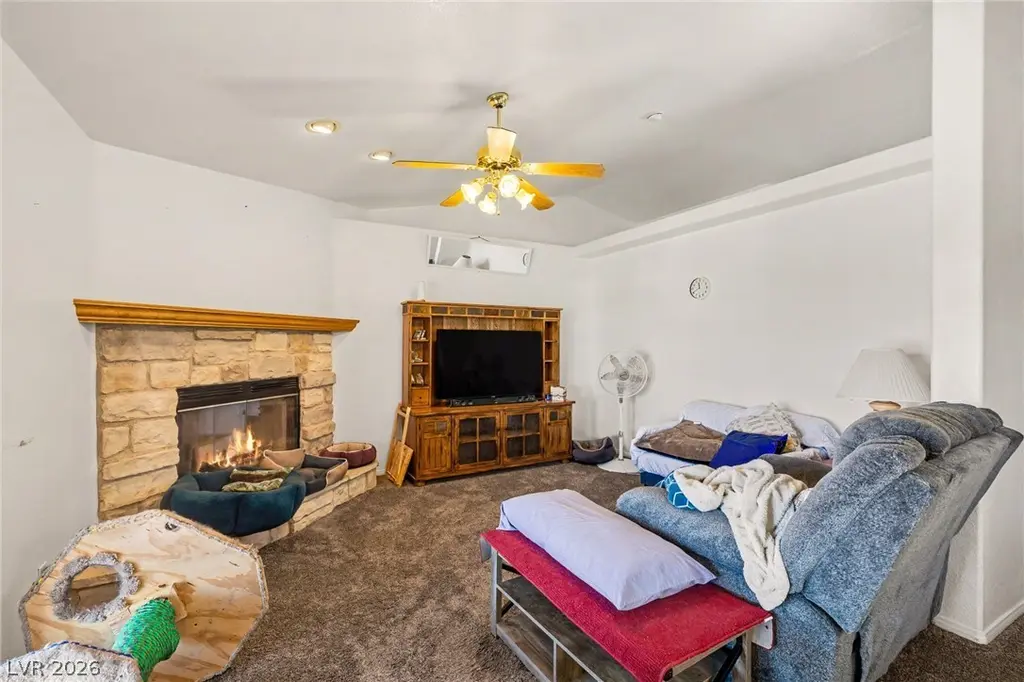
Listing remarks
Welcome to this beautiful 4-bedroom, 2.5-bathroom home situated on a massive lot with breathtaking, snow-capped mountain views. From the moment you arrive, you'll appreciate the extended driveway and convenient RV access, offering plenty of secure parking for your boat, RV, and outdoor toys. Inside, the spacious layout shines with quality upgrades throughout, highlighted by a large kitchen designed perfectly for cooking, gathering, and entertaining guests. The interior flows seamlessly to the oversized backyard—a blank canvas with endless potential where you can relax and take in picturesque sunsets and mountain vistas right from your own property. Combining rare space, premium views,
Key facts
- Mountain vistas
- Rv access
- Large kitchen
Tags
Property features AI
Finance
- HOA & community: Homeowner association: COTTONWOOD; Annual association fee of $198 covering common areas and taxes
Exterior
- Parking: Attached garage with RV access/parking; Private attached 2-car garage
- Utilities: Above-ground utilities; Electricity available; Public water; Public sewer
- Home design: Single-family property; One-story; Faces south; Resale property
- Construction: Tile roof; Resale construction
- Exterior features: Courtyard; Covered patio; Private yard; Block fencing in back yard; Desert landscaping; Landscaped
Interior
- Kitchen: Breakfast bar / counter; Breakfast nook / eating area; Tile flooring; Walk-in pantry; Dishwasher; Electric range; Disposal; Microwave; Refrigerator
- Bedrooms: Up to 4 bedrooms; Primary bedroom downstairs with private bath and walk-in closet; Other bedrooms include ceiling fan, ceiling light, and closet
- Flooring: Carpet; Ceramic tile; Linoleum; Vinyl
- Bathrooms: 2 full bathrooms; 1 half bathroom
- Heating & cooling: Central heating (electric); Central air conditioning (electric)
- Interior features: Double-pane windows; Skylights; Window treatments; Ceiling fans; Primary bedroom located downstairs; Bedroom on main level; Unfurnished
- Laundry & utility: Main level laundry room; Electric dryer hookup; Washer; Dryer
Neighborhood map
What this means for you Summary
Snapshot
- This is a 4-bed/2.5-bath single-family listed at $375k.
Deal economics
- At list price, monthly cash flow is $-156 ($-2k/yr) — negative.
- To cash-flow at today's rent, offer at most $347k (7.3% below list).
- To meet the 1% rule (rent ≥ 1% of price), the offer needs to be $268k (28.6% below list).
- Recommended offer: $268k (28.6% below list) — sets the bar for 1% rule.
- Cap rate 5.8% vs local median 3.4% in Pahrump — top-decile yield for the area; either an underpriced asset or a hidden risk that comps aren't pricing in. Stress-test before assuming the spread holds.
Location & tenants
- Location reads 68/100 on livability (#30 in NV) — a middle-class / working-renter tenant base. Strengths: cost of living A+, housing A+, health & safety A+; Watch: employment D, crime F, amenities F.
- Nye County School District (rural): math 20% / reading 33% proficiency, ranked #16 of 17 in NV (top 94%) — low school quality limits family demand, transient renter base, plan for 1-2y turnover.
- Zoned schools: Hafen Elementary School (math 23% / reading 36%, grade F, #195 of 402 statewide, top 53%, 440 students, 100% FRL); Rosemary Clarke Middle School (math 20% / reading 31%, grade F, #62 of 109 statewide, top 58%, 1,060 students, 100% FRL); Pahrump Valley High School (math 14% / reading 41%, grade F, #74 of 131 statewide, top 56%, 1,362 students, 100% FRL) — zoned schools average 100% FRL vs 54% district-wide (46 pts higher); higher-poverty schools than district average — tighter screening recommended.
- Market conditions: 281 active listings in the ZIP; 2 comparable units currently listed for rent nearby; solid renter incomes.
- This rent runs 41% of the median local income ($78k/yr) — at the standard rent-burdened threshold; future hikes will face affordability resistance.
Forward outlook
- In year one you build about $13k of equity ($3k loan paydown + $10k appreciation (2.8% local appreciation)).
- Nye County population projected at -28% by 2050 — secular population decline; favor cash flow + early exit over multi-decade hold.
- By year 3, paydown + projected appreciation supports a ~$33k cash-out refi (75% LTV) — recoverable capital for the next deal without selling this one.
Negotiation context
- It's been on market 31 days — a 3% lower offer ($364k) is reasonable based on typical stale-listing flexibility.
- 3 sale attempts; this cycle's ask has dropped $50k (12%) from the opening price — seller is motivated, your offer sets the floor, not the list.
Risks & watch-outs
- Climate carrying-cost: major wildfire risk; extreme-heat days projected 7→18/yr by 2055 (HVAC capex compounding) — expect insurance premiums to compound above CPI over the hold.
Questions for the listing agent
- What do current leases actually rent for vs. the listed asking? Can we see a recent rent roll and the last 12 months of T-12 income?
- It's been on market 31 days. Have you received any prior offers? Is the seller open to a 29% concession, seller financing, or rate buy-down credit?
- What does the HOA fee cover, when was the last increase, and are there any pending special assessments or reserve-fund shortfalls?
- Is there a deadline driving the sale (1031 exchange, divorce, estate, relocation)? That informs how much negotiation room exists.
- Schools are F-rated, which usually means shorter tenancies and higher turnover. Who's the typical renter profile here, and what's been the actual vacancy rate?
- Crime grade is F in this area — have there been break-ins, vandalism, or insurance claims at this property in the last 3 years? What carrier currently insures it and at what premium?
- The area grade is low — what's the realistic commute time and amenity access for the typical tenant pool here? Any planned neighborhood developments (good or bad) we should know about?
- What's the average days-on-market for RENTAL listings here right now (not sales)? A rising rental-DOM trend means longer vacancies and softer asking-rent achievability than the comps imply.
- What's the recent tenant-quality profile in this submarket — average credit score on applications, eviction rate, late-payment / NSF rate, and stable-employment percentage? A property-management company in the area should have these aggregated.
- How much new for-sale + rental construction is in the pipeline within 1–3 miles? Heavy new supply typically softens prices + rents 12–24 months out; constrained supply supports both.
Investment metrics
- 1% rule
- 0.71% ✗
- Cap rate
- 5.79%
- Cash-on-cash
- -1.78%
- DSCR
- 0.92
- GRM
- 11.7
CMA / ARV
- ARV (on-the-fly)
- $534,157
- Comps found
- 12
Show comp detail 12 sales within ~0.75 mi
| Address | Dist | Beds/Ba | Sqft | Sold | Price | $/sf | Match |
|---|---|---|---|---|---|---|---|
| 5450 Grain Mill Rd | 0.38mi | 4/4.0 | 2,347 (-3%) | 3mo | $490,000 | $209 | 68 |
| 5981 Doubletree Rd | 0.43mi | 3/3.0 (-1) | 2,387 (-1%) | 8mo | $400,000 | $168 | 65 |
| 6751 Sandpebble | 0.59mi | 4/3.0 | 2,384 (-1%) | 4mo | $520,000 | $218 | 64 |
| 5351 Fieldstone Dr | 0.52mi | 4/2.5 | 2,284 (-6%) | 3mo | $441,000 | $193 | 64 |
| 6430 Wagon Wheel Ct | 0.15mi | 3/2.0 (-1) | 2,100 (-13%) | 3mo | $465,000 | $221 | 61 |
| 5371 E Bridger St | 0.51mi | 3/2.0 (-1) | 2,313 (-4%) | 1mo | $450,000 | $195 | 61 |
| 5331 Deerfield Ct | 0.53mi | 4/3.0 | 2,217 (-8%) | 7mo | $495,000 | $223 | 54 |
| 5410 Fernwood Ct | 0.73mi | 3/2.5 (-1) | 2,575 (+6%) | 4mo | $374,999 | $146 | 46 |
| 6670 White Eagle Dr | 0.54mi | 3/2.0 (-1) | 2,119 (-12%) | 7mo | $506,900 | $239 | 41 |
| 6761 S Sandpebble St | 0.61mi | 3/3.0 (-1) | 2,090 (-14%) | 3mo | $467,801 | $224 | 40 |
| 6680 Stubblefield | 0.64mi | 3/3.0 (-1) | 2,094 (-13%) | 2mo | $469,950 | $224 | 39 |
| 5170 S Fairmont Ct | 0.75mi | 3/3.0 (-1) | 2,090 (-14%) | 3mo | $464,000 | $222 | 33 |
Match score weights: distance 35% · size 25% · config 20% · recency 20%. Top-matched comps best support the ARV.
Projected returns pro-forma
2.78% appreciation · 3.0% rent growth · sell at horizon
- IRR
- 5.2%
- Equity multiple
- 1.29×
- Total profit
- $30,820
- Equity at exit
- $164,083
- IRR
- 8.3%
- Equity multiple
- 2.23×
- Total profit
- $128,827
- Equity at exit
- $249,403
Cash invested: $105,000 (down + closing). Projections, not guarantees.
Landlord ↔ Tenant lean methodology
- Overall (STATE)
- 71 Landlord-Friendly
- State Nevada
- 71 Landlord-Friendly · R+1
- County
- — inherits STATE
- City
- — inherits STATE
ZIP-level market 89061
- Home prices YoY
- 1.1%
- Active inventory
- 281
- Price-to-rent
- 11.7×
Monthly cashflow live
- Estimated rent
- $2,678 medium interval (Pro) →
- Mortgage (P&I)
- −$1,967
- Tax from tax record
- −$132 /mo · $1,580/yr
- Insurance
- −$156
- HOA
- −$17
- Vacancy / Maint / Mgmt
- −$562
- Net cashflow
- $-156
Break-even live
Sensitivity live
| Price | -10% $56 | -5% $-50 | +0% $-156 | +5% $-262 | +10% $-368 |
|---|---|---|---|---|---|
| Rent | -10% $-368 | -5% $-262 | +0% $-156 | +5% $-50 | +10% $56 |
| Rate | -1.0pp $33 | -0.5pp $-61 | base $-156 | +0.5pp $-253 | +1.0pp $-352 |
UW: 25.0% down · 7.5% · 30yr · 1.5% tax · 5.0% vac · 8.0% maint · 8.0% mgmt
Financing live
Cash to close
- Down payment
- $93,750
- Closing costs
- $11,250
- Reserves months
- —
- Total cash needed
- —
Loan-product check · same deal, 3 products live
Conventional
25% down · 7.5% · 30yr
- Down + closing
- —
- Monthly P&I
- —
- Monthly cashflow
- —
- DSCR
- —
- Eligible?
- —
Personal DTI + credit; lowest rate.
DSCR
20% down · 8.5% · 30yr
- Down + closing
- —
- Monthly P&I
- —
- Monthly cashflow
- —
- DSCR
- —
- Eligible?
- —
No personal income docs; deal must DSCR.
Hard money
10% down · 12.0% · 12mo
- Down + closing
- —
- Monthly P&I
- —
- Monthly cashflow
- —
- DSCR
- —
- Eligible?
- —
Short-term bridge; refi at stabilization.
Rent comps 2 comps
| Address | Beds | Baths | Sqft | Rent | $/sqft | DOM | Units | Dist |
|---|---|---|---|---|---|---|---|---|
| 5720 Al Fresco Ave Pahrump, NV | 3.0 | 2.0 | 2245 | $2,350 | $1.05 | 25d | 1 | 1.46mi |
| 4881 Castello Way Pahrump, NV | 3.0 | 2.0 | 1772 | $2,035 | $1.15 | 22d | 1 | 1.48mi |
HOA detail
- Monthly dues
- $17 · $204/yr
Listing history 21 events
-
2026-06-19days on market $375,000 Active 31 DOM
-
2026-06-18days on market $375,000 Active 30 DOM
-
2026-06-17days on market $375,000 Active 29 DOM
-
2026-06-16days on market $375,000 Active 28 DOM
-
2026-06-15days on market $375,000 Active 27 DOM
-
2026-06-14days on market $375,000 Active 25 DOM
-
2026-06-12days on market $375,000 Active 24 DOM
-
2026-06-09days on market $375,000 Active 21 DOM
-
2026-06-08days on market $375,000 Active 20 DOM
-
2026-06-07pricedays on market $375,000 Active 19 DOM
-
2026-06-03days on market $425,000 Active 15 DOM
-
2026-06-02days on market $425,000 Active 14 DOM
-
2026-06-01days on market $425,000 Active 13 DOM
-
2026-05-31days on market $425,000 Active 12 DOM
-
2026-05-30days on market $425,000 Active 11 DOM
-
2026-05-13price $425,000 618-char remark
-
2026-04-25price $465,000 618-char remark
-
2026-04-17$500,000 Active 618-char remark
-
2026-04-14historical $500,000 618-char remark
-
2025-02-05historical
-
2025-01-19$485,000 Active
ⓘ Source: listings_history table (triggers on properties + properties_extension) + one-shot
backfill from property_details.listing_events for pre-trigger history.
Tax reassessment forecast NV · Resets to sale price
- Current annual tax
- $1,580 · $132/mo
- Projected year-2 tax
- $2,212 · $184/mo
- Expected delta
- +$632/yr (+$53/mo · 40.0%)
ⓘ Screening estimate from a state-policy table — verify with the county assessor before closing.
Climate risk First Street
- Flood 1/10 Low FEMA zone X (shaded) · 0% chance over 30 yrs
- Wildfire 6/10 Major
- Heat 7/10 Severe 7 d/yr ≥102°F today · 18 d/yr by 30 yrs out
- Wind 1/10 Low
- Air quality 1/10 Low 0 unhealthy d/yr today · 0 by 30 yrs out
Nearby sold comps map
Loading sold comps map…
Walkable amenities ~0.75 mi
Loading nearby amenities…
Taxation est. · year 1
- Rental income
- $32,133
- − Mortgage interest
- −$21,006
- − Property taxes
- −$1,580
- − Insurance
- −$1,875
- − Repairs & maintenance
- −$2,571
- − Management
- −$2,571
- − HOA
- −$204
- − Depreciation
- −$10,909
- Taxable loss
- −$8,582
- Est. tax savings @ 24.0%
- +$2,060
- After-tax cash flow
- $187/yr
For passive investors: Depreciation is non-cash, so a rental often shows a tax loss while cash-flowing — sheltering income. Rental losses are passive: they offset passive income freely, and up to $25,000/yr can offset ordinary (W-2) income if you actively participate and your MAGI is under $100k (phasing out to $0 by $150k); unused losses carry forward. On sale, claimed depreciation is recaptured at up to 25%, and gains may owe capital-gains tax (a 1031 exchange can defer both). Figures are a year-1 estimate at your 24.0% rate — not tax advice; consult a CPA.
Schools (NCES district)
- District
- Nye County School District
- NCES district ID
- 3200360
- Math proficiency
- 20% ▼ -6.00%
- Reading proficiency
- 33% ▼ -5.00%
- Median HH income
- $41,447
- Composite
- 22.43/100
- National rank
- #8110
- State rank
- #16 of 17 in NV
Livability — Pahrump
- Score
- 68/100
- State rank
- #30
- US rank
- #9226
Category grades
Schools grade is shown separately in the Schools card above.
Census & demographics
- Census place
- Pahrump, NV
- County
- Nye County · 47,491 people
- City population
- 47,491
- Metro
- Pahrump, NV
- Population (ZIP)
- 8,141
- Household income
- $77,991
- Rent vs Own
- Severe rent burden
- 52.0
Population outlook (Nye County) Hauer SSP2
- Today (2025)
- 40,727 people
- By 2030
- 38,812 · -4.7%
- By 2040
- 33,952 · -16.6%
- By 2050
- 29,393 · -27.8%
- By 2075
- 21,122 · -48.1%
- By 2100
- 14,400 · -64.6%
Race, ethnicity, and origin ACS 2023
- Neighborhood character
- Predominantly White (67%)
- Race & ethnicity
- White 67% Hispanic / Latino 18% Two or more races 8% Asian 2% Black 2% Native American 2% Pacific Islander 1%
- Hispanic origin (detail)
- Mexican 15% Puerto Rican 1%
- Common ancestry
- Lithuanian 5% Romanian 2% Portuguese 2%
- Foreign-born
- 6% · Canada
- Languages at home
- 90% English-only · Spanish 7% Other Asian/Pacific 1% Other Indo-European 1%
Political lean MEDSL · Nye
- 2024 margin
- Solid R (+42.2) · D 28.0% · R 70.2% · Other 1.8%
- 2008→2024 swing
- -28.8pp toward R · 2008: -13.4pp · 2024: -42.2pp
- All cycles
- 2024: R+42.2 2020: R+40.4 2016: R+42.0 2012: R+24.2 2008: R+13.4
Not yet ingested
- Civics
- —
Market trends
- HPI YoY
- ▲ 2.78%
- Current HPI
- 266.2633
- Rent YoY
- —
- Metro
- Pahrump, NV
- State GDP YoY
- ▲ 3.08%
- F500 in state
- 6
Industry mix (Fortune 500 HQ in NV)
| Industry | F500 HQs | Revenue |
|---|---|---|
| Hotels / Casinos | 3 | $36B |
|
||
Price history
-22.7% since first listed9 events — show timeline
- 2026-06-04 Price Changed $375,000 GLVAR
- 2026-05-19 Listing Removed — GLVAR
- 2026-05-19 Listed $425,000 GLVAR
- 2026-05-13 Price Changed $425,000 GLVAR
- 2026-04-25 Price Changed $465,000 GLVAR
- 2026-04-17 Listed $500,000 GLVAR
- 2026-04-14 Coming Soon — GLVAR
- 2025-02-05 Listing Removed — GLVAR
- 2025-01-19 Listed $485,000 GLVAR
Property tax history
-1.3%/yrLatest (2025): $1,580 · +3.3% YoY. Source: county tax records.
Cash-flow waterfall
monthlySold comps — $/sqft
last 12 mo · ≤1 miLoading sold comps…