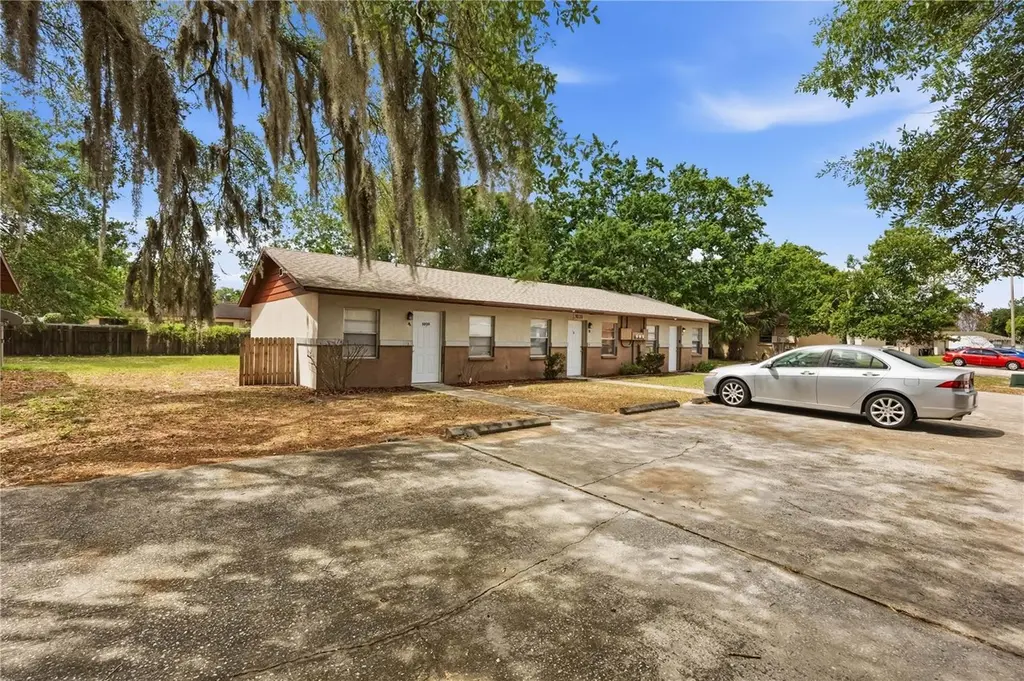
 Triplex
3020 Allred Dr · Auburndale, FL
Flood risk 1/10 · Minimal
- FEMA flood zone
- X (unshaded)
- Chance of flooding over 30 yrs
- 0.0%
- Est. flood insurance / yr
- $507 – $1,088
Fire risk 5/10 · Moderate
- Est. fire insurance / yr
- $947 – $1,759
Heat risk 8/10 · Major
- Hot days now (above 107°F)
- 7 days/yr
- Hot days in 30 yrs
- 24 days/yr
Wind risk 9/10 · Severe
- Chance of severe wind over 30 yrs
- 99.0%
Air-quality risk 2/10 · Minimal
- Unhealthy air days now
- 0 days/yr
- Unhealthy air days in 30 yrs
- 1 days/yr
Risk factors via First Street. Map © Google.
Why this score? — see what drove the B grade
The composite is a weighted blend of 9 inputs, each scored 0–100. Each bar is that input's sub-score; the figure is the points it added to the 100-point composite (weight × sub-score).
- Cash flow +30.0/30.0
- 1% rule +10.0/10.0
- DSCR +10.0/10.0
- ARV discount +7.5/15.0
- Livability +4.2/5.0
- Schools +3.5/10.0
- Rent growth +3.3/5.0
- Condition / age +2.2/5.0
- Appreciation +0.0/10.0
$339,000
🖨 Deal sheet (PDF) 📄 Offer letter ✓ Due diligence
Multi-family units
County records classify this as Multi-Family (2-4 Unit). Listing-text estimate: 3 units. confirmed
Listing remarks MLS
Two adjacent Triplexes available for $109,000 each (3018 Allred, also). Buy one or both. All buyers must provide proof of lender approval prior to any showing. Tennants pay all utilities. No pets.
Key facts
- 8,385 sq ft lot
- Built 1981
- Listed 28 days
Property features AI
Finance
- Other: Property listed as residential income; total living area reported as 1,792 square feet
- Financial info: Annual net income reported: $5,556; Pro forma rents: Unit A $750, Unit B $920, Unit C $795
- HOA & community: No association (no HOA)
Exterior
- Utilities: Public water with multiple meters; Public sewer; Electricity connected; Cable connected; Water connected; Sewer connected
- Home design: Residential income property (Triplex); Single building containing all units; Entry level and facing direction not specified
- Construction: Shingle roof; Other construction materials; Slab foundation; Built on a 0.19-acre lot
- Exterior features: Other exterior features; Paved road access; Street lights in the neighborhood
Interior
- Kitchen: Pro forma rents list kitchen included in each 1-bedroom unit
- Bedrooms: Three total bedrooms across the property; Each unit is a 1-bedroom (Units A, B and C)
- Bathrooms: Each unit includes one bathroom
- Heating & cooling: Central heating; Central air conditioning
- Interior features: Other interior features
- Laundry & utility: Laundry features: Other
Neighborhood map
What this means for you Summary
Snapshot
- This is a 3 × 3-bed/3.0-bath units multifamily listed at $339k. Condition is rated fair.
Deal economics
- At list price, monthly cash flow is $2k ($22k/yr) — positive. Per door: $603/mo.
- The deal already cash-flows at list — no discount required.
- Meets the 1% rule at list price ($5k rent vs $339k).
- Recommended offer: $334k (1.5% below list) — sets the bar for market timing.
Location & tenants
- Location reads 83/100 on livability (#48 in FL, #905 nationally) — a professional / high-income tenant draw. Strengths: cost of living A+, housing A+, health & safety A+; Watch: amenities C-, commute C-.
- Polk (suburban): math 39% / reading 43% proficiency, ranked #62 of 73 in FL (top 85%) — families likely to look elsewhere, expect single-tenant / working-renter base with shorter leases.
- Zoned schools: Lena Vista Elementary School (math 40% / reading 40%, grade F, #1,491 of 2,144 statewide, top 70%, 975 students, 56% FRL); Jere L. Stambaugh Middle (math 23% / reading 26%, grade F, #522 of 571 statewide, top 93%, 1,127 students, 65% FRL); Tenoroc High School (math 12% / reading 25%, grade F, #568 of 667 statewide, top 85%, 1,127 students, 63% FRL) — zoned schools at 61% FRL track the district average.
- Zoned-school proficiency averages 28% at this address vs 41% district-wide (-13 pts) — the specific schools serving this property underperform the Polk average; the district grade overstates school quality for this exact location.
- Market conditions: Rents rising (+3.2%/yr); 476 active listings in the ZIP; 10,384 units permitted in Polk County in 2024 (1,716 in 5+ unit buildings).
- At $5,257/mo this rent would consume 88% of the median local household income ($71k/yr) (locally 821% of renters already pay >50% of income on rent) — very limited rent-growth headroom before tenants either downsize or default.
Forward outlook
- Local home prices are declining (-3.0%/yr); year-one equity from $2k of loan paydown is wiped out by about $10k of value loss. Plan a longer hold.
- Polk County population projected at +33% by 2050 — long-run rental-demand tailwind backs the buy-and-hold thesis.
- At projected returns (-3.0% appreciation + 3.2% rent growth), your $95k cash investment doubles in ~6 years — after that, you're playing with house money.
Negotiation context
- It's been on market 29 days — a 2% lower offer ($334k) is reasonable based on typical stale-listing flexibility.
- 4 sale attempts since 22y ago with the ask held roughly flat each time — persistent listings suggest the price (not the market) is what's stuck; bring a comps-based counter.
- Current owner paid $100k; list at $339k implies a 239% gain — meaningful room to come down on a strong offer.
Risks & watch-outs
- Climate carrying-cost: severe wind risk, 99% chance of damaging wind over 30y; moderate wildfire risk; extreme-heat days projected 7→24/yr by 2055 (HVAC capex compounding) — expect insurance premiums to compound above CPI over the hold.
Questions for the listing agent
- Can we see the unit-by-unit rent roll, current vacancy, and any below-market leases? What's the average tenancy length?
- What capital expenditures (roof, boiler, parking lot, exteriors) have been made in the last 5 years, and what's planned in the next 2?
- Have any recent inspections been done? Can we get a copy of the seller's disclosures and any deferred-maintenance estimates?
- Is there a deadline driving the sale (1031 exchange, divorce, estate, relocation)? That informs how much negotiation room exists.
- What's the average days-on-market for RENTAL listings here right now (not sales)? A rising rental-DOM trend means longer vacancies and softer asking-rent achievability than the comps imply.
- What's the recent tenant-quality profile in this submarket — average credit score on applications, eviction rate, late-payment / NSF rate, and stable-employment percentage? A property-management company in the area should have these aggregated.
- How much new apartment / multifamily construction is in the pipeline within 1–3 miles? Heavy new supply (>2% of stock underway) typically softens rents 12–24 months out; light construction supports rent growth.
Investment metrics
- 1% rule
- 1.55% ✓
- Cap rate
- 12.70%
- Cash-on-cash
- 22.89%
- DSCR
- 2.02
- GRM
- 5.4
CMA / ARV
No comps found within radius.
Projected returns pro-forma
-3.0% appreciation · 3.18% rent growth · sell at horizon
- IRR
- 16.0%
- Equity multiple
- 1.65×
- Total profit
- $61,398
- Equity at exit
- $50,546
- IRR
- 24.8%
- Equity multiple
- 3.17×
- Total profit
- $206,179
- Equity at exit
- $29,311
Cash invested: $94,920 (down + closing). Projections, not guarantees.
Landlord ↔ Tenant lean methodology
- Overall (STATE)
- 87 Strongly Landlord-Friendly
- State Florida
- 87 Strongly Landlord-Friendly · R+3
- County
- — inherits STATE
- City
- — inherits STATE
ZIP-level market 33823
- Home prices YoY
- -24.5%
- Rents YoY
- 3.2%
- Active inventory
- 476
- Price-to-rent
- 16.1×
Monthly cashflow live
- Estimated rent
- $5,257 medium interval (Pro) →
- Mortgage (P&I)
- −$1,778
- Tax est. 1.5%
- −$424 /mo · $5,085/yr
- Insurance
- −$141
- HOA
- −$0
- Vacancy / Maint / Mgmt
- −$1,104
- Net cashflow
- $1,810
Break-even live
Sensitivity live
| Price | -10% $2,045 | -5% $1,927 | +0% $1,810 | +5% $1,693 | +10% $1,576 |
|---|---|---|---|---|---|
| Rent | -10% $1,395 | -5% $1,603 | +0% $1,810 | +5% $2,018 | +10% $2,226 |
| Rate | -1.0pp $1,981 | -0.5pp $1,896 | base $1,810 | +0.5pp $1,722 | +1.0pp $1,633 |
3-unit breakdown (identical units grouped — click to expand)
| Units | Beds | Baths | Est. rent |
|---|---|---|---|
| 3× units | 3 | 3 | $5,256 |
| #1 | 3 | 3 | $1,752 |
| #2 | 3 | 3 | $1,752 |
| #3 | 3 | 3 | $1,752 |
| Total (3 units) | $5,257 | ||
UW: 25.0% down · 7.5% · 30yr · 1.5% tax · 5.0% vac · 8.0% maint · 8.0% mgmt
Financing live
Cash to close
- Down payment
- $84,750
- Closing costs
- $10,170
- Reserves months
- —
- Total cash needed
- —
Loan-product check · same deal, 3 products live
Conventional
25% down · 7.5% · 30yr
- Down + closing
- —
- Monthly P&I
- —
- Monthly cashflow
- —
- DSCR
- —
- Eligible?
- —
Personal DTI + credit; lowest rate.
DSCR
20% down · 8.5% · 30yr
- Down + closing
- —
- Monthly P&I
- —
- Monthly cashflow
- —
- DSCR
- —
- Eligible?
- —
No personal income docs; deal must DSCR.
Hard money
10% down · 12.0% · 12mo
- Down + closing
- —
- Monthly P&I
- —
- Monthly cashflow
- —
- DSCR
- —
- Eligible?
- —
Short-term bridge; refi at stabilization.
Listing history 10 events
-
2026-06-03days on market $339,000 Active 29 DOM
-
2026-06-03days on market $339,000 Active 28 DOM
-
2026-06-01days on market $339,000 Active 27 DOM
-
2026-05-31days on market $339,000 Active 26 DOM
-
2026-05-13status Active
-
2026-05-08status Pending
-
2026-04-30$339,000 Active
-
2005-12-01$1,250,000
-
2005-03-08soldstatus $100,000 196-char remark
Show marketing remark (196 chars)
Two adjacent Triplexes available for $109,000 each (3018 Allred, also). Buy one or both. All buyers must provide proof of lender approval prior to any showing. Tennants pay all utilities. No pets.
-
2004-05-27$109,000 196-char remark
Show marketing remark (196 chars)
Two adjacent Triplexes available for $109,000 each (3018 Allred, also). Buy one or both. All buyers must provide proof of lender approval prior to any showing. Tennants pay all utilities. No pets.
ⓘ Source: listings_history table (triggers on properties + properties_extension) + one-shot
backfill from property_details.listing_events for pre-trigger history.
Climate risk First Street
- Flood 1/10 Low FEMA zone X (unshaded) · 0% chance over 30 yrs
- Wildfire 5/10 Major
- Heat 8/10 Severe 7 d/yr ≥107°F today · 24 d/yr by 30 yrs out
- Wind 9/10 Extreme 99% chance of damaging wind over 30 yrs
- Air quality 2/10 Low 0 unhealthy d/yr today · 1 by 30 yrs out
Nearby sold comps map
Loading sold comps map…
Walkable amenities ~0.75 mi
Loading nearby amenities…
Taxation est. · year 1
- Rental income
- $63,084
- − Mortgage interest
- −$18,989
- − Property taxes
- −$5,085
- − Insurance
- −$1,695
- − Repairs & maintenance
- −$5,047
- − Management
- −$5,047
- − Depreciation
- −$9,862
- Taxable income
- $17,359
- Est. tax owed @ 24.0%
- −$4,166
- After-tax cash flow
- $17,557/yr
For passive investors: Depreciation is non-cash, so a rental often shows a tax loss while cash-flowing — sheltering income. Rental losses are passive: they offset passive income freely, and up to $25,000/yr can offset ordinary (W-2) income if you actively participate and your MAGI is under $100k (phasing out to $0 by $150k); unused losses carry forward. On sale, claimed depreciation is recaptured at up to 25%, and gains may owe capital-gains tax (a 1031 exchange can defer both). Figures are a year-1 estimate at your 24.0% rate — not tax advice; consult a CPA.
Condition & rehab AI · 11 photos
This triplex requires moderate renovations to improve its condition and increase its value. Focus on updating the kitchen and bathrooms, and enhancing the landscaping to attract tenants and increase rental income.
Repairs flagged
- Major kitchen cabinets — outdated and cluttered
- Major bathroom fixtures — dated and worn
- Moderate landscaping — needs trimming and mulching
Value-add opportunities
- Both kitchen renovation — modernizing the kitchen would improve both resale and rental value
- Both bathroom updates — updating bathrooms would enhance both resale and rental appeal
- Rental landscaping — improved landscaping would attract tenants and increase rental income
Renovation cost estimate screening
| Repair item | Severity | Est. cost |
|---|---|---|
| kitchen cabinets · outdated and cluttered | Major | $15,000–50,000 |
| bathroom fixtures · dated and worn | Major | $15,000–50,000 |
| landscaping · needs trimming and mulching | Moderate | $3,000–15,000 |
| Total estimated repair cost · 3 items | $33,000–115,000 |
Value-add ROI direction
- Both kitchen renovation — modernizing the kitchen would improve both resale and rental value ↑
- Both bathroom updates — updating bathrooms would enhance both resale and rental appeal ↑
- Rental landscaping — improved landscaping would attract tenants and increase rental income ↑
ⓘ Cost ranges are severity-bucket heuristics (US national rule-of-thumb). Get contractor quotes + a written scope before underwriting a rehab budget.
Schools (NCES district)
- District
- Polk
- NCES district ID
- 1201590
- Math proficiency
- 39% ▼ -11.00%
- Reading proficiency
- 43% ▼ -4.00%
- Median HH income
- $43,979
- Composite
- 34.74/100
- National rank
- #5132
- State rank
- #62 of 73 in FL
Livability — Auburndale
- Score
- 83/100
- State rank
- #48
- US rank
- #905
Category grades
Schools grade is shown separately in the Schools card above.
Census & demographics
- Census place
- Auburndale, FL
- County
- Polk County · 740,051 people
- City population
- 41,779
- Metro
- Lakeland-Winter Haven, FL
- Population (ZIP)
- 41,779
- Household income
- $71,485
- Rent vs Own
- Severe rent burden
- 821.0
Population outlook (Polk County) Hauer SSP2
- Today (2025)
- 752,975 people
- By 2030
- 804,621 · +6.9%
- By 2040
- 906,117 · +20.3%
- By 2050
- 1,000,476 · +32.9%
- By 2075
- 1,197,520 · +59.0%
- By 2100
- 1,271,518 · +68.9%
Race, ethnicity, and origin ACS 2023
- Neighborhood character
- Predominantly White (65%)
- Race & ethnicity
- White 65% Hispanic / Latino 19% Black 13% Two or more races 6% Asian 2%
- Hispanic origin (detail)
- Mexican 7% Puerto Rican 7% Cuban 1%
- Common ancestry
- Hispanic 3% Lithuanian 2% Romanian 1%
- Foreign-born
- 10% · Canada, Jamaica, Philippines
- Languages at home
- 79% English-only · Spanish 15% French/Haitian/Cajun 3% Other Indo-European 2%
Political lean MEDSL · Polk
- 2024 margin
- Strong R (+20.7) · D 39.2% · R 59.9%
- 2008→2024 swing
- -14.6pp toward R · 2008: -6.1pp · 2024: -20.7pp
- All cycles
- 2024: R+20.7 2020: R+14.4 2016: R+14.1 2012: R+6.8 2008: R+6.1
Not yet ingested
- Civics
- —
Market trends
- HPI YoY
- ▼ -102.70%
- Current HPI
- 316.9436
- Rent YoY
- ▲ 3.18%
- Metro
- Lakeland-Winter Haven, FL
- State GDP YoY
- ▲ 3.28%
- F500 in state
- 36
Industry mix (Fortune 500 HQ in FL)
| Industry | F500 HQs | Revenue |
|---|---|---|
| Industrial Technology | 2 | $29B |
|
||
| Insurance | 2 | $17B |
|
||
| Retail | 1 | $60B |
|
||
| Technology Distribution | 1 | $58B |
|
||
| Homebuilding | 1 | $35B |
|
||
| Technology Manufacturing | 1 | $35B |
|
||
Price history
+211.0% since first listed6 events — show timeline
- 2026-05-13 Relisted — Stellar MLS as Distributed by MLS Grid
- 2026-05-08 Pending — Stellar MLS as Distributed by MLS Grid
- 2026-04-30 Listed $339,000 Stellar MLS as Distributed by MLS Grid
- 2005-12-01 Listed $1,250,000 Stellar MLS as Distributed by MLS Grid
- 2005-03-08 Sold (MLS) $100,000 Stellar MLS as Distributed by MLS Grid
- 2004-05-27 Listed $109,000 Stellar MLS as Distributed by MLS Grid
Cash-flow waterfall
monthlySold comps — $/sqft
last 12 mo · ≤1 miLoading sold comps…