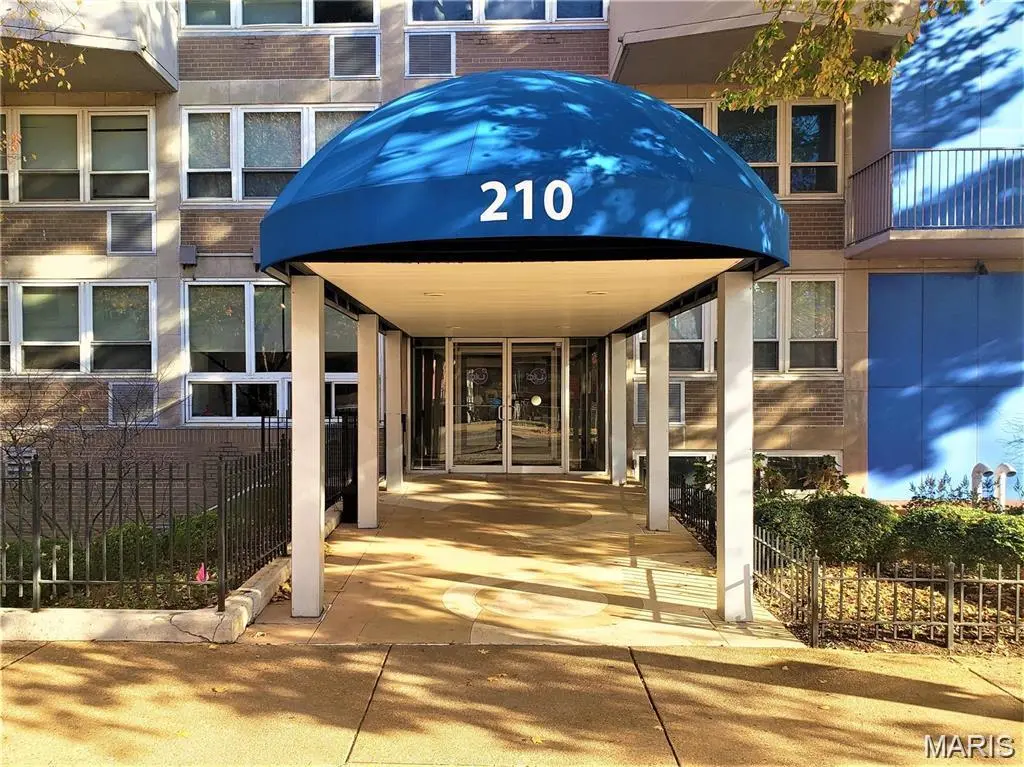
210 N 17th St #805 · St. Louis, MO
Flood risk 1/10 · Minimal
- FEMA flood zone
- X (unshaded)
- Chance of flooding over 30 yrs
- 0.0%
- Est. flood insurance / yr
- $507 – $1,088
Fire risk 1/10 · Minimal
- Est. fire insurance / yr
- $1,054 – $1,958
Heat risk 5/10 · Moderate
- Hot days now (above 109°F)
- 7 days/yr
- Hot days in 30 yrs
- 20 days/yr
Wind risk 2/10 · Minimal
- Chance of severe wind over 30 yrs
- 1.0%
Air-quality risk 3/10 · Minor
- Unhealthy air days now
- 3 days/yr
- Unhealthy air days in 30 yrs
- 4 days/yr
Risk factors via First Street. Map © Google.
Why this score? — see what drove the C- grade
The composite is a weighted blend of 9 inputs, each scored 0–100. Each bar is that input's sub-score; the figure is the points it added to the 100-point composite (weight × sub-score).
- Cash flow +13.0/30.0
- 1% rule +10.0/10.0
- ARV discount +7.5/15.0
- Appreciation +5.3/10.0
- Rent growth +4.8/5.0
- DSCR +3.9/10.0
- Livability +2.5/5.0
- Condition / age +2.5/5.0
- Schools +1.2/10.0
$63,895
🖨 Deal sheet 📄 Offer letter ✓ Due diligence
Listing remarks MLS
Investment Opportunity in Secure Downtown Apartment with 8th Floor View! This 1bd, 1bth apartment is 600+sqft with eat-in kitchen, gas range and granite countertops. The carpet and paint have been updated. There's a security door entrance with 24 hour front desk attendant, an exercise room, on-site laundry, a common area/rec room and gated designated parking. This unit is currently tenant occupied at $1050/month.
Key facts
- 8th floor view
- Eat-in kitchen
- Granite countertops
Tags
Neighborhood map
What this means for you Summary
Snapshot
- This is a 1-bed/1.0-bath condo listed at $64k.
Deal economics
- At list price, monthly cash flow is $-3 ($-35/yr) — negative.
- To cash-flow at today's rent, offer at most $63k (0.7% below list).
- Meets the 1% rule at list price ($1k rent vs $64k).
- Recommended offer: $56k (12.0% below list) — sets the bar for market timing.
- Cap rate 6.2% vs local median 5.0% in St. Louis — meaningfully above typical; check what's discounted (condition, days-on-market, listing class) to confirm the premium yield is real.
Location & tenants
- Location reads: area grade C — affects rentability + tenant quality, not the cash-flow math above.
- St. Louis City (urban): math 10% / reading 18% proficiency, ranked #312 of 324 in MO (top 96%) — low school quality limits family demand, transient renter base, plan for 1-2y turnover; 80% free/reduced lunch — lower-income household profile, screen leases tightly.
- Market conditions: Rents rising fast (+9.2%/yr); 70 active listings in the ZIP; 40 comparable units currently listed for rent nearby; rentals leasing fast (median 8d on market — plan ~1-2 weeks tenant-placement turnaround); lower-income renter base — watch delinquency; 294 units permitted in St. Louis city in 2024 (227 in 5+ unit buildings).
- This rent runs 34% of the median local income ($41k/yr) — at the standard rent-burdened threshold; future hikes will face affordability resistance.
Forward outlook
- In year one you build about $867 of equity ($442 loan paydown + $425 appreciation (0.7% local appreciation)).
- St. Louis County population projected to shrink 6% by 2050 — rents likely to lag national; underwrite the cash flow, not the appreciation.
- At projected returns (0.7% appreciation + 8.0% rent growth), your $18k cash investment doubles in ~7 years — after that, you're playing with house money.
Negotiation context
- It's been on market 128 days — a 12% lower offer ($56k) is reasonable based on typical stale-listing flexibility.
- 3 sale attempts with the ask held roughly flat each time — persistent listings suggest the price (not the market) is what's stuck; bring a comps-based counter.
Risks & watch-outs
- Watch-outs: HOA is 42% of rent; built in 1959 — expect roof / HVAC / electrical / plumbing capex.
- Climate carrying-cost: extreme-heat days projected 7→20/yr by 2055 (HVAC capex compounding) — expect insurance premiums to compound above CPI over the hold.
Questions for the listing agent
- What do current leases actually rent for vs. the listed asking? Can we see a recent rent roll and the last 12 months of T-12 income?
- It's been on market 128 days. Have you received any prior offers? Is the seller open to a 12% concession, seller financing, or rate buy-down credit?
- Built in 1959 — when were the roof, HVAC, electrical panel, plumbing, and water heater last replaced?
- What does the HOA fee cover, when was the last increase, and are there any pending special assessments or reserve-fund shortfalls?
- Any open or pending special assessments — roof, HVAC, plumbing, elevator, façade? What's the per-unit balance and payoff schedule, and is the seller paying it off at close or rolling it to the buyer?
- Why hasn't it sold? Are there any deal-killer items the seller is aware of (foundation, flood, title, zoning, code violations)?
- Is there a deadline driving the sale (1031 exchange, divorce, estate, relocation)? That informs how much negotiation room exists.
- What's the average days-on-market for RENTAL listings here right now (not sales)? A rising rental-DOM trend means longer vacancies and softer asking-rent achievability than the comps imply.
- What's the recent tenant-quality profile in this submarket — average credit score on applications, eviction rate, late-payment / NSF rate, and stable-employment percentage? A property-management company in the area should have these aggregated.
- How much new apartment / multifamily construction is in the pipeline within 1–3 miles? Heavy new supply (>2% of stock underway) typically softens rents 12–24 months out; light construction supports rent growth.
Investment metrics
- 1% rule
- 1.84% ✓
- Cap rate
- 6.24%
- Cash-on-cash
- -0.20%
- DSCR
- 0.99
- GRM
- 4.5
CMA / ARV
No comps found within radius.
Projected returns pro-forma
0.66% appreciation · 8.0% rent growth · sell at horizon
- IRR
- 6.8%
- Equity multiple
- 1.36×
- Total profit
- $6,483
- Equity at exit
- $20,704
- IRR
- 17.0%
- Equity multiple
- 3.55×
- Total profit
- $45,643
- Equity at exit
- $26,676
Cash invested: $17,891 (down + closing). Projections, not guarantees.
Landlord ↔ Tenant lean methodology
- Overall (STATE)
- 81 Strongly Landlord-Friendly
- State Missouri
- 81 Strongly Landlord-Friendly · R+10
- County
- — inherits STATE
- City
- — inherits STATE
ZIP-level market 63103
- Home prices YoY
- 0.6%
- Rents YoY
- 9.2%
- Active inventory
- 70
- Price-to-rent
- 4.5×
Monthly cashflow live
- Estimated rent
- $1,173 high interval (Pro) →
- Mortgage (P&I)
- −$335
- Tax est. 1.5%
- −$80 /mo · $958/yr
- Insurance
- −$27
- HOA
- −$488
- Vacancy / Maint / Mgmt
- −$246
- Net cashflow
- $-3
Break-even live
UW: 25.0% down · 7.5% · 30yr · 1.5% tax · 5.0% vac · 8.0% maint · 8.0% mgmt
Financing live
Cash to close
- Down payment
- $15,974
- Closing costs
- $1,917
- Reserves months
- —
- Total cash needed
- —
Loan-product check · same deal, 3 products live
Conventional
25% down · 7.5% · 30yr
- Down + closing
- —
- Monthly P&I
- —
- Monthly cashflow
- —
- DSCR
- —
- Eligible?
- —
Personal DTI + credit; lowest rate.
DSCR
20% down · 8.5% · 30yr
- Down + closing
- —
- Monthly P&I
- —
- Monthly cashflow
- —
- DSCR
- —
- Eligible?
- —
No personal income docs; deal must DSCR.
Hard money
10% down · 12.0% · 12mo
- Down + closing
- —
- Monthly P&I
- —
- Monthly cashflow
- —
- DSCR
- —
- Eligible?
- —
Short-term bridge; refi at stabilization.
Rent comps 40 comps
| Address | Beds | Baths | Sqft | Rent | $/sqft | DOM | Units | Dist |
|---|---|---|---|---|---|---|---|---|
| 210 N 17th St Saint Louis, MO | 1.0 | 1.0 | 648 | $950 | $1.47 | 43d | 1 | 0.05mi |
| 210 N 17th St Saint Louis, MO | — | 1.0 | 427 | $800 | $1.87 | 14d | 1 | 0.05mi |
| 110 N 17th St Saint Louis, MO | 2.0 | 1.0 | 653 | $805 | $1.23 | 7d | 1 | 0.07mi |
| 1717 Olive St Saint Louis, MO | 2.0 | 1.0–2.0 | 957 | $2,200 | $2.30 | 1d | 64 | 0.08mi |
| 1815 Locust St Saint Louis, MO | 1.0–2.0 | 1.0–2.0 | 983 | $1,235 | $1.26 | 43d | 7 | 0.17mi |
| 1531 Washington Ave St. Louis, MO | 1.0–2.0 | 1.0 | 656 | $1,020 | $1.55 | 1d | 5 | 0.20mi |
| 1900 Washington Ave Saint Louis, MO | 1.0–2.0 | 1.0–2.0 | 960 | $1,295 | $1.35 | 2d | 12 | 0.24mi |
| 300 N Tucker Blvd St. Louis, MO | 1.0–2.0 | 1.0–2.0 | 1013 | $1,200 | $1.18 | 1d | 10 | 0.39mi |
| 1300 Convention Plz Saint Louis, MO | 2.0 | 1.0 | 877 | $1,188 | $1.35 | 43d | 1 | 0.39mi |
| 2200 Locust St Saint Louis, MO | 1.0–2.0 | 1.0–1.5 | 862 | $1,395 | $1.62 | 3d | 6 | 0.41mi |
| 1133 Washington Ave St. Louis, MO | 2.0 | 1.0–2.0 | 637 | $1,034 | $1.62 | 43d | 1 | 0.42mi |
| 1110 Washington Ave Saint Louis, MO | 1.0–2.0 | 1.0–2.0 | 1006 | $995 | $0.99 | 2d | 19 | 0.46mi |
| 2206 Lucas Ave St. Louis, MO | 1.0–2.0 | 1.0–2.0 | 1047 | $1,250 | $1.19 | 1d | 20 | 0.46mi |
| 416 N 23rd St St. Louis, MO | 1.0–2.0 | 1.0 | 780 | $1,275 | $1.63 | 4d | 23 | 0.48mi |
| 1000 Washington Ave Saint Louis, MO | 1.0–2.0 | 1.0–2.0 | 959 | $1,200 | $1.25 | 1d | 24 | 0.51mi |
| 917 Locust St St. Louis, MO | 1.0 | 1.0 | 683 | $1,305 | $1.91 | 16d | 3 | 0.56mi |
| 1023 Spruce St St. Louis, MO | 1.0–2.0 | 1.0–2.0 | 957 | $1,075 | $1.12 | 1d | 17 | 0.59mi |
| 206 N 9th St Unit 514 St. Louis, MO | 1.0 | 1.0 | 675 | $975 | $1.44 | 43d | 1 | 0.59mi |
| 206 N 9th St Unit 811 St. Louis, MO | 1.0 | 1.0 | 633 | $895 | $1.41 | 7d | 1 | 0.59mi |
| 206 N 9th St Unit 509 St. Louis, MO | 1.0 | 1.0 | 701 | $925 | $1.32 | 43d | 1 | 0.59mi |
| 206 N 9th St Unit 502 St. Louis, MO | 1.0 | 1.0 | 626 | $895 | $1.43 | 43d | 1 | 0.59mi |
| 2605-2637 Washington Ave St. Louis, MO | 1.0–2.0 | 1.0–2.0 | 775 | $1,350 | $1.74 | 12d | 7 | 0.63mi |
| 800 Olive St Saint Louis, MO | 1.0–2.0 | 1.0–2.0 | 1063 | $998 | $0.94 | 1d | 26 | 0.63mi |
| 1115 Carr St St. Louis, MO | 1.0–2.0 | 1.0 | 747 | $975 | $1.30 | 4d | 13 | 0.65mi |
| 720 Olive St St. Louis, MO | 3.0 | 1.0–2.0 | 1778 | $2,447 | $1.38 | 1d | 15 | 0.67mi |
| 515 Olive St Saint Louis, MO | 1.0–2.0 | 1.0–2.5 | 1117 | $1,285 | $1.15 | 1d | 26 | 0.80mi |
| 614 S 7th St Unit 402 St. Louis, MO | 1.0 | 1.0 | 735 | $1,150 | $1.56 | 43d | 1 | 0.87mi |
| 1 Cardinal Way Saint Louis, MO | 1.0–2.0 | 1.0–2.0 | 905 | $1,795 | $1.98 | 1d | 23 | 0.87mi |
| 1204 N 8th St St. Louis, MO | 1.0–3.0 | 1.0 | 740 | $676 | $0.91 | 1d | 19 | 0.87mi |
| 300 S Broadway Apt 404 St. Louis, MO | — | 1.0 | 501 | $1,350 | $2.69 | 43d | 1 | 0.90mi |
| 300 S Broadway St. Louis, MO | 1.0 | 1.0 | 710 | $1,985 | $2.79 | 20d | 10 | 0.92mi |
| 400 N 4th St Saint Louis, MO | 2.0 | 1.0–2.0 | 1162 | $1,997 | $1.72 | 1d | 1 | 0.96mi |
| 1901 Park Ave Unit 2F St. Louis, MO | 1.0 | 1.0 | 725 | $1,395 | $1.92 | 43d | 1 | 1.04mi |
| 618 N 2nd St Unit 405 St. Louis, MO | 1.0 | 1.0 | 744 | $1,266 | $1.70 | 14d | 1 | 1.06mi |
| 618 N 2nd St Saint Louis, MO | 1.0 | 1.0 | 791 | $1,545 | $1.95 | 19d | 4 | 1.07mi |
| 700 N 2nd St Saint Louis, MO | 1.0 | 1.0 | 654 | $1,378 | $2.10 | 19d | 5 | 1.08mi |
| 701 N 1st St St. Louis, MO | 1.0–2.0 | 1.0 | 894 | $1,485 | $1.66 | 1d | 8 | 1.11mi |
| 3307 Olive St St. Louis, MO | 1.0–2.0 | 1.0 | 912 | $855 | $0.94 | 43d | 1 | 1.29mi |
| 2729 Park Ave Unit 1321-D St. Louis, MO | 1.0 | 1.0 | 660 | $850 | $1.29 | 43d | 1 | 1.31mi |
| 1515 S 7th St St. Louis, MO | 2.0 | 1.0–2.0 | 791 | $2,350 | $2.97 | 1d | 1 | 1.35mi |
HOA detail condo
- Monthly dues
- $488 · $5,856/yr
- Likely covers
- gassecurity
- Assessments
- None detected in remarks — confirm with the listing agent.
Listing history 6 events
-
2026-05-31days on market $63,895 Active 128 DOM
-
2026-04-28price $63,895 419-char remark
Show marketing remark (419 chars)
Investment Opportunity in Secure Downtown Apartment with 8th Floor View! This 1bd, 1bth apartment is 600+sqft with eat-in kitchen, gas range and granite countertops. The carpet and paint have been updated. There's a security door entrance with 24 hour front desk attendant, an exercise room, on-site laundry, a common area/rec room and gated designated parking. This unit is currently tenant occupied at $1050/month.
-
2026-03-11status Active 419-char remark
Show marketing remark (419 chars)
Investment Opportunity in Secure Downtown Apartment with 8th Floor View! This 1bd, 1bth apartment is 600+sqft with eat-in kitchen, gas range and granite countertops. The carpet and paint have been updated. There's a security door entrance with 24 hour front desk attendant, an exercise room, on-site laundry, a common area/rec room and gated designated parking. This unit is currently tenant occupied at $1050/month.
-
2026-01-12$63,900 Active 419-char remark
Show marketing remark (419 chars)
Investment Opportunity in Secure Downtown Apartment with 8th Floor View! This 1bd, 1bth apartment is 600+sqft with eat-in kitchen, gas range and granite countertops. The carpet and paint have been updated. There's a security door entrance with 24 hour front desk attendant, an exercise room, on-site laundry, a common area/rec room and gated designated parking. This unit is currently tenant occupied at $1050/month.
-
2025-10-08$64,900 Active
-
2025-10-03historical
ⓘ Source: listings_history table (triggers on properties + properties_extension) + one-shot
backfill from property_details.listing_events for pre-trigger history.
Climate risk First Street
- Flood 1/10 Low FEMA zone X (unshaded) · 0% chance over 30 yrs
- Wildfire 1/10 Low
- Heat 5/10 Major 7 d/yr ≥109°F today · 20 d/yr by 30 yrs out
- Wind 2/10 Low 100% chance of damaging wind over 30 yrs
- Air quality 3/10 Moderate 3 unhealthy d/yr today · 4 by 30 yrs out
Nearby sold comps map
Loading sold comps map…
Walkable amenities ~0.75 mi
Loading nearby amenities…
Taxation est. · year 1
- Rental income
- $14,076
- − Mortgage interest
- −$3,579
- − Property taxes
- −$958
- − Insurance
- −$319
- − Repairs & maintenance
- −$1,126
- − Management
- −$1,126
- − HOA
- −$5,856
- − Depreciation
- −$1,859
- Taxable loss
- −$748
- Est. tax savings @ 24.0%
- +$180
- After-tax cash flow
- $144/yr
For passive investors: Depreciation is non-cash, so a rental often shows a tax loss while cash-flowing — sheltering income. Rental losses are passive: they offset passive income freely, and up to $25,000/yr can offset ordinary (W-2) income if you actively participate and your MAGI is under $100k (phasing out to $0 by $150k); unused losses carry forward. On sale, claimed depreciation is recaptured at up to 25%, and gains may owe capital-gains tax (a 1031 exchange can defer both). Figures are a year-1 estimate at your 24.0% rate — not tax advice; consult a CPA.
Schools (NCES district)
- District
- St. Louis City
- NCES district ID
- 2929280
- Math proficiency
- 10% ▼ -6.00%
- Reading proficiency
- 18% ▼ -3.00%
- Median HH income
- $35,685
- Composite
- 11.54/100
- National rank
- #9699
- State rank
- #312 of 324 in MO
Livability — St. Louis
No livability data for this city. (Only ~50 U.S. cities are tracked.)
Census & demographics
- Census place
- St. Louis, MO
- County
- Saint Louis City · 254,015 people
- City population
- 283,259
- Metro
- St. Louis, MO-IL
- Population (ZIP)
- 8,778
- Household income
- $40,943
- Rent vs Own
- Severe rent burden
- 960.0
Population outlook (St. Louis County) Hauer SSP2
- Today (2025)
- 315,737 people
- By 2030
- 313,865 · -0.6%
- By 2040
- 305,439 · -3.3%
- By 2050
- 296,529 · -6.1%
- By 2075
- 271,028 · -14.2%
- By 2100
- 255,359 · -19.1%
Race, ethnicity, and origin ACS 2023
- Neighborhood character
- Diverse neighborhood (Simpson 0.65)
- Race & ethnicity
- White 43% Black 40% Asian 8% Two or more races 6% Hispanic / Latino 3%
- Common ancestry
- Romanian 3% Lithuanian 2% Italian 2%
- Foreign-born
- 8% · Canada, China
- Languages at home
- 87% English-only · Other Indo-European 4% Spanish 3% Arabic 1%
Political lean MEDSL · St. Louis
- 2024 margin
- Solid D (+64.7) · D 81.4% · R 16.7% · Other 2.0%
- 2008→2024 swing
- -3.5pp toward R · 2008: 68.2pp · 2024: 64.7pp
- All cycles
- 2024: D+64.7 2020: D+66.2 2016: D+63.7 2012: D+66.6 2008: D+68.2
Not yet ingested
- Civics
- —
Market trends
- HPI YoY
- ▲ 0.66%
- Current HPI
- 116.4477
- Rent YoY
- ▲ 9.20%
- Metro
- St. Louis, MO-IL
- State GDP YoY
- ▲ 1.84%
- F500 in state
- 20
Industry mix (Fortune 500 HQ in MO)
| Industry | F500 HQs | Revenue |
|---|---|---|
| Healthcare | 1 | $163B |
|
||
| Insurance | 1 | $21B |
|
||
| Industrial Technology | 1 | $17B |
|
||
| Retail | 1 | $16B |
|
||
| Industrial Distribution | 1 | $10B |
|
||
| Utilities | 1 | $9B |
|
||
Price history
-1.5% since first listed5 events — show timeline
- 2026-04-28 Price Changed $63,895 MARIS as Distributed by MLS Grid
- 2026-03-11 Relisted — MARIS as Distributed by MLS Grid
- 2026-01-12 Listed $63,900 MARIS as Distributed by MLS Grid
- 2025-10-08 Listed $64,900 MARIS as Distributed by MLS Grid
- 2025-10-03 Coming Soon — MARIS as Distributed by MLS Grid
Cash-flow waterfall
monthlySold comps — $/sqft
last 12 mo · ≤1 miLoading sold comps…