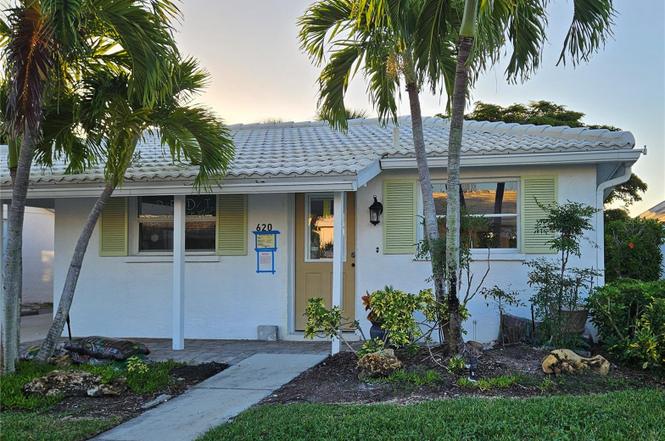
620 Spanish Dr N · Longboat Key, FL
Flood risk 10/10 · Severe
- FEMA flood zone
- AE
- Chance of flooding over 30 yrs
- 0.99%
- Est. flood insurance / yr
- $1,737 – $8,500
Fire risk 1/10 · Minimal
- Est. fire insurance / yr
- $947 – $1,759
Heat risk 10/10 · Severe
- Hot days now (above 106°F)
- 7 days/yr
- Hot days in 30 yrs
- 29 days/yr
Wind risk 10/10 · Severe
- Chance of severe wind over 30 yrs
- 99.0%
Air-quality risk 3/10 · Minor
- Unhealthy air days now
- 2 days/yr
- Unhealthy air days in 30 yrs
- 2 days/yr
Risk factors via First Street. Map © Google.
Why this score? — see what drove the B grade
The composite is a weighted blend of 9 inputs, each scored 0–100. Each bar is that input's sub-score; the figure is the points it added to the 100-point composite (weight × sub-score).
- Cash flow +28.6/30.0
- 1% rule +10.0/10.0
- DSCR +10.0/10.0
- ARV discount +7.5/15.0
- Appreciation +5.4/10.0
- Schools +4.4/10.0
- Livability +3.2/5.0
- Rent growth +2.5/5.0
- Condition / age +2.5/5.0
$370,000
🖨 Deal sheet 📄 Offer letter ✓ Due diligence
Listing remarks MLS
Immaculate stand alone villa offers panoramic views of the lagoon. Pride of ownership throughout with custom raised cabinets, newer plumbing, electric and roof. Protected marina, beach access and all in a very active community. This is the one to call home. Dimensions approx.
Key facts
- Lake view
- Updated bathrooms
- Landscaped patio
Tags
Neighborhood map
What this means for you Summary
Snapshot
- This is a 2-bed/2.0-bath condo listed at $370k.
Deal economics
- At list price, monthly cash flow is $794 ($10k/yr) — positive.
- The deal already cash-flows at list — no discount required.
- Meets the 1% rule at list price ($6k rent vs $370k).
- Recommended offer: $326k (12.0% below list) — sets the bar for market timing.
- Cap rate 10.3% vs local median 0.5% in Longboat Key — top-decile yield for the area; either an underpriced asset or a hidden risk that comps aren't pricing in. Stress-test before assuming the spread holds.
Location & tenants
- Location reads 64/100 on livability (#693 in FL) — a middle-class / working-renter tenant base. Strengths: crime A+, employment A+; Watch: schools C-, housing C-, amenities F.
- Manatee (suburban): math 54% / reading 50% proficiency, ranked #26 of 73 in FL (top 36%) — acceptable for families but not a draw, mixed tenant base, ~2y average lease.
- Market conditions: 539 active listings in the ZIP; 16 comparable units currently listed for rent nearby; rentals at typical pace (median 24d on market — plan ~3-4 weeks tenant-placement turnaround); high-income renter base; 7,472 units permitted in Manatee County in 2024 (1,782 in 5+ unit buildings).
- At $6,217/mo this rent would consume 47% of the median local household income ($158k/yr) (locally 98% of renters already pay >50% of income on rent) — very limited rent-growth headroom before tenants either downsize or default.
Forward outlook
- In year one you build about $5k of equity ($3k loan paydown + $3k appreciation (0.7% local appreciation)).
- Manatee County population projected at +43% by 2050 — long-run rental-demand tailwind backs the buy-and-hold thesis.
- At projected returns (0.7% appreciation + 3.0% rent growth), your $104k cash investment doubles in ~6 years — after that, you're playing with house money.
- By year 6, paydown + projected appreciation supports a ~$31k cash-out refi (75% LTV) — recoverable capital for the next deal without selling this one.
Negotiation context
- It's been on market 139 days — a 12% lower offer ($326k) is reasonable based on typical stale-listing flexibility.
- 3 sale attempts since 21y ago; this cycle's ask has dropped $25k (6%) from the opening price — seller is motivated, your offer sets the floor, not the list.
Risks & watch-outs
- Watch-outs: flood insurance adds $427/mo; HOA is 22% of rent.
- Climate carrying-cost: in FEMA flood zone AE (mandatory federal flood insurance); severe wind risk, 99% chance of damaging wind over 30y; extreme-heat days projected 7→29/yr by 2055 (HVAC capex compounding) — expect insurance premiums to compound above CPI over the hold.
Questions for the listing agent
- It's been on market 139 days. Have you received any prior offers? Is the seller open to a 12% concession, seller financing, or rate buy-down credit?
- Built in 1967 — when were the roof, HVAC, electrical panel, plumbing, and water heater last replaced?
- What's the actual annual flood-insurance premium (NFIP or private), and is the property in a SFHA with mandatory coverage?
- What does the HOA fee cover, when was the last increase, and are there any pending special assessments or reserve-fund shortfalls?
- Any open or pending special assessments — roof, HVAC, plumbing, elevator, façade? What's the per-unit balance and payoff schedule, and is the seller paying it off at close or rolling it to the buyer?
- Why hasn't it sold? Are there any deal-killer items the seller is aware of (foundation, flood, title, zoning, code violations)?
- Is there a deadline driving the sale (1031 exchange, divorce, estate, relocation)? That informs how much negotiation room exists.
- What's the average days-on-market for RENTAL listings here right now (not sales)? A rising rental-DOM trend means longer vacancies and softer asking-rent achievability than the comps imply.
- What's the recent tenant-quality profile in this submarket — average credit score on applications, eviction rate, late-payment / NSF rate, and stable-employment percentage? A property-management company in the area should have these aggregated.
- How much new apartment / multifamily construction is in the pipeline within 1–3 miles? Heavy new supply (>2% of stock underway) typically softens rents 12–24 months out; light construction supports rent growth.
Investment metrics
- 1% rule
- 1.68% ✓
- Cap rate
- 10.25%
- Cash-on-cash
- 14.14%
- DSCR
- 1.63
- GRM
- 5.0
CMA / ARV
No comps found within radius.
Projected returns pro-forma
0.73% appreciation · 3.0% rent growth · sell at horizon
- IRR
- 10.3%
- Equity multiple
- 1.52×
- Total profit
- $53,658
- Equity at exit
- $121,098
- IRR
- 14.6%
- Equity multiple
- 2.73×
- Total profit
- $179,657
- Equity at exit
- $156,972
Cash invested: $103,600 (down + closing). Projections, not guarantees.
Landlord ↔ Tenant lean methodology
- Overall (STATE)
- 87 Strongly Landlord-Friendly
- State Florida
- 87 Strongly Landlord-Friendly · R+3
- County
- — inherits STATE
- City
- — inherits STATE
ZIP-level market 34228
- Home prices YoY
- 0.3%
- Active inventory
- 539
- Price-to-rent
- 5.0×
Monthly cashflow live
- Estimated rent
- $6,217 high interval (Pro) →
- Mortgage (P&I)
- −$1,940
- Tax from tax record
- −$256 /mo · $3,076/yr
- Insurance
- −$154
- Flood insurance flood zone
- −$427 /mo · $5,118/yr
- HOA
- −$1,340
- Vacancy / Maint / Mgmt
- −$1,306
- Net cashflow
- $794
Break-even live
UW: 25.0% down · 7.5% · 30yr · 1.5% tax · 5.0% vac · 8.0% maint · 8.0% mgmt
Financing live
Cash to close
- Down payment
- $92,500
- Closing costs
- $11,100
- Reserves months
- —
- Total cash needed
- —
Loan-product check · same deal, 3 products live
Conventional
25% down · 7.5% · 30yr
- Down + closing
- —
- Monthly P&I
- —
- Monthly cashflow
- —
- DSCR
- —
- Eligible?
- —
Personal DTI + credit; lowest rate.
DSCR
20% down · 8.5% · 30yr
- Down + closing
- —
- Monthly P&I
- —
- Monthly cashflow
- —
- DSCR
- —
- Eligible?
- —
No personal income docs; deal must DSCR.
Hard money
10% down · 12.0% · 12mo
- Down + closing
- —
- Monthly P&I
- —
- Monthly cashflow
- —
- DSCR
- —
- Eligible?
- —
Short-term bridge; refi at stabilization.
Rent comps 16 comps
| Address | Beds | Baths | Sqft | Rent | $/sqft | DOM | Units | Dist |
|---|---|---|---|---|---|---|---|---|
| 573 Spanish Dr N Longboat Key, FL | 2.0 | 2.0 | 1380 | $3,500 | $2.54 | 16d | 1 | 0.05mi |
| 676 El Centro Longboat Key, FL | 2.0 | 2.0 | 1427 | $3,250 | $2.28 | 23d | 1 | 0.08mi |
| 535 Forest Way Longboat Key, FL | 2.0 | 2.5 | 1440 | $6,900 | $4.79 | 23d | 1 | 0.13mi |
| 655 Cedars Ct #655 Longboat Key, FL | 1.0 | 2.0 | 1244 | $7,000 | $5.63 | 23d | 1 | 0.14mi |
| 730 Spanish Dr S #99 Longboat Key, FL | 2.0 | 2.0 | 1255 | $2,800 | $2.23 | 2d | 1 | 0.14mi |
| 820 Spanish Dr S Longboat Key, FL | 2.0 | 2.0 | 1390 | $3,000 | $2.16 | 16d | 1 | 0.22mi |
| 5621 Gulf of Mexico Dr #103 Longboat Key, FL | 3.0 | 2.0 | 1731 | $5,500 | $3.18 | 23d | 1 | 0.28mi |
| 5621 Gulf of Mexico Dr #102 Longboat Key, FL | 2.0 | 2.0 | 1346 | $6,000 | $4.46 | 23d | 1 | 0.28mi |
| 5611 Gulf of Mexico Dr #3 Longboat Key, FL | 3.0 | 2.0 | 1635 | $5,000 | $3.06 | 23d | 1 | 0.30mi |
| 5611 Gulf of Mexico Dr #5 Longboat Key, FL | 3.0 | 3.0 | 1672 | $7,750 | $4.64 | 23d | 1 | 0.30mi |
| 5611 Gulf of Mexico Dr #1 Longboat Key, FL | 3.0 | 2.0 | 1675 | $14,000 | $8.36 | 23d | 1 | 0.30mi |
| 914 Spanish Dr S #76 Longboat Key, FL | 2.0 | 2.0 | 1341 | $6,500 | $4.85 | 23d | 1 | 0.33mi |
| 957 Spanish Dr N Longboat Key, FL | 2.0 | 2.0 | 1399 | $5,500 | $3.93 | 23d | 1 | 0.35mi |
| 615 Dream Island Rd #107 Longboat Key, FL | 2.0 | 2.0 | 1293 | $12,500 | $9.67 | 23d | 1 | 0.50mi |
| 615 Dream Island Rd #201 Longboat Key, FL | 2.0 | 2.0 | 1514 | $10,500 | $6.94 | 23d | 1 | 0.50mi |
| 4825 Gulf of Mexico Dr #201 Longboat Key, FL | 2.0 | 2.0 | 1393 | $7,800 | $5.60 | 23d | 1 | 1.33mi |
HOA detail condo
- Monthly dues
- $1,340 · $16,080/yr
- Likely covers
- electric
- Assessments
- None detected in remarks — confirm with the listing agent.
Listing history 8 events
-
2026-03-09status Pending
-
2026-01-19price $370,000
-
2025-10-21$395,000 Active
-
2009-07-13historical
-
2009-02-26$379,000
-
2005-05-23soldstatus $420,000
-
2005-05-20soldstatus $420,000 276-char remark
Show marketing remark (276 chars)
Immaculate stand alone villa offers panoramic views of the lagoon. Pride of ownership throughout with custom raised cabinets, newer plumbing, electric and roof. Protected marina, beach access and all in a very active community. This is the one to call home. Dimensions approx.
-
2005-03-23$448,000 276-char remark
Show marketing remark (276 chars)
Immaculate stand alone villa offers panoramic views of the lagoon. Pride of ownership throughout with custom raised cabinets, newer plumbing, electric and roof. Protected marina, beach access and all in a very active community. This is the one to call home. Dimensions approx.
ⓘ Source: listings_history table (triggers on properties + properties_extension) + one-shot
backfill from property_details.listing_events for pre-trigger history.
Tax reassessment forecast FL · Resets to sale price
- Current annual tax
- $3,076 · $256/mo
- Projected year-2 tax
- $3,076 · $256/mo
- Expected delta
- $0/yr ($0/mo · 0.0%)
ⓘ Screening estimate from a state-policy table — verify with the county assessor before closing.
Climate risk First Street
- Flood 10/10 Extreme FEMA zone AE · 99% chance over 30 yrs
- Wildfire 1/10 Low
- Heat 10/10 Extreme 7 d/yr ≥106°F today · 29 d/yr by 30 yrs out
- Wind 10/10 Extreme 99% chance of damaging wind over 30 yrs
- Air quality 3/10 Moderate 2 unhealthy d/yr today · 2 by 30 yrs out
Nearby sold comps map
Loading sold comps map…
Walkable amenities ~0.75 mi
Loading nearby amenities…
Taxation est. · year 1
- Rental income
- $74,608
- − Mortgage interest
- −$20,726
- − Property taxes
- −$3,076
- − Insurance
- −$6,968
- − Repairs & maintenance
- −$5,969
- − Management
- −$5,969
- − HOA
- −$16,080
- − Depreciation
- −$10,764
- Taxable income
- $5,056
- Est. tax owed @ 24.0%
- −$1,213
- After-tax cash flow
- $8,318/yr
For passive investors: Depreciation is non-cash, so a rental often shows a tax loss while cash-flowing — sheltering income. Rental losses are passive: they offset passive income freely, and up to $25,000/yr can offset ordinary (W-2) income if you actively participate and your MAGI is under $100k (phasing out to $0 by $150k); unused losses carry forward. On sale, claimed depreciation is recaptured at up to 25%, and gains may owe capital-gains tax (a 1031 exchange can defer both). Figures are a year-1 estimate at your 24.0% rate — not tax advice; consult a CPA.
Schools (NCES district)
- District
- Manatee
- NCES district ID
- 1201230
- Math proficiency
- 54% ▼ -6.00%
- Reading proficiency
- 50% ▼ -2.00%
- Median HH income
- $49,607
- Composite
- 44.43/100
- National rank
- #2806
- State rank
- #26 of 73 in FL
Livability — Longboat Key
- Score
- 64/100
- State rank
- #693
- US rank
- #14452
Category grades
Schools grade is shown separately in the Schools card above.
Census & demographics
- Census place
- Longboat Key, FL
- County
- Sarasota County · 448,376 people
- City population
- 7,539
- Metro
- North Port-Sarasota-Bradenton, FL
- Population (ZIP)
- 7,539
- Household income
- $158,030
- Rent vs Own
- Severe rent burden
- 98.0
Population outlook (Manatee County) Hauer SSP2
- Today (2025)
- 447,342 people
- By 2030
- 488,911 · +9.3%
- By 2040
- 567,934 · +27.0%
- By 2050
- 637,995 · +42.6%
- By 2075
- 781,970 · +74.8%
- By 2100
- 848,272 · +89.6%
Race, ethnicity, and origin ACS 2023
- Neighborhood character
- Predominantly White (93%)
- Race & ethnicity
- White 93% Hispanic / Latino 4% Two or more races 3% Asian 1%
- Common ancestry
- Scotch-Irish 7% Romanian 6% Lithuanian 4%
- Foreign-born
- 14% · Canada, China
- Languages at home
- 92% English-only · Spanish 2% Other Indo-European 2% German/W. Germanic 2%
Political lean MEDSL · Manatee
- 2024 margin
- Strong R (+23.5) · D 37.9% · R 61.4%
- 2008→2024 swing
- -16.5pp toward R · 2008: -7.0pp · 2024: -23.5pp
- All cycles
- 2024: R+23.5 2020: R+16.1 2016: R+17.1 2012: R+12.5 2008: R+7.0
Not yet ingested
- Civics
- —
Market trends
- HPI YoY
- ▲ 0.73%
- Current HPI
- 234.5017
- Rent YoY
- —
- Metro
- North Port-Sarasota-Bradenton, FL
- State GDP YoY
- ▲ 3.28%
- F500 in state
- 36
Industry mix (Fortune 500 HQ in FL)
| Industry | F500 HQs | Revenue |
|---|---|---|
| Industrial Technology | 2 | $29B |
|
||
| Insurance | 2 | $17B |
|
||
| Retail | 1 | $60B |
|
||
| Technology Distribution | 1 | $58B |
|
||
| Homebuilding | 1 | $35B |
|
||
| Technology Manufacturing | 1 | $35B |
|
||
Price history
-17.4% since first listed8 events — show timeline
- 2026-03-09 Pending — Stellar MLS as Distributed by MLS Grid
- 2026-01-19 Price Changed $370,000 Stellar MLS as Distributed by MLS Grid
- 2025-10-21 Listed $395,000 Stellar MLS as Distributed by MLS Grid
- 2009-07-13 Listing Removed — Stellar MLS as Distributed by MLS Grid
- 2009-02-26 Listed $379,000 Stellar MLS as Distributed by MLS Grid
- 2005-05-23 Sold (Public Records) $420,000 Public Records
- 2005-05-20 Sold (MLS) $420,000 Stellar MLS as Distributed by MLS Grid
- 2005-03-23 Listed $448,000 Stellar MLS as Distributed by MLS Grid
Property tax history
-1.9%/yrLatest (2025): $3,076 · -60.1% YoY. Source: county tax records.
Cash-flow waterfall
monthlySold comps — $/sqft
last 12 mo · ≤1 miLoading sold comps…