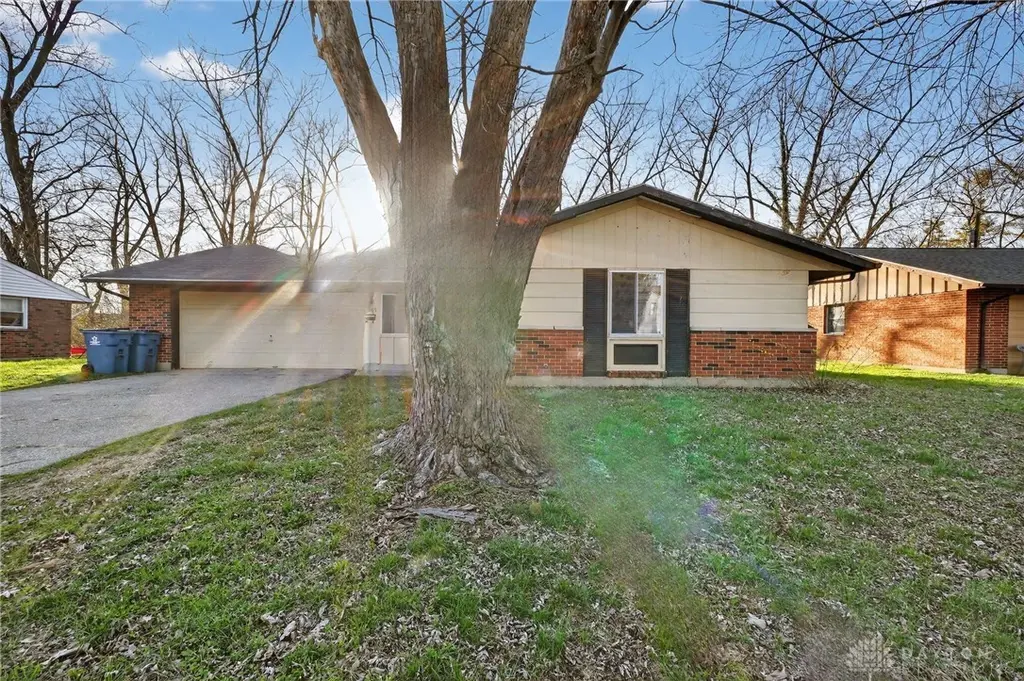
4443 Nowak Ave · Huber Heights, OH
Flood risk 1/10 · Minimal
- FEMA flood zone
- X (unshaded)
- Chance of flooding over 30 yrs
- 0.0%
- Est. flood insurance / yr
- $507 – $1,088
Fire risk 1/10 · Minimal
- Est. fire insurance / yr
- $713 – $1,323
Heat risk 3/10 · Minor
- Hot days now (above 102°F)
- 7 days/yr
- Hot days in 30 yrs
- 18 days/yr
Wind risk 2/10 · Minimal
- Chance of severe wind over 30 yrs
- —
Air-quality risk 4/10 · Minor
- Unhealthy air days now
- 4 days/yr
- Unhealthy air days in 30 yrs
- 5 days/yr
Risk factors via First Street. Map © Google.
Why this score? — see what drove the D grade
The composite is a weighted blend of 9 inputs, each scored 0–100. Each bar is that input's sub-score; the figure is the points it added to the 100-point composite (weight × sub-score).
- Cash flow +13.1/30.0
- ARV discount +9.1/15.0
- DSCR +3.9/10.0
- 1% rule +3.6/10.0
- Livability +3.6/5.0
- Schools +3.3/10.0
- Rent growth +2.6/5.0
- Condition / age +2.5/5.0
- Appreciation +0.0/10.0
$194,900
🖨 Deal sheet (PDF) 📄 Offer letter ✓ Due diligence
Listing remarks MLS
Welcome to this well-located home in Huber Heights! Situated on a quiet street, this property offers comfortable living spaces, a functional layout, and plenty of natural light. The spacious yard provides great potential for outdoor enjoyment, entertaining, or gardening. Conveniently located near shopping, dining, and major highways, this home is a fantastic opportunity for homeowners and investors alike.
Key facts
- Quiet street
- Spacious yard
- Natural light
Tags
Neighborhood map
What this means for you Summary
Snapshot
- This is a 4-bed/2.0-bath single-family listed at $195k.
Deal economics
- At list price, monthly cash flow is $-7 ($-86/yr) — negative.
- To cash-flow at today's rent, offer at most $194k (0.7% below list).
- To meet the 1% rule (rent ≥ 1% of price), the offer needs to be $168k (13.6% below list).
- Recommended offer: $168k (13.6% below list) — sets the bar for 1% rule.
- Cap rate 6.2% vs local median 3.5% in Huber Heights — top-decile yield for the area; either an underpriced asset or a hidden risk that comps aren't pricing in. Stress-test before assuming the spread holds.
Location & tenants
- Location reads 71/100 on livability (#436 in OH) — a middle-class / working-renter tenant base. Strengths: cost of living A+, housing A+, crime B; Watch: amenities F, commute F, health & safety F.
- Huber Heights City (suburban): math 29% / reading 47% proficiency, ranked #544 of 656 in OH (top 83%) — families likely to look elsewhere, expect single-tenant / working-renter base with shorter leases.
- Zoned schools: Wright Brothers Elementary School (math 38% / reading 48%, grade F, #1,023 of 1,584 statewide, top 65%, 688 students, 56% FRL); Weisenborn Junior High (math 26% / reading 46%, grade F, #541 of 654 statewide, top 83%, 937 students, 55% FRL); Wayne High School (math 14% / reading 53%, grade F, #598 of 781 statewide, top 77%, 1,743 students, 51% FRL).
- Market conditions: Rents flat; 200 active listings in the ZIP; 19 comparable units currently listed for rent nearby; rentals at typical pace (median 23d on market — plan ~3-4 weeks tenant-placement turnaround); 42% of comp listings sitting > 30 days — soft ceiling on asking rent; solid renter incomes; 907 units permitted in Montgomery County in 2024 (416 in 5+ unit buildings).
Forward outlook
- Local home prices are declining (-3.0%/yr); year-one equity from $1k of loan paydown is wiped out by about $6k of value loss. Plan a longer hold.
- Montgomery County population projected at -10% by 2050 — secular population decline; favor cash flow + early exit over multi-decade hold.
Negotiation context
- It's been on market 83 days — a 6% lower offer ($183k) is reasonable based on typical stale-listing flexibility.
Questions for the listing agent
- What do current leases actually rent for vs. the listed asking? Can we see a recent rent roll and the last 12 months of T-12 income?
- It's been on market 83 days. Have you received any prior offers? Is the seller open to a 14% concession, seller financing, or rate buy-down credit?
- Built in 1963 — when were the roof, HVAC, electrical panel, plumbing, and water heater last replaced?
- Why hasn't it sold? Are there any deal-killer items the seller is aware of (foundation, flood, title, zoning, code violations)?
- Is there a deadline driving the sale (1031 exchange, divorce, estate, relocation)? That informs how much negotiation room exists.
- Schools are B-rated — typically a magnet for longer-tenancy family renters. What's the average tenant stay here, and is there a school-zone premium baked into asking?
- The area grade is low — what's the realistic commute time and amenity access for the typical tenant pool here? Any planned neighborhood developments (good or bad) we should know about?
- What's the average days-on-market for RENTAL listings here right now (not sales)? A rising rental-DOM trend means longer vacancies and softer asking-rent achievability than the comps imply.
- What's the recent tenant-quality profile in this submarket — average credit score on applications, eviction rate, late-payment / NSF rate, and stable-employment percentage? A property-management company in the area should have these aggregated.
- How much new for-sale + rental construction is in the pipeline within 1–3 miles? Heavy new supply typically softens prices + rents 12–24 months out; constrained supply supports both.
Investment metrics
- 1% rule
- 0.86% ✗
- Cap rate
- 6.25%
- Cash-on-cash
- -0.16%
- DSCR
- 0.99
- GRM
- 9.6
CMA / ARV
- ARV (median comp)
- $201,958
- List price
- $194,900
- Delta
- -3.49%
- Verdict
- FAIR
- Comps
- 20 within 1.0 mi
Show comp detail 12 sales within ~0.75 mi
| Address | Dist | Beds/Ba | Sqft | Sold | Price | $/sf | Match |
|---|---|---|---|---|---|---|---|
| 4581 Pennyston Ave | 0.09mi | 4/2.0 | 1,579 (+3%) | 1mo | $256,000 | $162 | 90 |
| 4612 Passaic Ct | 0.25mi | 4/2.0 | 1,579 (+3%) | 2mo | $280,000 | $177 | 82 |
| 4390 Mahler Dr | 0.25mi | 3/2.0 (-1) | 1,404 (-9%) | 1mo | $245,000 | $175 | 68 |
| 4838 Pacific Ct | 0.40mi | 3/2.0 (-1) | 1,483 (-4%) | 5mo | $199,900 | $135 | 66 |
| 4300 Lambeth Dr | 0.33mi | 3/2.0 (-1) | 1,440 (-6%) | 5mo | $134,000 | $93 | 65 |
| 4364 Leston Ave | 0.29mi | 3/2.0 (-1) | 1,404 (-9%) | 6mo | $209,900 | $150 | 62 |
| 4507 Longfellow Ave | 0.38mi | 3/2.0 (-1) | 1,404 (-9%) | 1mo | $210,000 | $150 | 61 |
| 5100 Pocono Dr | 0.66mi | 3/2.0 (-1) | 1,574 (+2%) | 2mo | $225,000 | $143 | 59 |
| 5030 Renard Dr | 0.66mi | 4/2.0 | 1,444 (-6%) | 2mo | $220,000 | $152 | 57 |
| 4420 Kitridge Rd | 0.60mi | 4/2.0 | 1,404 (-9%) | 6mo | $180,000 | $128 | 52 |
| 4678 Longfellow Ave | 0.68mi | 4/2.0 | 1,404 (-9%) | 4mo | $202,000 | $144 | 50 |
| 5004 Fishburg Rd | 0.67mi | 3/2.0 (-1) | 1,404 (-9%) | 5mo | $216,900 | $154 | 45 |
Match score weights: distance 35% · size 25% · config 20% · recency 20%. Top-matched comps best support the ARV.
Projected returns pro-forma
-3.0% appreciation · 0.23% rent growth · sell at horizon
- IRR
- -19.7%
- Equity multiple
- 0.33×
- Total profit
- $-36,590
- Equity at exit
- $29,060
- IRR
- -19.8%
- Equity multiple
- 0.08×
- Total profit
- $-50,110
- Equity at exit
- $16,851
Cash invested: $54,572 (down + closing). Projections, not guarantees.
Landlord ↔ Tenant lean methodology
- Overall (STATE)
- 73 Landlord-Friendly
- State Ohio
- 73 Landlord-Friendly · R+6
- County
- — inherits STATE
- City
- — inherits STATE
ZIP-level market 45424
- Rents YoY
- 0.2%
- Active inventory
- 200
- Price-to-rent
- 9.6×
Monthly cashflow live
- Estimated rent
- $1,685 high interval (Pro) →
- Mortgage (P&I)
- −$1,022
- Tax from tax record
- −$235 /mo · $2,820/yr
- Insurance
- −$81
- HOA
- −$0
- Vacancy / Maint / Mgmt
- −$354
- Net cashflow
- $-7
Break-even live
Sensitivity live
| Price | -10% $103 | -5% $48 | +0% $-7 | +5% $-62 | +10% $-118 |
|---|---|---|---|---|---|
| Rent | -10% $-140 | -5% $-74 | +0% $-7 | +5% $59 | +10% $126 |
| Rate | -1.0pp $91 | -0.5pp $42 | base $-7 | +0.5pp $-58 | +1.0pp $-109 |
UW: 25.0% down · 7.5% · 30yr · 1.5% tax · 5.0% vac · 8.0% maint · 8.0% mgmt
Financing live
Cash to close
- Down payment
- $48,725
- Closing costs
- $5,847
- Reserves months
- —
- Total cash needed
- —
Loan-product check · same deal, 3 products live
Conventional
25% down · 7.5% · 30yr
- Down + closing
- —
- Monthly P&I
- —
- Monthly cashflow
- —
- DSCR
- —
- Eligible?
- —
Personal DTI + credit; lowest rate.
DSCR
20% down · 8.5% · 30yr
- Down + closing
- —
- Monthly P&I
- —
- Monthly cashflow
- —
- DSCR
- —
- Eligible?
- —
No personal income docs; deal must DSCR.
Hard money
10% down · 12.0% · 12mo
- Down + closing
- —
- Monthly P&I
- —
- Monthly cashflow
- —
- DSCR
- —
- Eligible?
- —
Short-term bridge; refi at stabilization.
Rent comps 19 comps
| Address | Beds | Baths | Sqft | Rent | $/sqft | DOM | Units | Dist |
|---|---|---|---|---|---|---|---|---|
| 4506 Powell Rd Dayton, OH | 3.0 | 2.0 | 1080 | $1,500 | $1.39 | 45d | 1 | 0.28mi |
| 5269 Harshmanville Rd Dayton, OH | 3.0 | 2.0 | 1080 | $1,525 | $1.41 | 45d | 1 | 0.33mi |
| 4541 Kapp Dr Dayton, OH | 3.0 | 2.0 | 1080 | $1,800 | $1.67 | 4d | 1 | 0.36mi |
| 5784 Traymore Dr Dayton, OH | 3.0 | 2.0 | 1080 | $1,525 | $1.41 | 45d | 1 | 0.51mi |
| 5020 Packard Dr Dayton, OH | 3.0 | 2.0 | 1080 | $1,495 | $1.38 | 20d | 1 | 0.54mi |
| 5131 Kuder Pl Dayton, OH | 3.0 | 2.0 | 1080 | $1,600 | $1.48 | 4d | 1 | 0.56mi |
| 5896 Harshmanville Rd Dayton, OH | 3.0 | 2.0 | 1068 | $1,345 | $1.26 | 13d | 1 | 0.63mi |
| 5225 Buckner Dr Dayton, OH | 3.0 | 2.0 | 1080 | $1,300 | $1.20 | 4d | 1 | 0.87mi |
| 5512 Shady Oak St Dayton, OH | 4.0 | 2.0 | 1404 | $1,645 | $1.17 | 45d | 1 | 0.90mi |
| 6208 Cruxten Dr Dayton, OH | 4.0 | 2.0 | 1350 | $1,800 | $1.33 | 4d | 1 | 0.91mi |
| 5257 Powell Rd Dayton, OH | 4.0 | 2.0 | 1155 | $1,850 | $1.60 | 45d | 1 | 0.98mi |
| 5595 Shady Oak St Dayton, OH | 3.0 | 2.0 | 1080 | $1,700 | $1.57 | 4d | 1 | 1.09mi |
| 5417 Coleraine Dr Dayton, OH | 3.0 | 2.0 | 1248 | $1,395 | $1.12 | 23d | 1 | 1.12mi |
| 4028 Hemlock Ct Dayton, OH | 3.0 | 2.5 | 1312 | $2,200 | $1.68 | 4d | 1 | 1.18mi |
| 4034 Hemlock Ct Dayton, OH | 3.0 | 2.5 | 1312 | $2,200 | $1.68 | 4d | 1 | 1.18mi |
| 5664 Troy Villa Blvd Huber Heights, OH | 3.0 | 2.0 | 1119 | $1,195 | $1.07 | 25d | 1 | 1.31mi |
| 5698 Troy Villa Blvd Huber Heights, OH | 3.0 | 2.0 | 1119 | $1,195 | $1.07 | 45d | 1 | 1.36mi |
| 6752 Hubbard Dr Dayton, OH | 3.0 | 2.0 | 1376 | $1,395 | $1.01 | 45d | 1 | 1.42mi |
| 5648 Troy Villa Blvd Huber Heights, OH | 3.0 | 2.0 | 1409 | $1,195 | $0.85 | 45d | 1 | 1.42mi |
Listing history 18 events
-
2026-06-21days on market $194,900 Active 83 DOM
-
2026-06-18days on market $194,900 Active 80 DOM
-
2026-06-17days on market $194,900 Active 79 DOM
-
2026-06-16days on market $194,900 Active 78 DOM
-
2026-06-15days on market $194,900 Active 77 DOM
-
2026-06-14days on market $194,900 Active 75 DOM
-
2026-06-13days on market $194,900 Active 74 DOM
-
2026-06-10days on market $194,900 Active 72 DOM
-
2026-06-09days on market $194,900 Active 71 DOM
-
2026-06-08days on market $194,900 Active 70 DOM
-
2026-06-07pricedays on market $194,900 Active 69 DOM
-
2026-06-03days on market $204,900 Active 65 DOM
-
2026-06-02days on market $204,900 Active 64 DOM
-
2026-06-01days on market $204,900 Active 63 DOM
-
2026-05-31days on market $204,900 Active 62 DOM
-
2026-05-14price $204,900 408-char remark
Show marketing remark (408 chars)
Welcome to this well-located home in Huber Heights! Situated on a quiet street, this property offers comfortable living spaces, a functional layout, and plenty of natural light. The spacious yard provides great potential for outdoor enjoyment, entertaining, or gardening. Conveniently located near shopping, dining, and major highways, this home is a fantastic opportunity for homeowners and investors alike.
-
2026-03-31$214,900 Active 408-char remark
Show marketing remark (408 chars)
Welcome to this well-located home in Huber Heights! Situated on a quiet street, this property offers comfortable living spaces, a functional layout, and plenty of natural light. The spacious yard provides great potential for outdoor enjoyment, entertaining, or gardening. Conveniently located near shopping, dining, and major highways, this home is a fantastic opportunity for homeowners and investors alike.
-
2024-12-20soldstatus $10,910,000
ⓘ Source: listings_history table (triggers on properties + properties_extension) + one-shot
backfill from property_details.listing_events for pre-trigger history.
Tax reassessment forecast OH · Partial reset (capped growth)
- Current annual tax
- $2,820 · $235/mo
- Projected year-2 tax
- $2,930 · $244/mo
- Expected delta
- +$110/yr (+$9/mo · 3.9%)
ⓘ Screening estimate from a state-policy table — verify with the county assessor before closing.
Climate risk First Street
- Flood 1/10 Low FEMA zone X (unshaded) · 0% chance over 30 yrs
- Wildfire 1/10 Low
- Heat 3/10 Moderate 7 d/yr ≥102°F today · 18 d/yr by 30 yrs out
- Wind 2/10 Low
- Air quality 4/10 Moderate 4 unhealthy d/yr today · 5 by 30 yrs out
Nearby sold comps map
Loading sold comps map…
Walkable amenities ~0.75 mi
Loading nearby amenities…
Taxation est. · year 1
- Rental income
- $20,219
- − Mortgage interest
- −$10,917
- − Property taxes
- −$2,820
- − Insurance
- −$974
- − Repairs & maintenance
- −$1,617
- − Management
- −$1,617
- − Depreciation
- −$5,670
- Taxable loss
- −$3,398
- Est. tax savings @ 24.0%
- +$815
- After-tax cash flow
- $729/yr
For passive investors: Depreciation is non-cash, so a rental often shows a tax loss while cash-flowing — sheltering income. Rental losses are passive: they offset passive income freely, and up to $25,000/yr can offset ordinary (W-2) income if you actively participate and your MAGI is under $100k (phasing out to $0 by $150k); unused losses carry forward. On sale, claimed depreciation is recaptured at up to 25%, and gains may owe capital-gains tax (a 1031 exchange can defer both). Figures are a year-1 estimate at your 24.0% rate — not tax advice; consult a CPA.
Schools (NCES district)
- District
- Huber Heights City
- NCES district ID
- 3904875
- Math proficiency
- 29% ▼ -22.00%
- Reading proficiency
- 47% ▼ -11.00%
- Median HH income
- $55,943
- Composite
- 33.33/100
- National rank
- #5499
- State rank
- #544 of 656 in OH
Livability — Huber Heights
- Score
- 71/100
- State rank
- #436
- US rank
- #7187
Category grades
Schools grade is shown separately in the Schools card above.
Census & demographics
- Census place
- Huber Heights, OH
- County
- Montgomery County · 459,541 people
- City population
- 50,725
- Metro
- Dayton-Kettering, OH
- Population (ZIP)
- 50,725
- Household income
- $80,605
- Rent vs Own
- Severe rent burden
- 911.0
Population outlook (Montgomery County) Hauer SSP2
- Today (2025)
- 523,241 people
- By 2030
- 514,948 · -1.6%
- By 2040
- 493,378 · -5.7%
- By 2050
- 469,639 · -10.2%
- By 2075
- 418,360 · -20.0%
- By 2100
- 353,315 · -32.5%
Race, ethnicity, and origin ACS 2023
- Neighborhood character
- Predominantly White (71%)
- Race & ethnicity
- White 71% Black 15% Two or more races 8% Hispanic / Latino 5% Asian 3%
- Common ancestry
- Slovak 2% Lithuanian 2% Italian 2%
- Foreign-born
- 7% · Canada, Vietnam, South Korea
- Languages at home
- 91% English-only · Spanish 3% Other Asian/Pacific 2% Tagalog/Filipino 1%
Political lean MEDSL · Montgomery
- 2024 margin
- Toss-up / Even · D 49.8% · R 49.3%
- 2008→2024 swing
- -5.8pp toward R · 2008: 6.2pp · 2024: 0.5pp
- All cycles
- 2024: D+0.5 2020: D+2.2 2016: R+1.2 2012: D+3.1 2008: D+6.2
Not yet ingested
- Civics
- —
Market trends
- HPI YoY
- ▼ -228.44%
- Current HPI
- 161.8116
- Rent YoY
- ▲ 0.23%
- Metro
- Dayton-Kettering, OH
- State GDP YoY
- ▲ 1.98%
- F500 in state
- 48
Industry mix (Fortune 500 HQ in OH)
| Industry | F500 HQs | Revenue |
|---|---|---|
| Insurance | 3 | $145B |
|
||
| Industrial Machinery | 3 | $49B |
|
||
| Financial Services | 3 | $24B |
|
||
| Consumer Goods | 2 | $93B |
|
||
| Aerospace / Defense | 2 | $47B |
|
||
| Utilities | 2 | $33B |
|
||
Price history
-98.1% since first listed3 events — show timeline
- 2026-05-14 Price Changed $204,900 Dayton MLS
- 2026-03-31 Listed $214,900 Dayton MLS
- 2024-12-20 Sold (Public Records) $10,910,000 Public Records
Property tax history
+1.0%/yrLatest (2025): $2,820 · -0.0% YoY. Source: county tax records.
Cash-flow waterfall
monthlySold comps — $/sqft
last 12 mo · ≤1 miLoading sold comps…