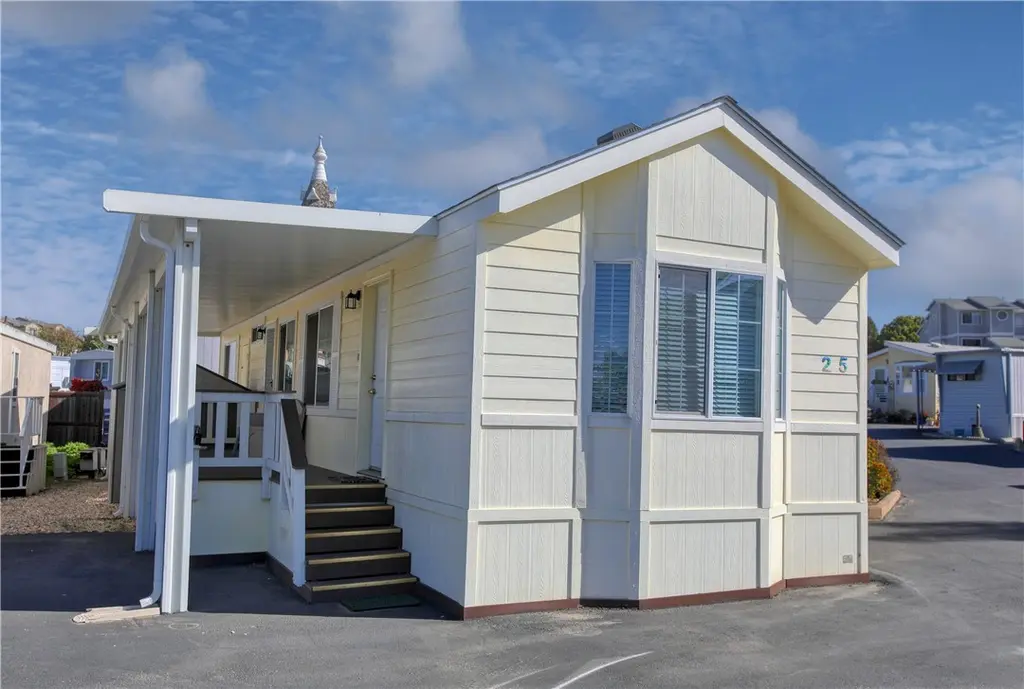
2531 Cienaga #25 · Oceano, CA
Flood risk 1/10 · Minimal
- FEMA flood zone
- X (unshaded)
- Chance of flooding over 30 yrs
- 0.0%
- Est. flood insurance / yr
- $507 – $1,088
Fire risk 4/10 · Minor
- Est. fire insurance / yr
- $659 – $1,223
Heat risk 5/10 · Moderate
- Hot days now (above 80°F)
- 7 days/yr
- Hot days in 30 yrs
- 16 days/yr
Wind risk 1/10 · Minimal
- Chance of severe wind over 30 yrs
- —
Air-quality risk 6/10 · Moderate
- Unhealthy air days now
- 9 days/yr
- Unhealthy air days in 30 yrs
- 10 days/yr
Risk factors via First Street. Map © Google.
Why this score? — see what drove the D grade
The composite is a weighted blend of 9 inputs, each scored 0–100. Each bar is that input's sub-score; the figure is the points it added to the 100-point composite (weight × sub-score).
- Cash flow +18.2/30.0
- DSCR +5.7/10.0
- 1% rule +4.9/10.0
- Schools +4.5/10.0
- Livability +3.3/5.0
- Rent growth +2.5/5.0
- Condition / age +2.5/5.0
- ARV discount +0.0/15.0
- Appreciation +0.0/10.0
$175,000
🖨 Deal sheet 📄 Offer letter ✓ Due diligence
Listing remarks MLS
Good Full Or Part Time Home. Owner May Carry With 15% Down! Age Restriction May Apply. 7x19 Pop-out.
Key facts
- Open floor plan
- End unit
- Community amenities
Tags
Property features AI
Finance
- Other: Location notes: Cienaga (Hwy 1), Elm is the closest cross street; Coordinates available
- Financial info: Land lease of $514.47 per month (seller provided amount)
- HOA & community: Senior community; Park name: Casa del Rey; Community features: Biking; Manager approval required; Pets: contact manager
Exterior
- Parking: Assigned parking
- Utilities: Public/district water; Public sewer; Natural gas connected; Electricity connected; Cable connected
- Home design: Single-wide mobile home (WESTWOOD 14 model); Mobile home remains on site; Single story; Entry on first level
- Construction: Built as recorded by assessor; Mobile home dimensions approximately 13 ft by 48 ft; Shallow information from assessor (living area source: assessor's data)
- Exterior features: Private pool; One shed on the property; Lot is level/flat; Has a view
Interior
- Kitchen: Garbage disposal; Gas range and gas oven; Dishwasher
- Bedrooms: Main floor bedrooms (including primary)
- Bathrooms: 1 full bathroom
- Heating & cooling: Forced air heating
- Interior features: Ceiling fan; Open floor plan; Single-level home; Main floor primary bedroom; All bedrooms on the main floor; Walk-in closet
- Laundry & utility: Washer included; Dryer included; Has laundry
Neighborhood map
What this means for you Summary
Snapshot
- This is a 1-bed/1.0-bath manufactured listed at $175k.
Deal economics
- At list price, monthly cash flow is $156 ($2k/yr) — positive.
- The deal already cash-flows at list — no discount required.
- To meet the 1% rule (rent ≥ 1% of price), the offer needs to be $173k (1.3% below list).
- Recommended offer: $172k (1.5% below list) — sets the bar for market timing.
- Cap rate 7.4% vs local median 2.5% in Oceano — top-decile yield for the area; either an underpriced asset or a hidden risk that comps aren't pricing in. Stress-test before assuming the spread holds.
Location & tenants
- Location reads 66/100 on livability (#346 in CA) — a middle-class / working-renter tenant base. Strengths: employment A, health & safety A, housing B; Watch: crime D, amenities D, schools F.
- Lucia Mar Unified (town): math 42% / reading 56% proficiency, ranked #433 of 1,400 in CA (top 31%) — families likely to look elsewhere, expect single-tenant / working-renter base with shorter leases.
- Market conditions: 36 active listings in the ZIP; 3 comparable units currently listed for rent nearby; rentals at typical pace (median 24d on market — plan ~3-4 weeks tenant-placement turnaround); 1,104 units permitted in San Luis Obispo County in 2024 (273 in 5+ unit buildings).
Forward outlook
- Local home prices are declining (-3.0%/yr); year-one equity from $1k of loan paydown is wiped out by about $5k of value loss. Plan a longer hold.
- San Luis Obispo County population projected at +20% by 2050 — long-run rental-demand tailwind backs the buy-and-hold thesis.
Negotiation context
- It's been on market 30 days — a 2% lower offer ($172k) is reasonable based on typical stale-listing flexibility.
- 3 sale attempts since 32y ago with the ask held roughly flat each time — persistent listings suggest the price (not the market) is what's stuck; bring a comps-based counter.
- Current owner paid $12k; list at $175k implies a 1358% gain — meaningful room to come down on a strong offer.
Risks & watch-outs
- Climate carrying-cost: extreme-heat days projected 7→16/yr by 2055 (HVAC capex compounding) — expect insurance premiums to compound above CPI over the hold.
Questions for the listing agent
- Is there a deadline driving the sale (1031 exchange, divorce, estate, relocation)? That informs how much negotiation room exists.
- Schools are F-rated, which usually means shorter tenancies and higher turnover. Who's the typical renter profile here, and what's been the actual vacancy rate?
- Crime grade is D in this area — have there been break-ins, vandalism, or insurance claims at this property in the last 3 years? What carrier currently insures it and at what premium?
- The area grade is low — what's the realistic commute time and amenity access for the typical tenant pool here? Any planned neighborhood developments (good or bad) we should know about?
- What's the average days-on-market for RENTAL listings here right now (not sales)? A rising rental-DOM trend means longer vacancies and softer asking-rent achievability than the comps imply.
- What's the recent tenant-quality profile in this submarket — average credit score on applications, eviction rate, late-payment / NSF rate, and stable-employment percentage? A property-management company in the area should have these aggregated.
- How much new for-sale + rental construction is in the pipeline within 1–3 miles? Heavy new supply typically softens prices + rents 12–24 months out; constrained supply supports both.
Investment metrics
- 1% rule
- 0.99% ✗
- Cap rate
- 7.36%
- Cash-on-cash
- 3.82%
- DSCR
- 1.17
- GRM
- 8.4
CMA / ARV
- ARV (on-the-fly)
- $145,842
- Comps found
- 5
Show comp detail 5 sales within ~0.75 mi
| Address | Dist | Beds/Ba | Sqft | Sold | Price | $/sf | Match |
|---|---|---|---|---|---|---|---|
| 2531 Cienaga St #27 | 0.00mi | 1/1.0 | 621 (-5%) | 24mo | $81,457 | $131 | 72 |
| 2531 Cienaga St #39 | 0.00mi | 2/1.0 (+1) | 700 (+7%) | 24mo | $209,900 | $300 | 64 |
| 2300 Cienaga #36 | 0.25mi | 2/2.0 (+1) | 720 (+10%) | 5mo | $250,000 | $347 | 58 |
| 2531 Cienaga St #28 | 0.00mi | 2/2.0 (+1) | 750 (+15%) | 10mo | $164,000 | $219 | 58 |
| 1241 Farroll Ave #58 | 0.71mi | 2/1.0 (+1) | 696 (+6%) | 8mo | $155,000 | $223 | 44 |
Match score weights: distance 35% · size 25% · config 20% · recency 20%. Top-matched comps best support the ARV.
Projected returns pro-forma
-3.0% appreciation · 3.0% rent growth · sell at horizon
- IRR
- -10.3%
- Equity multiple
- 0.62×
- Total profit
- $-18,407
- Equity at exit
- $26,093
- IRR
- -0.9%
- Equity multiple
- 0.94×
- Total profit
- $-3,142
- Equity at exit
- $15,131
Cash invested: $49,000 (down + closing). Projections, not guarantees.
Landlord ↔ Tenant lean methodology
- Overall (STATE)
- 18 Strongly Tenant-Friendly
- State California
- 18 Strongly Tenant-Friendly · D+13
- County
- — inherits STATE
- City
- — inherits STATE
ZIP-level market 93445
- Home prices YoY
- -24.0%
- Active inventory
- 36
- Price-to-rent
- 8.4×
Monthly cashflow live
- Estimated rent
- $1,728 medium interval (Pro) →
- Mortgage (P&I)
- −$918
- Tax est. 1.5%
- −$219 /mo · $2,625/yr
- Insurance
- −$73
- HOA
- −$0
- Vacancy / Maint / Mgmt
- −$363
- Net cashflow
- $156
Break-even live
UW: 25.0% down · 7.5% · 30yr · 1.5% tax · 5.0% vac · 8.0% maint · 8.0% mgmt
Financing live
Cash to close
- Down payment
- $43,750
- Closing costs
- $5,250
- Reserves months
- —
- Total cash needed
- —
Loan-product check · same deal, 3 products live
Conventional
25% down · 7.5% · 30yr
- Down + closing
- —
- Monthly P&I
- —
- Monthly cashflow
- —
- DSCR
- —
- Eligible?
- —
Personal DTI + credit; lowest rate.
DSCR
20% down · 8.5% · 30yr
- Down + closing
- —
- Monthly P&I
- —
- Monthly cashflow
- —
- DSCR
- —
- Eligible?
- —
No personal income docs; deal must DSCR.
Hard money
10% down · 12.0% · 12mo
- Down + closing
- —
- Monthly P&I
- —
- Monthly cashflow
- —
- DSCR
- —
- Eligible?
- —
Short-term bridge; refi at stabilization.
Rent comps 3 comps
| Address | Beds | Baths | Sqft | Rent | $/sqft | DOM | Units | Dist |
|---|---|---|---|---|---|---|---|---|
| 2531 Cienaga St #24 Oceano, CA | 1.0 | 1.0 | 352 | $1,725 | $4.90 | 23d | 1 | 0.04mi |
| 1480 S 13th St Unit 1480B Oceano, CA | 1.0 | 1.0 | 500 | $1,650 | $3.30 | 14d | 1 | 0.91mi |
| 230 S Alpine St Unit 04 Arroyo Grande, CA | — | 1.0 | 400 | $1,900 | $4.75 | 23d | 1 | 1.28mi |
Listing history 20 events
-
2026-06-18days on market $175,000 Active 30 DOM
-
2026-06-17days on market $175,000 Active 29 DOM
-
2026-06-16days on market $175,000 Active 28 DOM
-
2026-06-15days on market $175,000 Active 27 DOM
-
2026-06-14days on market $175,000 Active 25 DOM
-
2026-06-13days on market $175,000 Active 24 DOM
-
2026-06-10days on market $175,000 Active 22 DOM
-
2026-06-09days on market $175,000 Active 21 DOM
-
2026-06-08days on market $175,000 Active 20 DOM
-
2026-06-07days on market $175,000 Active 19 DOM
-
2026-06-03days on market $175,000 Active 15 DOM
-
2026-06-02days on market $175,000 Active 14 DOM
-
2026-06-01days on market $175,000 Active 13 DOM
-
2026-05-31days on market $175,000 Active 12 DOM
-
2026-05-30days on market $175,000 Active 11 DOM
-
2026-05-19$175,000 Active
-
1995-03-01historical
Show marketing remark (100 chars)
Good Full Or Part Time Home. Owner May Carry With 15% Down! Age Restriction May Apply. 7x19 Pop-out.
-
1995-03-01soldstatus $12,000 100-char remark
Show marketing remark (100 chars)
Good Full Or Part Time Home. Owner May Carry With 15% Down! Age Restriction May Apply. 7x19 Pop-out.
-
1994-02-24$13,500
Show marketing remark (100 chars)
Good Full Or Part Time Home. Owner May Carry With 15% Down! Age Restriction May Apply. 7x19 Pop-out.
-
1994-02-24$13,500 100-char remark
Show marketing remark (100 chars)
Good Full Or Part Time Home. Owner May Carry With 15% Down! Age Restriction May Apply. 7x19 Pop-out.
ⓘ Source: listings_history table (triggers on properties + properties_extension) + one-shot
backfill from property_details.listing_events for pre-trigger history.
Climate risk First Street
- Flood 1/10 Low FEMA zone X (unshaded) · 0% chance over 30 yrs
- Wildfire 4/10 Moderate
- Heat 5/10 Major 7 d/yr ≥80°F today · 16 d/yr by 30 yrs out
- Wind 1/10 Low
- Air quality 6/10 Major 9 unhealthy d/yr today · 10 by 30 yrs out
Nearby sold comps map
Loading sold comps map…
Walkable amenities ~0.75 mi
Loading nearby amenities…
Taxation est. · year 1
- Rental income
- $20,737
- − Mortgage interest
- −$9,803
- − Property taxes
- −$2,625
- − Insurance
- −$875
- − Repairs & maintenance
- −$1,659
- − Management
- −$1,659
- − Depreciation
- −$5,091
- Taxable loss
- −$974
- Est. tax savings @ 24.0%
- +$234
- After-tax cash flow
- $2,104/yr
For passive investors: Depreciation is non-cash, so a rental often shows a tax loss while cash-flowing — sheltering income. Rental losses are passive: they offset passive income freely, and up to $25,000/yr can offset ordinary (W-2) income if you actively participate and your MAGI is under $100k (phasing out to $0 by $150k); unused losses carry forward. On sale, claimed depreciation is recaptured at up to 25%, and gains may owe capital-gains tax (a 1031 exchange can defer both). Figures are a year-1 estimate at your 24.0% rate — not tax advice; consult a CPA.
Schools (NCES district)
- District
- Lucia Mar Unified
- NCES district ID
- 0623080
- Math proficiency
- 42% ▲ 3.00%
- Reading proficiency
- 56% ▲ 2.00%
- Median HH income
- $62,681
- Composite
- 45.19/100
- National rank
- #5782
- State rank
- #433 of 1400 in CA
Livability — Oceano
- Score
- 66/100
- State rank
- #346
- US rank
- #11833
Category grades
Schools grade is shown separately in the Schools card above.
Census & demographics
- Census place
- Oceano, CA
- Population (ZIP)
- 6,812
Population outlook (San Luis Obispo County) Hauer SSP2
- Today (2025)
- 306,977 people
- By 2030
- 320,378 · +4.4%
- By 2040
- 343,933 · +12.0%
- By 2050
- 366,853 · +19.5%
- By 2075
- 428,329 · +39.5%
- By 2100
- 460,687 · +50.1%
Race, ethnicity, and origin ACS 2023
- Neighborhood character
- Diverse neighborhood (Simpson 0.55)
- Race & ethnicity
- White 51% Hispanic / Latino 44% Two or more races 17% Black 1%
- Hispanic origin (detail)
- Mexican 41% Puerto Rican 1%
- Common ancestry
- Slovak 2% Portuguese 2% Iranian 2%
- Foreign-born
- 17% · Canada
- Languages at home
- 71% English-only · Spanish 28%
Political lean MEDSL · San Luis Obispo
- 2024 margin
- D (+10.9) · D 53.9% · R 43.1% · Other 3.0%
- 2008→2024 swing
- +5.5pp toward D · 2008: 5.4pp · 2024: 10.9pp
- All cycles
- 2024: D+10.9 2020: D+13.1 2016: D+8.3 2012: D+1.0 2008: D+5.4
Not yet ingested
- Civics
- —
Market trends
- HPI YoY
- ▼ -124.63%
- Current HPI
- 394.4039
- Rent YoY
- —
- Metro
- —
- State GDP YoY
- ▲ 3.21%
- F500 in state
- 116
Industry mix (Fortune 500 HQ in CA)
| Industry | F500 HQs | Revenue |
|---|---|---|
| Technology | 27 | $1,492B |
|
||
| Financial Services | 3 | $174B |
|
||
| Retail | 3 | $44B |
|
||
| Insurance | 3 | $26B |
|
||
| Media / Entertainment | 2 | $115B |
|
||
| Pharmaceuticals / Biotech | 2 | $62B |
|
||
Price history
+1196.3% since first listed5 events — show timeline
- 2026-05-19 Listed $175,000 CRMLS
- 1995-03-01 Sold (MLS) $12,000 CRMLS
- 1995-03-01 Listing Removed — NSBCRMLS
- 1994-02-24 Listed $13,500 CRMLS
- 1994-02-24 Listed $13,500 NSBCRMLS
Property tax history
-0.7%/yrLatest (2025): $336 · +1.2% YoY. Source: county tax records.
Cash-flow waterfall
monthlySold comps — $/sqft
last 12 mo · ≤1 miLoading sold comps…